

Distribution and Demography of Southwestern Willow Flycatchers in San Diego County, 2015–19
Links
- Document: Report (5 MB pdf) , HTML , XML
- Data Release: USGS data release - Southwestern Willow Flycatcher (Empidonax traillii extimus) surveys and nest monitoring in San Diego County, California
- Download citation as: RIS | Dublin Core
Acknowledgments
This research was funded by the San Diego Association of Governments. The authors thank the biologists who assisted in data collection for this project: Lisa Allen, Annabelle Bernabe, Collin Farmer, Aaron Gallagher, Jonathan Gunther, P.J. Falatek, Alexandra Houston, Marcus Hubbell, Angela Johnson, Suellen Lynn, Rachelle McLaughlin, Ryan Pottinger, Rachel del Rio, Cristina Santa Maria, Devin Taylor, Jared Taylor, Charles Vettes, and Jill Wussow. We thank the land managers, property owners, and other stakeholders who facilitated access to the survey locations, including but not limited to: Keith Greer, San Diego Association of Governments; Kris Preston, San Diego Management and Monitoring Program; Board of Directors, Richard Larsen, and Don Smith, Vista Irrigation District; Jeff Wells and Kirsten Winter, U.S. Forest Service; Pala Band of Mission Indians; City of San Diego, Department of Parks and Recreation; City of San Diego, Public Utilities Department; County of San Diego, Department of Parks and Recreation; County of San Diego, Department of Public Utilities; City of Oceanside; City of Santee; San Diego River Conservancy; State of California, Department of Fish and Wildlife; State of California, Department of Parks and Recreation; Self-Realization Fellowship Church; M V V LP; Granite Construction Company; Mission Road Partners LP; Singh Property Management Company; Sovereign Capital Management Group, Inc.; Sweetwater Authority; U.S. Fish and Wildlife Service; U.S. Navy; Private Landowners: Lakeside Land Co., Wil Wilson, Kathleen McCarthy, William Pankey, Singh Family Trust, Pantic Milan Family Trust, Rey River Ranch, Vessels Stallion Farm, San Luis Rey Downs, Rancho Monserate Homeowners Association. We are grateful for statistical assistance from Alexandra Houston, logistical assistance from Ryan Pottinger, and report review by Eben Paxton and Kristine Preston.
Executive Summary
We surveyed for Southwestern Willow Flycatchers (Empidonax traillii extimus; flycatcher) at 33 locations along multiple drainages in San Diego County, including portions of Agua Hedionda Creek, Cottonwood Creek, Escondido Creek, Los Penasquitos Creek, Otay River, San Diego River, San Dieguito River, San Luis Rey River, Sweetwater River, and Tijuana River. Resident flycatchers were only found on two drainages in San Diego County, at San Dieguito and San Luis Rey Rivers, with 99 percent occurring on the San Luis Rey River. Resident flycatchers were detected at 18 percent of survey locations (Bonsall, Cleveland National Forest, Rey River Ranch, San Dieguito, and Vista Irrigation District [VID], and VID Lake Henshaw). Resident flycatchers were documented for the first time at Lake Henshaw, the only new location surveyed that supported flycatchers. We detected a minimum of 80 resident flycatchers from 2015 to 2019, most of these were upstream and downstream from Lake Henshaw. Transient flycatchers were found at 42 percent of survey locations; 38 transient individuals were detected at Agua Hedionda Creek, Otay River, San Diego River, San Dieguito River, and the San Luis Rey River.
Over the course of this study, 11 locations historically occupied by resident flycatchers were resurveyed; only 5 were found to have resident flycatchers: (1) Bonsall, (2) Cleveland National Forest, (3) Rey River Ranch, (4) San Dieguito, and (5) Vista Irrigation District. The number of resident flycatchers declined from previous high counts at all five locations. Collectively, the number of resident flycatcher territories within the historically occupied area of the upper San Luis Rey River downstream from Lake Henshaw (Cleveland National Forest, Rey River Ranch, and Vista Irrigation District) declined 71 percent between 1999 (48) and 2019 (14); 42 percent of the decline occurred between 1999 and 2016, with an additional decline (50 percent) occurring between 2016 and 2019. In 2016, the distribution of flycatcher territories at the historically occupied area of the upper San Luis Rey River changed relative to the distribution in 1999: the proportion of territories at Cleveland National Forest and Rey River Ranch decreased to 36 percent each, while Vista Irrigation District increased to 29 percent, creating a more equal distribution of territories across the historically occupied area. By 2019, the distribution changed relative to 2016, with most of the territories spread equally between Cleveland National Forest and Rey River Ranch (43 percent each), while the proportion of territories at Vista Irrigation District declined to 14 percent.
During countywide surveys, we documented the dispersal of two natal banded flycatchers; both were females that were originally banded as nestlings at Marine Corps Base Camp Pendleton and were seen for the first time as breeding adults. One of the females dispersed to San Dieguito, a distance of 41 kilometers, and a second female dispersed to Cleveland National Forest, a distance of 55 kilometers. We also documented the within-season movement of a uniquely banded male that was seen at the beginning of the 2017 breeding season at Bonsall and was later documented at San Dieguito, a movement distance of 31 kilometers.
We completed nest monitoring activities along the upper San Luis Rey River near Lake Henshaw in Santa Ysabel, California from 2016 to 2019. Monitoring occurred at three locations: (1) Cleveland National Forest, (2) Rey River Ranch, and (3) Vista Irrigation District, collectively the upper San Luis Rey River monitoring area. The number of flycatcher territories monitored each year ranged from 14 to 27. We observed polygynous pairings (one male paired with multiple females) in all years, with the lowest rate of polygyny (number of polygynous pairs/total number of pairs) observed in 2016 (10 percent) and the highest in 2017 (70 percent). The proportion of paired males that were polygynous ranged from 5 to 54 percent between 2016 and 2019.
We monitored the nesting activity of 14–27 pairs annually during the course of the study. Most of the first nesting attempts were initiated during late May and early June. We monitored 18–41 Southwestern Willow Flycatcher nests per year from 2016 to 2019. Apparent nest success ranged from 11 to 37 percent and differed significantly by year, with higher success in 2016 and 2017 compared to 2018 and 2019. Predation was the presumed to be the primary source of nest failure, with 63–84 percent of failures annually attributed to predation. Although none of the failures were attributed to Brown-headed cowbird (Molothrus ater) parasitism, 4–27 percent of nests were parasitized annually from 2016 to 2019, with increased parasitism rates observed in 2018 and 2019 compared to 2016 and 2017. We “rescued” 11 parasitized nests between 2016 and 2019 by removing cowbird eggs; if those nests had been allowed to fail, apparent nest success would have been up to 45 percent lower annually.
Flycatcher egg clutch size ranged from 2.8±0.8 to 3.1±0.8 annually and did not vary significantly between years. The number of fledglings per pair ranged from 0.5±1.0 to 1.6±1.5 annually from 2016 to 2019. There was a significant difference in the number of young fledged per pair between years, with pairs in 2016 producing more than three times the number of fledglings compared to 2019. The percent of pairs fledging at least one young ranged from 18 to 62 percent annually but did not vary significantly by year.
Analysis of flycatcher daily nest survival rates suggested that both early and late winter precipitation influenced nest survival, with increases in early winter precipitation positively influencing nest survival and later winter precipitation negatively influencing nest survival. The second-best supported model included year, with the lowest daily nest survival occurring in 2018 and 2019.
A total of 119 flycatchers were newly banded over the course of this study; 36 adult flycatchers were banded with a unique color combination, and 83 nestlings (57 of which survived to fledging) were banded with a single band on the left or right leg. In addition, two adults that were banded before 2015 were observed in the monitoring area. Between 2015 and 2019, we accumulated 94 resights of 49 individual color-banded adult flycatchers that ranged in age from 1 to 8 years old.
Banding allowed us to examine differences in annual survivorship among flycatchers of different ages and sexes. We estimated annual survivorship of adult males to be 69±7 percent, which is higher than estimates of female survivorship (45±10 percent). Annual survivorship of first-year flycatchers ranged from 24 to 41 percent, which is roughly half the estimates calculated for adult flycatchers (52–75 percent). We found no evidence that precipitation in the previous breeding year had an effect on flycatcher survival.
We were also able to observe dispersal and movement among adults and first-year flycatchers. Average first-year dispersal distance was 3.1±2.6 kilometers, with the longest dispersal (8.5 kilometers) by a natal female dispersing from the monitoring area to Lake Henshaw. Of the first-year flycatchers, 65 percent returned to the monitoring area to establish an adult breeding territory, while the remaining 35 percent dispersed to Lake Henshaw.
Territory fidelity among adult flycatchers was high with 69±13 percent of returning adults occupying the same territory (or within 100 meters) from the previous year. There was no significant difference in territory fidelity between males and females, or across years. Nesting success in the previous year appeared to be a strong driver of territory fidelity, with adults more likely to return to the same territory following years when they successfully fledged young. The average between-year movement for returning adult flycatchers was 0.5±0.8 km. We documented the movement of two adult males from the monitoring area to Lake Henshaw. Between-year movement distances did not differ by sex or year.
Resident flycatchers in the upper San Luis Rey River monitoring area used five habitat types from 2016 to 2019: (1) willow-oak, (2) willow-ash, (3) oak-sycamore, (4) mixed willow riparian, and (5) willow-sycamore, with willow-oak the most commonly used habitat type. The most commonly recorded dominant species at flycatcher territories included coast live oak (Quercus agrifolia), red or arroyo willow (Salix laevigata or Salix lasiolepis), California sycamore (Platanus racemosa), and velvet ash (Fraxinus velutina).
In 2018, we anecdotally began to observe dead and dying oaks in the monitoring area, which we believe to be the result of goldspotted oak borer (Agrilus auroguttatus) infestation. At the conclusion of this study, we investigated the overall change in normalized difference vegetation index (NDVI) in flycatcher territories within the monitoring area. The greatest negative change in NDVI occurred in territories closest to Lake Henshaw, and many of the affected territories were no longer occupied in the later years of the study.
Flycatchers used 13 plant species for nesting at the monitoring area from 2016 to 2019; 70 percent of all nests were placed in coast live oak. None of the nest characteristics including host height, nest height, distance to the edge of the host, or distance to the edge of the vegetation clump where the nest was placed differed between years. In 2016, successful nests were placed higher than unsuccessful nests; no other within-year differences were observed.
Introduction
The Southwestern Willow Flycatcher (Empidonax traillii extimus; flycatcher) is one of four subspecies of Willow Flycatcher in the United States, with a breeding range including southern California, Arizona, New Mexico, extreme southern portions of Nevada and Utah, and western Texas (Hubbard, 1987; Unitt, 1987). Restricted to riparian habitat for breeding, the Southwestern Willow Flycatcher has declined in recent decades in response to widespread habitat loss throughout its range and, possibly, Brown-headed Cowbird (Molothrus ater; cowbird) parasitism (Wheelock, 1912; Willett, 1912, 1933; Grinnell and Miller, 1944; Remsen, 1978; Garrett and Dunn, 1981; Unitt, 1984, 1987; Gaines, 1988; Schlorff, 1990; Whitfield and Sogge, 1999). By 1993, the Southwestern Willow Flycatcher was believed to number approximately 70 pairs in California (U.S. Fish and Wildlife Service, 1993) in small disjunct populations. The Southwestern Willow Flycatcher was listed as endangered by the State of California in 1992 and by the U.S. Fish and Wildlife Service in 1995.
Willow Flycatchers in southern California co-occur with the Least Bell’s Vireo (Vireo bellii pusillus), another riparian obligate endangered by habitat loss and cowbird parasitism. However, unlike the vireo, which has increased ten-fold since the mid-1980s in response to management alleviating these threats (U.S. Fish and Wildlife Service, 2006), Willow Flycatcher numbers have remained low. Currently, most of the Southwestern Willow Flycatchers in California are concentrated at the upper San Luis Rey River, including a portion of the Cleveland National Forest in San Diego County (Howell and Kus, 2022). Outside of this location, Southwestern Willow Flycatchers occur in small, isolated populations of one to half a dozen pairs. Data on the distribution and demography of the flycatcher, as well as identification of factors limiting the species, are critical information needs during the current stage of recovery planning (Kus and others, 2003; Kus and Whitfield, 2005).
The San Luis Rey River downstream from Lake Henshaw likely supports most of the remaining flycatchers in San Diego County. This gives the San Luis Rey River significance with regard to flycatcher conservation in San Diego County, as well as statewide, at present and into the future when climate change projections suggest that inland, higher elevation sites will take on greater importance in supporting breeding populations that currently occur in coastal locations.
Although recent information on flycatcher numbers is available for a small portion of the San Luis Rey River near Lake Henshaw, there have been no comprehensive surveys for flycatchers along the rest of the drainage since 1997, and data for other drainages in the county are limited as well. Moreover, outside of a monitored population of flycatchers at Marine Corps Base Camp Pendleton (MCBCP) and an extirpated population of flycatchers at the South Fork Kern River Valley (SFKRV), few data are available on demographic characteristics of Southwestern Willow Flycatchers in California, such as annual survival, productivity, adult sex ratio, and age-structure of populations, all of which have implications for population stability and persistence.
This study was part of the San Diego Management and Monitoring Program’s (SDMMP) regional monitoring and management of sensitive species and habitats on conserved lands in western San Diego County. The SDMMP coordinates science-based biological management and monitoring of lands in San Diego that have been conserved through various conservation planning and mitigation efforts. Monitoring and research activities for Southwestern Willow Flycatchers (https://sdmmp.com/view_species.php?taxaid=712529) are being implemented by the U.S. Geological Survey (USGS) with participation of the SDMMP, wildlife agencies, landowners and managers, species experts, and scientists. The purpose of this study was to determine the size and distribution of Southwestern Willow Flycatcher populations within San Diego County, and to collect demographic data to better understand population trends and conservation needs of flycatchers. The results of this study will be used by managers to develop specific management goals and objectives to ensure the species’ continued existence in San Diego County. This report is divided into two chapters. Chapter A presents the results of field surveys in 2015–19 along the San Luis Rey River and other drainages to assess the status and trends of flycatcher populations in San Diego County. Chapter B presents the results of a demographic study of the largest remaining Southwestern Willow Flycatcher population in San Diego County to better understand the determinants of population trends, including productivity, survival, dispersal, and habitat use. All activities were carried out under a 10(a)1(A) Recovery Permit (ESPER0004080_0). Data contained in this report can be found in Howell and Kus (2022).
Chapter A—Countywide Surveys
Survey Methods
Surveys for Southwestern Willow Flycatcher were completed at 33 locations along 10 drainages in San Diego County, including portions of Agua Hedionda Creek, Cottonwood Creek, Escondido Creek, Los Penasquitos Creek, Otay River, San Diego River, San Dieguito River, San Luis Rey River, Sweetwater River, and Tijuana River (fig. 1). Locations selected for surveys were those considered to have the greatest potential for supporting breeding resident Willow Flycatchers, based either on historical occupancy by breeding flycatchers or the prediction of suitable habitat as modeled by Hatten (2016). Included in the survey, were 11 locations historically known to support breeding flycatchers in San Diego County: 7 of which were located along the San Luis Rey River (Middle San Luis Rey [B. Kus, U.S. Geological Survey, unpub. data, 2005], Bonsall [B. Kus, U.S. Geological Survey, unpub. data, 2014], Couser Canyon and Pala [Kus and others, 2003], and Cleveland National Forest, Rey River Ranch, and Vista Irrigation District [Kus and others, 1999, Varanus Biological Services, 2000, 2001]). The remaining four historic locations were on the San Diego River (El Capitan; Kus and others, 2003), San Dieguito River (San Dieguito and Santa Ysabel; Kus and Beck, 1998), and Sweetwater River (Sweetwater Authority; Kus and others, 2003). In addition, 22 survey locations were selected based on the 2013 Hatten model output, which used Landsat satellite images obtained in 2013 to identify habitat predicted to be suitable for breeding flycatchers (Hatten, 2016). In San Diego County, the model predicted 4,074 hectares (ha) of suitable habitat, 46 percent of which was surveyed during this study, with an additional 26 percent surveyed during other concurrent USGS studies at MCBCP and the lower San Luis Rey River (B. Kus, U.S. Geological Survey, unpub. data, 2015–19). Survey locations selected using the Hatten (2016) model had greater than 40-percent probability of suitable habitat, and we prioritized survey locations that included predictions in the two highest suitability categories (greater than 60 percent and greater than 80 percent; Hatten, 2016). All historic locations were predicted to be suitable by the Hatten model. Permission to access private property was obtained from landowners or administrators before performing surveys.
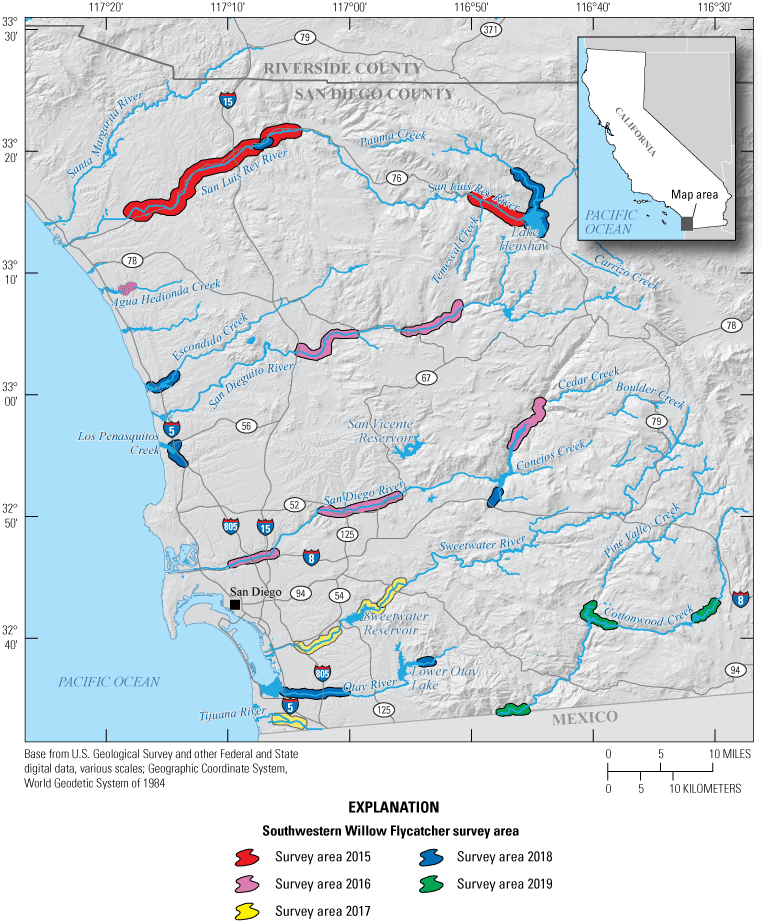
Southwestern Willow Flycatcher survey areas, San Diego County, California, 2015–19.
Three locations were surveyed annually from 2015 to 2019 (Cleveland National Forest, Rey River Ranch, and Vista Irrigation District), and Lake Henshaw was surveyed in 2018 and 2019. The remaining 29 survey locations were surveyed in a single year between 2015 and 2019. In 2015, 12 locations on the San Luis Rey River were surveyed, 6 locations on 3 drainages (Agua Hedionda Creek, San Diego River, San Dieguito River) in 2016, 4 locations on 2 drainages (Sweetwater River, Tijuana River) in 2017, 8 locations on 5 drainages (Escondido Creek, Los Penasquitos, Otay River, San Diego River, San Luis Rey River) in 2018, and 3 locations on 2 drainages (Cottonwood Creek, Tijuana River) in 2019. Investigators followed a standard call back survey protocol (Sogge and others, 2010). The protocol is designed to increase the likelihood of detecting Willow Flycatchers and aid in determining their breeding status by performing repeated surveys during the early to mid-nesting season, with four surveys carried out at least 5 days apart during three consecutive survey periods between May 15 and July 31. One survey was carried out between May 15 and May 31, one survey between June 1 and June 24, and two surveys between June 25 and July 31. Most of the locations were surveyed four times; three locations in 2015 were only surveyed three times as a result of delayed access (Couser Canyon, Pankey Ranch, and Vista Irrigation District), one location in 2016 was only surveyed three times as a result of difficult access (El Capitan), and one location in 2019 was only surveyed twice because of lack of habitat (Barrett Lake).
Surveys were carried out between dawn and early afternoon, depending on wind and weather conditions. Surveys were not performed during inclement weather such as temperatures below freezing, rain, or strong winds that inhibit detection of vocalizations. Surveys were performed by walking next to the river, using caution to avoid disturbing the habitat or damaging nests. In wider stands of habitat, observers traversed the habitat, choosing routes that permitted detection of all flycatchers throughout its extent, such as multiple straight transects, serpentine, or criss-cross routes.
Upon initiation of the survey, investigators stood quietly for 1–2 minutes (min), listening for spontaneously singing Willow Flycatchers and acclimating to surrounding conditions such as road and river noise. If no birds were detected during the initial listening period, investigators broadcasted the Willow Flycatcher song (fitzbew) using an MP3 player and an amplified speaker at the volume of normal bird songs for approximately 10–15 seconds (s), then looked and listened for approximately 1 min for a response. Song playback was ceased immediately upon detection of a Willow Flycatcher. Willow Flycatchers typically responded by moving silently toward the song, singing in response to the song, or giving some other call or vocalization. This procedure was repeated (including a 10-s quiet pre-broadcast listening period) every 20–30 meters (m) throughout the survey site, more often if background noise was loud. If a Willow Flycatcher was detected, the investigator moved approximately 50–80 m beyond the detection before additional playback occurred to avoid double-counting birds.
For each bird encountered, investigators recorded age (adult or juvenile), breeding status (paired, single, undetermined, floater, or transient), and whether the bird was banded. Flycatchers were considered paired if a second flycatcher was present and unchallenged by the territorial male during more than one survey period, if male/female interactions were observed, if an adult flycatcher was observed carrying nesting material or food, if an active flycatcher nest was located, or if adults were observed with or actively feeding fledglings. A flycatcher was considered single or undetermined when behaviors such as spontaneous singing or other territory defense were observed during the non-migrant period (approximately June 15 to July 20; Sogge and others, 2010) but no pair behaviors were confirmed. A flycatcher was considered a floater if observed during the non-migrant period but showed no territorial or breeding behavior. A flycatcher was considered transient if detected only once, or if more than once, detections were less than 2 weeks apart. Transient flycatchers were not identifiable to subspecies, and potential migrants were included in the transient category. Flycatcher locations were mapped using a Trimble Juno SB Global Positioning System (GPS) unit with 1–15 m positioning accuracy (2015–17) or using Collector and Survey123 (2018–19; Environmental Systems Research Institute, 2020) applications on Samsung Galaxy S7 and S8 and LG G5 mobile phones with Android operating systems and built in GPS to determine geographic coordinates (WGS 84).
The upper San Luis Rey River downstream from Lake Henshaw encompassing Cleveland National Forest, Rey River Ranch, and Vista Irrigation District was previously surveyed and monitored in 1999 by B. Kus (Kus and others, 1999) and Varanus Biological Services (2000, 2001). Varanus reported estimated numbers for the portion monitored by B. Kus and noted additional territories. In order to present the most accurate trend analysis, B. Kus numbers were used in the section monitored by B. Kus (a portion of Cleveland National Forest), and Varanus numbers in all other sections (portions of Cleveland National Forest, Rey River Ranch, and Vista Irrigation District). We used the 2016 and 2019 survey results for Cleveland National Forest, Rey River Ranch, and Vista Irrigation District in comparison with historical data. All other historical comparisons were taken from published sources or unpublished data collected by B. Kus.
Survey Results
Population Size and Distribution
Resident flycatchers were detected at 6 of the 33 locations (18 percent) surveyed between 2015 and 2019 (table 1). Most of the resident flycatchers occurred on the San Luis Rey River; resident flycatchers were found on only one other drainage in San Diego County, at San Dieguito River. Based on the initial protocol survey at each location, we detected a minimum of 80 resident flycatchers from 2015 to 2019 (table 1). Of the resident flycatchers, 99 percent (79/80) were found on the San Luis Rey River; most of these were on the upper San Luis Rey River upstream and downstream from Lake Henshaw. Resident flycatchers were documented for the first time at Lake Henshaw, the only new location surveyed that supported flycatchers.
Table 1.
Total number and breeding status of Willow Flycatchers (Empidonax traillii) detected at survey locations across San Diego County, California, 2015–19.[Drainage: AHC; Agua Hedionda Creek; COT, Cottonwood Creek; ESC, Escondido Creek; LP, Los Penasquitos Creek; OT, Otay River; SD, San Dieguito River; SDR, San Diego River; SL, San Luis Rey River; SW, Sweetwater River; TIJ, Tijuana River. Location: 805, Sweetwater 805; AH, Agua Hedionda; BL, Barrett Lake; BO, Bonsall; CC, Couser Canyon; ChC, Chocolate Canyon; CNF, Cleveland National Forest; DOT, Department of Transportation; EA, East; EC, El Capitan; ESC, Escondido Creek; GC, Gregory Canyon; JC, Jamul Creek; LM, Lake Moreno; LP, Los Penasquitos; MSLR, Middle San Luis Rey; MV, Marron Valley; OT, Otay River; PI, Pala Indian Reservation; PG, Pala Gateway; PR, Pankey Ranch; RIN, Rincon; RRR, Rey River Ranch; SA, Santee; SD, San Dieguito; SWA, Sweetwater Authority; SWR, San Diego National Wildlife Refuge; SY, Santa Ysabel; TIJ, Tijuana River; VA, Valley; VID, Vista Irrigation District; VLH, VID Lake Henshaw; WF, West Fork San Luis Rey. Other abbreviations: unk, unknown; juv, juvenile]
Transient flycatchers were observed at 14 of the 33 (42 percent) locations surveyed; 30 transient flycatchers were detected at 10 locations along the San Luis Rey River, and 8 along 4 other drainages/locations (table 1). Most of the transients were detected between May 15 and June 12.
Comparison to Historical Occupancy
Over the course of this study, 11 locations historically occupied by resident flycatchers were resurveyed; only 5 (45 percent) were found to support resident flycatchers: (1) Bonsall, (2) Cleveland National Forest, (3) Rey River Ranch, (4) San Dieguito, and (5) Vista Irrigation District (table 1; fig. 2). No resident flycatchers were found at El Capitan, Couser Canyon, Middle San Luis Rey, Pala, Santa Ysabel, or Sweetwater Authority (table 1). At Bonsall, the number of territories declined from a high of four (2014; B. Kus, U.S. Geological Survey, unpub. data, 2014) to two (table 1). The number of territories at San Dieguito declined from the previous confirmed high of three (1997; Kus and Beck, 1998) to one (table 1). The distribution at San Dieguito had also contracted; in 1997, there were two separate areas along the river with resident flycatchers, but only one was occupied during this study.
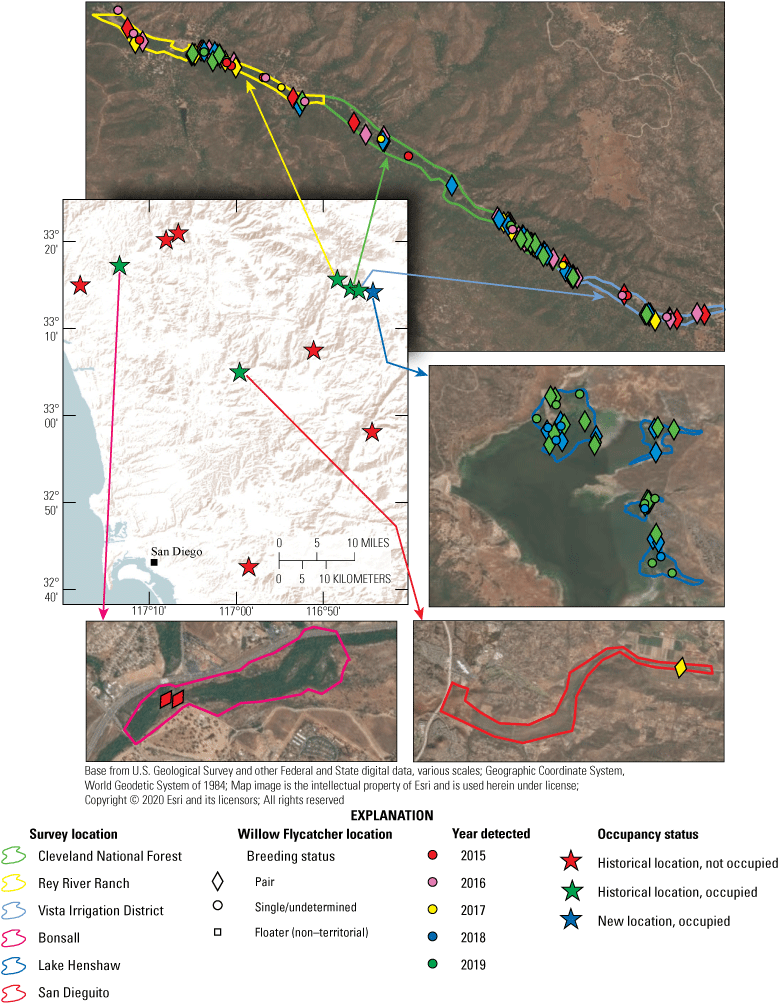
Detections of resident Southwestern Willow Flycatchers and the status of historically occupied survey locations, San Diego County, California, 2015–19. [Stars represent historical locations with current occupancy status (green=occupied, red=not occupied), and new survey locations that were occupied (blue). The colored arrows leading from the overview map to individual-colored polygons of the same color represent survey locations enlarged to show detections of flycatchers by year as indicated by the color of the symbols (red, pink, yellow, blue, and green) and breeding status by the shape of the symbols (diamond, circle, square)]
The remaining three historically occupied locations that were resurveyed were (1) Cleveland National Forest, (2) Rey River Ranch, and (3) Vista Irrigation District. These areas were previously surveyed for Willow Flycatchers in 1999 (table 2; Kus and others, 1999; Varanus Biological Services, 2000, 2001). Overall, the number of territories on the upper San Luis Rey River in the historically occupied area declined 71 percent between 1999 and 2019; the population dropped by 42 percent between 1999 and 2016, and by 50 percent during the 3 years after that. From 2016 to 2019, the largest declines in the number of territories occurred at Vista Irrigation District between 2016 (8 territories detected) and 2017 (3 territories detected), at Rey River Ranch between 2017 (9 territories) and 2018 (5 territories), and at Cleveland National Forest between 2018 (10 territories) and 2019 (6 territories).
Table 2.
Number and distribution of Southwestern Willow Flycatcher territories in the upper San Luis Rey River historical survey area, by location and year: 1999, 2016, and 2019.[Number in parentheses represents the proportion of total flycatcher territories in that location. Location: RRR, Rey River Ranch; CNF, Cleveland National Forest; VID, Vista Irrigation District. Other abbreviations: No., number; −, minus; +, plus]
The distribution of flycatcher territories at the upper San Luis Rey River in 2016 changed relative to the distribution in 1999 (table 2); the proportion of all territories that were at the Cleveland National Forest and Rey River Ranch decreased to 36 percent each, whereas the proportion at Vista Irrigation District increased to 29 percent, creating a more equal distribution of territories across the historically occupied area. By 2019, the distribution changed relative to 2016, with most of the territories spread equally between Cleveland National Forest and Rey River Ranch (43 percent each), while the proportion of territories at Vista Irrigation District declined to 14 percent.
Banded Birds and Dispersal Observations
We encountered 15 previously banded birds at 4 locations while performing surveys across San Diego County from 2015 to 2019. Of the 15 birds, 3 were known birds that had been previously observed at Bonsall in 2014 (1 male, 1 female; B. Kus, U.S. Geological Survey, unpub. data, 2014) and Cleveland National Forest in 2010 (1 male; B. Kus, U.S. Geological Survey, unpub. data, 2010). Two of the birds were females originally banded as nestlings at MCBCP and were observed for the first time as breeding adults; one female was last seen in 2013 (B. Kus, U.S. Geological Survey, unpub. data, 2013) and dispersed a distance of 55 kilometers (km) to breed at Cleveland National Forest (2015), while the second was last seen in 2010 (B. Kus, U.S. Geological Survey, unpub. data, 2010) and dispersed 41 km to San Dieguito (2017). We also documented an adult male who was originally observed at the beginning of the 2017 breeding season at Bonsall before moving within the same season to breed at San Dieguito (dispersal distance, 31 km; B. Kus, U.S. Geological Survey, unpub. data, 2017). At Lake Henshaw, we encountered nine banded birds including seven birds banded as nestlings and two adults; these birds are discussed further in chapter B.
Chapter B—Demographic Study
Methods
Overview of Nest Monitoring Area
Based on the results of positive surveys in 2015 (detailed in chapter A), we designated a reach of the upper San Luis Rey River encompassing three locations (fig. 2; Cleveland National Forest, Rey River Ranch, and Vista Irrigation District) as a nest monitoring study area (hereafter, “monitoring area”). The monitoring area consisted of an approximately 6.0-km (3.7-mile [mi]) reach of the San Luis Rey River, including Vista Irrigation District property downstream from Lake Henshaw, Cleveland National Forest land downstream from the Vista Irrigation District property, and private property downstream from the Forest Service property. The entire length of the monitoring area was previously monitored for Southwestern Willow Flycatchers in 1999 (Kus and others, 1999; Varanus Biological Services, 2000, 2001).
The upper San Luis Rey River monitoring area was monitored annually from 2016 to 2019. Standardized territory names and boundaries were created by plotting all GPS points collected for resident flycatchers (including all nest locations within an individual year) and outlining the maximum extent of each concentration of points.
Breeding Productivity—Data Collection
All resident flycatchers detected within the monitoring area were visited at least weekly from mid-May until mid- to late August to determine their breeding status (paired or unpaired) and if paired, to determine pairing type (monogamous or polygynous). Monogamous pairings consisted of one male paired with one female, while polygynous pairings consisted of one male paired with more than one female. Behaviors used to establish polygyny included males interacting with and attending nests of more than one female simultaneously or sequentially. Pairs were visited weekly from their date of detection until the completion of their final nesting attempt to obtain a complete record of breeding activity within the territory. Pairs were observed for evidence of nesting, and their nests were located and monitored following standard protocol (Rourke and others, 1999). To minimize the chances of leading predators or Brown-headed Cowbirds to nest sites, nests were visited only as frequently as needed to collect sufficient data, targeting transition dates (for example, hatch date). Typically, there were three to four visits to a nest, corresponding to approximately one visit per week. The first visits were timed to determine the number of eggs laid and to remove cowbird eggs from parasitized nests; subsequent visits were to determine whether eggs had hatched and age of young, and the last to band the nestlings.
Nests were assigned six possible fates based on the following parameters. Nests that fledged at least one young were considered successful (SUC). Fledging was confirmed by audial or visual detection of young outside the nest, or on rare occasions, by the observation of an empty nest on or after the estimated fledge date in combination with parents carrying food within the territory. Unsuccessful nests were placed into one of four nest fate categories. Nests found empty or destroyed before the estimated fledge date and where the adult flycatchers were not found tending fledgling(s) were considered depredated (PRE). Previously active nests that were subsequently abandoned by adult flycatchers after one or more Brown-headed Cowbird eggs were laid in the nest were considered to have failed because of nest parasitism (PAR). Any nests that fledged cowbird young without fledging flycatcher young also were considered to have failed because of nest parasitism (PAR). Nests failing for reasons such as poor nest construction or the collapse of a host plant that caused the nest contents to be dumped onto the ground, or the presence of a clutch of infertile eggs (eggs that were dark with a visible air pocket, or that did not hatch after 20 days of incubation), were classified as failing because of other causes that were known (OTH). Nests that appeared intact and undisturbed but were abandoned with flycatcher eggs before the earliest hatch date, or nests that were completed but failed before flycatcher eggs could be confirmed, were classified as having failed because of unknown causes (UNK). Finally, nests that were seen during the construction phase but never completed or showed evidence of being dismantled were classified as incomplete (INC).
Whenever possible, we followed our standard protocol for manipulating nest contents when cowbird eggs or nestlings were detected in flycatcher nests. For nests with two or more flycatcher eggs, cowbird eggs were removed from nests as they were found. For nests with fewer than two flycatcher eggs, we waited until the next visit to remove the cowbird egg to minimize the possibility of nest abandonment in response to the removal. Cowbird nestlings were removed immediately from nests. Performed in this way, nest manipulation allows many parasitized nests to remain active and potentially fledge young where they would otherwise fail to fledge flycatcher young.
Breeding Productivity—Data Analysis
We used information collected during territory and nest visits to determine the number of nesting attempts per pair, nest initiation dates (date first egg laid), egg clutch size, hatching success for both eggs (percent of eggs that hatched) and nests (percent of nests with eggs in which at least one hatched), fledging success for both hatchlings (percent of hatchlings that fledged) and nests (percent of nests with hatchlings from which at least one fledged), apparent nest success (the proportion of completed nests that fledged young), productivity (the number of young fledged per pair), and fledge dates (the date on which at least one fledgling was detected outside the nest). We used the presence of cowbird eggs in flycatcher nests that contained at least one flycatcher egg to calculate parasitism rate (percent of nests parasitized), based on nests in which the contents were observed.
We used Pearson’s chi-square analysis and Fisher’s Exact tests to determine if there were differences across years in the proportion of pairs re-nesting after failed first nests, egg hatch rate, hatchling fledge rate, parasitism rate, apparent nest success, and productivity. Chi-square tests were used when sample sizes were sufficient; Fisher’s Exact tests were used when one or more categories contained fewer than five samples. We used Analysis of Variance (ANOVA) and Tukey’s post-hoc pair-wise comparisons to determine if there were between-year differences in the number of completed nests per pair, average clutch size, and average number of young fledged per pair. Results were considered significant if P≤0.10.
We modeled daily survival rate (DSR) of flycatcher nests, or the probability that a nest would survive from one day to the next (Dinsmore and others, 2002) in Program MARK (White and Burnham, 1999) using the ‘RMark’ package (Laake, 2013) in R (R Core Team, 2020). Nest survival was calculated across a 35-day cycle length beginning with nest completion and encompassing egg-laying, incubation, and nestling periods. Age of nests at the time they were discovered was calculated by forward- or backward-dating of nests in relation to known dates of nest-building, egg-laying, or hatching. We used an information-theoretic approach (Akaike’s Information Criterion for small sample size, or AICc; Burnham and Anderson, 2002) to evaluate support for nest survival models reflecting a priori hypotheses regarding the effects of year and precipitation on survival. Monthly precipitation data were gathered from the Vista Irrigation District Lake Henshaw Dam station (R. Larsen, Vista Irrigation District, written commun., 2020). Because most of the precipitation in our study area accumulates during the fall and winter before the breeding season, we focused our analyses on ‘bio-year’ precipitation, which we defined as starting on October 1 of the calendar year before breeding and ending on March 31 of the breeding season year. Although this definition of bio-year begins before the flycatcher breeding season, fluctuations in food resources that may affect productivity and survival are thought to be driven by precipitation, and therefore, the defined bio-year is biologically relevant to the period when flycatchers are present. We further sub-grouped bio-year precipitation into two periods (fig. 3): October to December (early winter), and January to March (late winter), to examine whether timing of rainfall, in addition to amount of rainfall, influenced DSR. We created a set of three separate models using bio-year precipitation (hereafter, “precipitation”; PrecipBY), early winter precipitation (PrecipEW), and late winter precipitation (PrecipLW), as well as an additive model with early and late winter precipitation together to estimate coefficients for one variable while controlling for the other. We used logistic regression with a logit link to build models. First, we generated a constant survival model to serve as a reference for the effects of year and precipitation on DSR. We then modeled the covariates and evaluated support for the models in relation to the constant survival model. Criteria for well-supported models included: ∆AICc less than 2, and AICc weight greater than 0.05. We evaluated the significance of covariates within our top models by examining whether the 95-percent confidence intervals of the beta estimates included zero; we proceeded with inference when the 95-percent confidence interval of an estimate did not cross zero. If more than one model in the model set had ΔAICc value less than 2, we averaged the parameters in the model set using the ‘RMark’ package (Laake, 2013) in R (R Core Team, 2020).
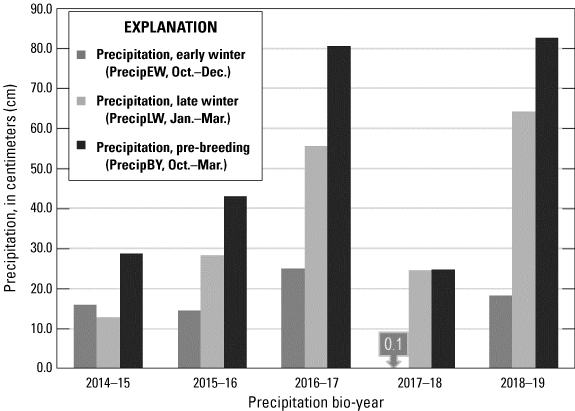
Pre-breeding season precipitation totals from the Vista Irrigation District Lake Henshaw Dam weather station, San Diego County, California, 2015–19. [PrecipBY, pre-breeding season precipitation from October 1 of the calendar year before the breeding season and ending on March 31 of the breeding season year; PrecipEW, early winter precipitation from October 1 to December 31 of the calendar year before the breeding season; PrecipLW, late winter precipitation from January 1 to March 31 of the breeding season year]
Survivorship, Fidelity, and Movement
To facilitate analyses of survival and dispersal, we attempted to capture and color band any unbanded adult flycatchers in our monitoring area. We used mist nets and song playback to capture adults. When captured, birds were banded with colored leg bands to create a unique color-band combination so that individuals could be identified in the future without recapture. Flycatcher nestlings from accessible nests were banded at 7–9 days of age with a single blue anodized federal numbered band on the left or right leg alternating by year (that is, 2016 and 2018 nestlings were banded on the left leg and 2017 nestlings were banded on the right leg). Birds banded as nestlings that returned as adults (“natals”) were captured and given a unique combination of color bands to supplement their single federal band. Adult flycatchers were sexed based on breeding characteristics observed during the banding process (the presence of a brood patch for females or a cloacal protuberance for males) or by behavioral characteristics observed during subsequent encounters (that is, only females incubate nests; males broadcasting song or other territory defense behaviors). During surveys and nest monitoring activities, we attempted to resight all flycatchers to determine whether they were banded, and if so, to confirm their identity by reading their unique color band combination.
Annual Survivorship—Analysis
We modeled detection probabilities and annual survivorship of adult and first-year flycatchers in Program MARK (White and Burnham, 1999) using the ‘RMark’ package (Laake, 2013) in R (R Core Team, 2020). For MARK analyses, we created encounter histories for each flycatcher, based on whether or not an individual was detected in the monitoring area (or Lake Henshaw) within a particular year. Multiple detections of individuals within a year were treated as a single encounter. We analyzed color-banded flycatchers with confirmed identities, as well as five natals banded in 2016 and 2017 and detected in 2017 (one) and 2018 (four) that we were unable to capture and confirm identity. We were confident that these five birds were not detected or captured in subsequent years, so to maximize use of our data, we randomly selected five birds from corresponding cohorts that were never detected after banding and used them as “surrogates,” creating encounter histories for each that matched those of the five natals.
We used logistic regression to build models and an information-theoretic approach (Akaike’s Information Criterion for small sample size, or AICc; Burnham and Anderson, 2002) to evaluate support for the models, as described above. We created two sets of models: (1) a set including only adults (birds banded as adults or natals that returned to breed), and thus of known sex (“Adults Only”), and (2) a set including adults and nestlings (“Adults and First-year Birds”). We used the “Adults Only” models to test the effects of sex on adult survival and used the “Adults and First-year Birds” models to evaluate the effects of age, year, and previous year precipitation on flycatcher survival. We define previous year precipitation (Previous PrecipBY) as precipitation in the bio-year ending in the previous breeding season year (for example, survival from 2016 to 2017 was analyzed as a function of the precipitation in the bio-year October 2015 to March 2016). We avoided including first-year birds in tests of sex effects because nestlings cannot be sexed at the time of banding, and the sex composition of surviving first-year birds may be biased relative to the sex composition of banded nestling cohorts.
We evaluated the influence of age, sex, year, and precipitation on detection probability by comparing models including these variables to a model with constant detection, holding survivorship constant. For the “Adults Only” models we found no influence of sex on detection probability, so constant detection probability was included in all models of adult flycatcher survivorship. For the “Adults and First-year Birds” models, we found that detection probability was influenced by age, so it was included in all models in this set.
Fidelity and Movement—Data Collection and Analysis
Territory fidelity and between-year movements of flycatchers were categorized based on how far a returning adult or dispersing natal moved from the previous year’s location. Returning adult flycatchers showed either territory fidelity, or between-year movement. Adult flycatchers showed territory fidelity if they returned to within 100 m of the previous year’s territory.
We used the point distance tool in ArcMap 10.1 (Environmental Systems Research Institute, 2021) to calculate the straight-line distance between two-point locations. For banded adult flycatchers, we evaluated the distance between locations the initial year the bird was detected and the next year in which the bird was observed. If an adult was not observed in an intervening year between two detections, distance was calculated from the last location at which it was observed to the current location. For banded natal flycatchers, we evaluated the distance between their natal location (the nest from which they fledged) and the bird’s first location detected as an adult. Natal dispersal distance was only calculated for the initial year the bird was detected as an adult; all subsequent movements were included in adult movement calculations. When we were unable to capture natal birds to determine their actual natal location, we calculated the minimum and maximum possible dispersal distances based on the closest and furthest successful nests, respectively, from the year of natal origin (determined by which leg was banded) and reported the midpoint of these as an estimated natal dispersal distance. Estimated natal dispersal distances were not used in analyses.
We used Fisher’s Exact tests to determine if there were differences in territory fidelity by sex and year for adults. We used Kruskal-Wallis tests to determine if there were statistical differences in distance moved as a function of age (adult or first-year), sex (female or male), or year. We used logistic regression to determine whether territory fidelity differed by nest success in the previous year. Results were considered significant if P≤0.10.
Habitat and Nest Site Characteristics—Data Collection and Analysis
Dominant native and exotic plants were recorded at each monitored flycatcher territory, and percent cover of native vegetation was estimated using cover categories of less than 5 percent, 5–50 percent, 51–95 percent, and greater than 95 percent. Overall habitat type was specified according to the following categories:
-
Mixed willow riparian: Habitat dominated by one or more willow species, including Goodding’s black willow (Salix gooddingii), arroyo willow (Salix lasiolepis), and red willow (Salix laevigata), with mule fat (Baccharis salicifolia) as a frequent co-dominant.
-
Oak-sycamore: Woodlands in which coast live oak (Quercus agrifolia) and California sycamore (Platanus racemosa) exist as co-dominants.
-
Willow-ash: Willow riparian habitat in which velvet ash (Fraxinus velutina) is a co-dominant.
-
Willow-oak: Willow riparian habitat in which coast live oak is a co-dominant.
-
Willow-sycamore: Willow riparian habitat in which California sycamore is a co-dominant.
In 2018, we began noticing dead and dying oaks in the monitoring area. To aid in evaluating habitat changes in flycatcher territories related to dead and dying oaks, we examined visible/near infrared aerial imagery from the National Agricultural Inventory Program (NAIP; U.S. Geological Survey, 2021). The NAIP image sets were captured between April 23, 2016, and April 24, 2016, and between April 15, 2020, and May 25, 2020, and consisted of 1-m ground sample distance resolution, and four-band visible and near-infrared georeferenced orthoimages. A normalized difference vegetation index (NDVI) was computed from the NAIP image using Image Analysis in ArcMAP 10.4.1 (Environmental Systems Research Institute, 2021). Zonal statistics were calculated from the NDVI values for each buffered territory boundary. Percent change in mean NDVI from 2016 to 2020 was calculated for each territory in the study (((mean NDVI 2020-mean NDVI 2016)/mean NDVI 2016)*100).
We examined the vegetation characteristics of flycatcher nest locations. Following the abandonment or fledging of flycatcher nests, we recorded nest height, host plant species, host height, distance to edge of host plant, and distance to edge of host clump. Clump boundaries were defined where leaves or branches of neighboring plants no longer overlapped. We tested for differences in flycatcher nest site characteristics across years and between successful and unsuccessful nests within years using Mann-Whitney U-tests (two groups), and Kruskal-Wallis tests (three or more groups) because the data violated the normality assumptions of t-tests and ANOVA tests. Mann-Whitney U-tests and Kruskal-Wallis tests were performed using base tools in R (R Core Team, 2020).
Results
Composition of Monitored Population
From 2016 to 2019, we monitored 82 territories (14–27 per year; table 3; appendix 1, figs. 1.1–1.4) at the upper San Luis Rey River monitoring area. Most of the territories supported pairs, although single or undetermined breeding status birds were present every year (six in 2016, three in 2017, one in 2018, and three in 2019). Additionally, in 2018 we detected a non-territorial floater that was present late in the breeding season (table 1; appendix 1, fig. 1.4, V10). Among the paired birds, we observed polygynous pairings in all years, with the lowest rate of polygyny (number of polygynous pairs/total number of pairs) observed in 2016 (10 percent) and the highest in 2017 (70 percent; table 4). The proportion of paired males that were polygynous ranged from 5 to 54 percent between 2016 and 2019 and varied with the ratio of females to males in the adult population. The total number of males in the monitoring area declined 41 percent from 2016 to 2017, which increased the sex ratio of females to males and encouraged polygynous pairings (table 4).
Table 3.
Number of Southwestern Willow Flycatcher territories and nests monitored at the upper San Luis Rey River monitoring area, San Diego County, California, 2016–19.[Incomplete nests were partially built but not completed. Abbreviation: ±, plus or minus]
Table 4.
Prevalence of polygyny in paired Southwestern Willow Flycatchers by year and sex at the upper San Luis Rey River monitoring area, San Diego County, California, 2016–19.[Polygynous, breeding style in which one male pairs with multiple females. Numbers in parentheses are the proportion of pairs, males, and females that were polygynous]
Breeding Productivity
We monitored the nesting activity of 11–21 pairs annually, all of which were fully monitored, meaning that the territory was visited at least weekly and all nests within the territory were found and documented during the breeding season (table 3). A total of 126 nests were monitored between 2016 and 2019 (18–41 nests per year; table 3). Eight of these nests were not completed and were subsequently excluded from calculations of nest success, productivity, and daily nest survival.
Nest Initiation
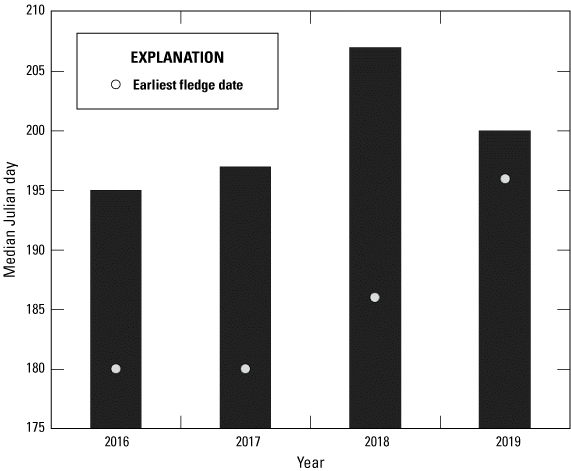
The Southwestern Willow Flycatcher breeding season began in May or June and ended in July or August. Most of the first nesting attempts were initiated during late May and early June (fig. 4). Nest initiation (date first egg laid) occurred earlier in 2016 and 2017 (median Julian day 157; June 5 and June 6) than in 2018 (median Julian day 159; June 8) and 2019 (median Julian day 160; June 9; fig. 5). The earliest confirmed nest initiation (first egg of the season) was May 24 (Julian day 144; 2017) and the latest initiation was July 11 (Julian day 192; 2017).

Number of first nests initiated (date first egg laid) by week at the upper San Luis Rey River monitoring area, San Diego County, California, 2016–19.
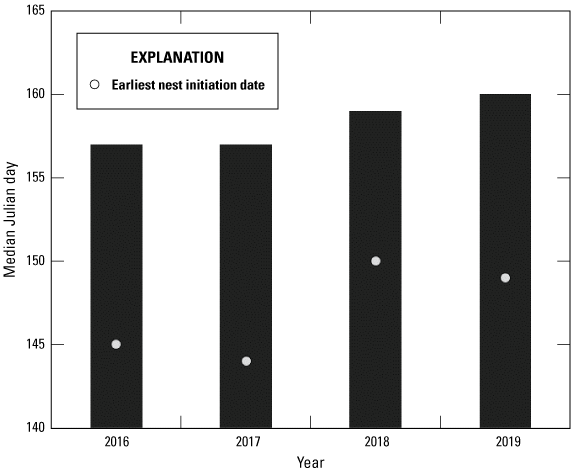
Median and earliest initiation dates of first nests by Southwestern Willow Flycatchers at the upper San Luis Rey River monitoring area, San Diego County, California, 2016–19.
The earliest and latest fledge dates occurred in 2016 (June 28; Julian day 180 and August 18; Julian day 231, respectively; fig. 6). The median fledge date occurred earlier in 2016 (July 13; Julian day 195) and 2017 (July 16; Julian day 197) than in 2018 (median Julian day 207; July 26) and 2019 (July 19; Julian day 200).
Median and earliest fledge dates of Southwestern Willow Flycatchers at the upper San Luis Rey River monitoring area, San Diego County, California, 2016–19.
Nesting Attempts
Monitored flycatcher pairs completed between zero and four nests per year; one pair in 2017 did not nest. The average number of completed nests per pair ranged from 1.5±0.9 to 2.1±0.8 across years (table 4), but did not differ significantly by year (F3,65=1.53, P=0.22).
In most years, most of the flycatcher pairs (47–76 percent) attempted more than one nest, all following an unsuccessful first attempt (fig. 7). A few pairs attempted third and fourth nests after failures. Significantly more flycatcher pairs were successful on their first nest attempt in 2017 (37 percent; 7/19; Fisher’s Exact test, P=0.09), compared to 2016 (29 percent; 6/21), 2018 (6 percent; 1/17), and 2019 (9 percent; 1/11). None of the successful pairs in any year re-nested after a successful nest.
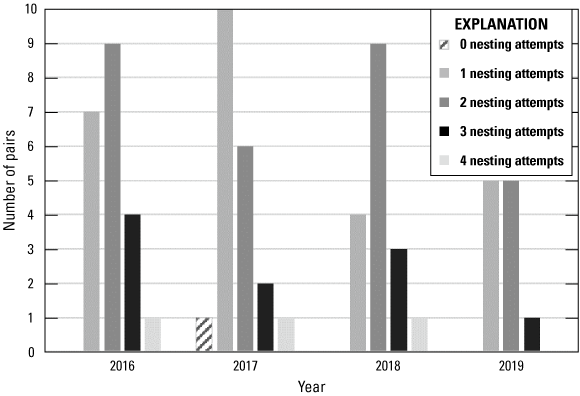
Number of Southwestern Willow Flycatcher nesting attempts by pair in the upper San Luis Rey River monitoring area, San Diego County, California, 2016–19.
Apparent Nest Success
Of the 118 flycatcher nests monitored from 2016 to 2019, annual apparent nest success ranged from 37 percent (2016, 2017) to 11 percent (2019) and differed significantly by year (Fisher’s Exact test, P=0.04; table 5). Nest success declined over the course of the study and was higher in 2016 and 2017 than in 2018 and 2019. Significant differences were observed when comparing 2016 or 2017 to 2018 and 2019 (Fisher’s Exact test: 2016 versus 2017, P=1.00; 2016 versus 2018, P=0.05; 2016 versus 2019, P=0.06; 2017 versus 2018, P=0.05; 2017 versus 2019, P=0.09; 2018 versus 2019, P=1.00).
Table 5.
Fate of Southwestern Willow Flycatcher nests by year at the upper San Luis Rey River monitoring area, San Diego County, California, 2016–19.[Numbers in parentheses adjacent to successful and failed nest fates are the proportions of total annual nests. Numbers in parentheses adjacent to failed nest cause (predation, other/unknown) are the proportions of total failed nests]
Predation was presumed to be the primary source of nest failure across all years, with 63 to 84 percent of nest failures each year attributed to predation (table 5). The proportion of unsuccessful nests that failed as a result of predation versus other causes of nest failure did not vary significantly by year (Fisher’s Exact test, P=0.53). Additionally, the proportion of all nests that were depredated did not vary significantly by year (Fisher’s Exact test, P=0.54), although 66 percent (23/35) of all nests in 2018 were depredated, compared to 49 percent (17/35) in 2016. Other or unknown causes of failure included 2 nests that failed with infertile eggs, 16 nests that failed before eggs could be documented, 2 nests abandoned with eggs, and 1 nest in which a single nestling developed slowly and eventually died. At least eight of the nests that failed for unknown reasons likely failed as a result of predation, as they were either found incubating but too high to observe contents and were inactive by the next visit, or they were complete with no eggs, and disheveled or being dismantled by the next visit.
Cowbird Parasitism
From 4 to 27 percent of flycatcher nests, each year, were parasitized by cowbirds from 2016 to 2019 (table 6). Parasitism rates appeared lower in 2016 and 2017, compared to 2018 and 2019, although the difference was marginally outside our threshold for statistical significance (table 6; Fisher’s Exact test, P=0.13).
Table 6.
Number and fate of Southwestern Willow Flycatcher nests parasitized by Brown-headed Cowbirds at the upper San Luis Rey River monitoring area, California, 2016–19.[Numbers in parentheses adjacent to nests parasitized are the proportions of annual completed nests in which we were able to observe the contents to determine parasitism status. Numbers in parentheses adjacent to fate of parasitized nest categories (failed before manipulation, manipulated nests) are the proportions of annual nests parasitized. Numbers in parentheses adjacent to manipulation outcomes (successful, unsuccessful) are the proportions of annual manipulated nests. Numbers in parentheses adjacent to successful nests if parasitized allowed to fail are the proportions of annual completed nests]
We “rescued” most (57–100 percent) of the parasitized nests each year by removing the cowbird eggs (table 6). While some of these nests failed later, 0 to 100 percent of rescued flycatcher nests each year were ultimately successful. If we had allowed parasitized nests to fail (by not removing cowbird eggs or nestlings from nests), nest success in 2016 would have been 16 percent lower (from 37 percent [table 5] to 31 percent), in 2017, 11 percent lower, unchanged in 2018, and 45 percent lower in 2019.
Productivity
We documented 262 Southwestern Willow Flycatcher eggs in 96 monitored nests from 2016 to 2019 (table 7). Clutch size estimated from full clutches in non-parasitized nests ranged from two to four and averaged 2.8±0.8 to 3.1±0.8 annually (fig. 8). Clutch size did not vary significantly between years (F3,55=0.22, P=0.88).
Table 7.
Reproductive success and productivity of nesting Southwestern Willow Flycatchers at the upper San Luis Rey River monitoring area, San Diego County, California, 2016–19.[Calculations of average clutch size include only non-parasitized nests that had a known full clutch. Abbreviation: ±, plus or minus]

Southwestern Willow Flycatcher egg clutch size by year at the upper San Luis Rey River monitoring area, San Diego County, California, 2016–19. Error bars represent one standard deviation.
Hatching success of eggs differed significantly between years (P<0.001, Fisher’s Exact test; table 7) and was higher in 2017 (65 percent) than in 2016 (54 percent), 2018 (38 percent), and 2019 (19 percent). Significant differences occurred in all paired year comparisons except 2016 and 2017 (2016 versus 2017: χ2=1.39, P=0.24, df=1; 2016 versus 2018: χ2=4.23, P=0.04, df=1; 2016 versus 2019: P<0.001, Fisher’s Exact test; 2017 versus 2018: χ2=9.98, P<0.001, df=1; 2017 versus 2019: P<0.001, Fisher’s Exact test; 2018 versus 2019: P=0.10, Fisher’s Exact test).
Similarities within years between the percent of eggs that hatched and the percent of nests with eggs that hatched indicate that the factors affecting hatch rate were operating at the nest level, instead of the egg level (for example, infertile eggs, partial predation, and so forth).
Fledging success differed significantly between years (P=0.02, Fisher’s Exact test; table 7) and was significantly lower in 2018 than in 2016 (χ2=5.46, P=0.02, df=1) and 2019 (P=0.02, Fisher’s Exact test). As with hatching success, factors influencing fledging success appeared to be operating at the nest level.
The number of fledglings per pair ranged from zero to four and averaged 0.5±1.0 to 1.6±1.5 annually (table 7). There was a significant difference in the number of young fledged per pair between years, with pairs in 2016 producing more than three times the number of fledglings as in 2019 (F3,65=2.76, P=0.05; table 7; fig. 9). The percent of pairs fledging at least one young appeared to decline over time but did not differ significantly by year (P=0.37, Fisher’s Exact test; table 7).
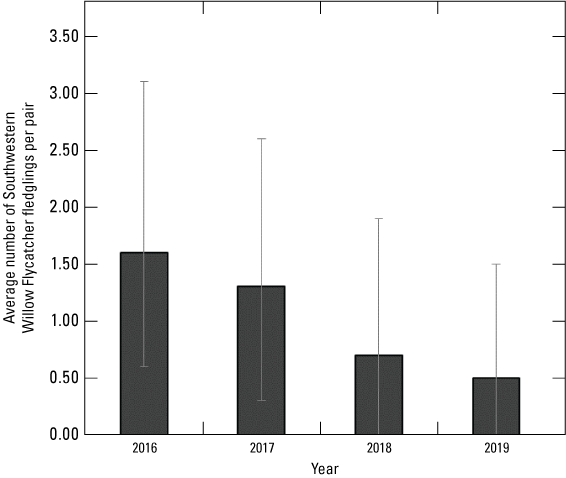
Southwestern Willow Flycatcher fledglings per pair by year at the upper San Luis Rey River monitoring area, San Diego County, California, 2016–19. Error bars represent one standard deviation.
Several of the nests that successfully fledged young had been parasitized by cowbirds (2 nests in 2016, 1 nest in 2017, and 1 nest in 2019 [table 6]) and were subsequently “rescued” by removing the cowbird eggs. These rescued nests were responsible for the production of 2–3 additional young fledged per year, increasing annual productivity in 2016 by 7 percent (from 1.5±1.5 to 1.6±1.5 [table 7] young fledged per pair), in 2017 by 8 percent (from 1.2±1.3 to 1.3±1.3 [table 7]), in 2018 by 0 percent, and in 2019 by 150 percent (from 0.2±0.6 to 0.5±1.0 [table 7]) over what would be expected had all parasitized nests been allowed to fail.
Daily Nest Survival
Analysis of DSR showed that from 2016 to 2019, the best supported model for predicting flycatcher nest survival was the model that included both early winter precipitation and late winter precipitation (table 8). The year model was also within two AICc units of the top model and carried an AICc weight of 0.24. Early winter precipitation and late winter precipitation acted in opposition to one another, with increases in early winter precipitation promoting DSR while increases in late winter precipitation reduced it (table 9). This pattern was largely driven by changes in DSR in 2018 and 2019, which were the only years considered significant predictors to the year model (table 9). The DSR declined between 2017 and 2018 coinciding with a steep decline in early winter precipitation (99 percent) and a lesser decline in late winter precipitation (56 percent; fig. 10). The DSR failed to increase between 2018 and 2019 when early winter precipitation increased a bit but late winter precipitation more than doubled (fig. 10), which was probably the source of the negative relationship between late winter precipitation and DSR. Overall, DSR varied little across years (table 10).
Table 8.
Logistic regression models for the effects of precipitation and year on daily nest survival (S) of Southwestern Willow Flycatchers at the upper San Luis Rey River monitoring area, San Diego County, California, 2016–19.[Models are ranked from best to worst based on Akaike’s Information Criterion for small samples (AICc), ΔAICc, and Akaike weights (w). AICc is based on −2 x loge likelihood and the number of parameters (K) in the model. Abbreviations: +, plus; PrecipBY, pre-breeding season precipitation from October of the prior calendar year to March of the breeding year; PrecipEW, early winter precipitation from October to December of the calendar year prior to the breeding season; PrecipLW, late winter precipitation from January to March of the breeding year]
Table 9.
Parameter estimate (β), standard error (SE), and 95-percent confidence intervals (95% CI) for models with ΔAIC<2 explaining daily nest survival of Southwestern Willow Flycatchers at the upper San Luis Rey River monitoring area, San Diego County, California, 2016–19.[+, plus; PrecipEW, early winter precipitation from October to December of the calendar year prior to the breeding season; PrecipLW, late winter precipitation from January to March of the breeding year]
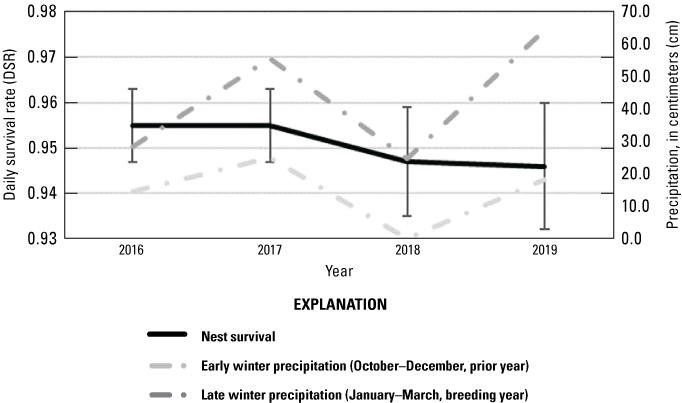
Daily survival rate of Southwestern Willow Flycatcher nests by year, early winter, and late winter precipitation at the upper San Luis Rey River monitoring area, San Diego County, California, 2016–19. [Error bars represent one standard error of daily nest survival rate. Early winter precipitation from October to December of the calendar year before the breeding season; Late winter precipitation from January to March of the breeding year.]
Survivorship, Fidelity, and Movement
Overview of Banded Population
We banded a total of 119 flycatchers between 2015 and 2018 (table 11). A total of 36 adults were banded with unique color-combinations. Between 2016 and 2018, 83 nestlings were banded with a single federal band; 57 were believed to have fledged. In addition to newly banded birds, two adults that were banded before 2015 were observed in the monitoring area. After the initial year of banding (2015), on average, 62 percent of the adult population (55–66 percent; table 9) in the monitoring area was banded each year. More males than females were banded; 82 percent of males (70–100 percent) were banded from 2016 to 2019 compared to 44 percent of females (27–57 percent; table 12).
Table 11.
Number of Southwestern Willow Flycatchers captured and newly banded by year and age at the upper San Luis Rey monitoring area, San Diego County, California, 2015–18.Table 12.
Southwestern Willow Flycatcher banded adults and proportion of all adults that were banded by year and sex at the upper San Luis Rey monitoring area, San Diego County, California, 2015–19.[Number of banded adults: Numbers in parentheses are the number of birds banded in a previous year. Abbreviation: Unk., unknown]
During surveys and monitoring, we accumulated 94 detections of banded adults in the monitoring area, some of which were resighted in multiple years (tables 12, 13). In total, 49 individual flycatchers (30 males, 19 females) made up the banded adult population in the monitoring area from 2015 to 2019, including 38 adults and 11 first-year flycatchers that returned to the monitoring area to breed. Most of the adult birds over the course of the study ranged in age from 1 to 4 years old (table 13), with the exception of one male that was banded before this study in 2010 and was at least 8 years old the last year he was detected.
Table 13.
Number of banded adult Southwestern Willow Flycatchers at the upper San Luis Rey monitoring area by age and sex, San Diego County, California, 2015–19.[Age (years): Exact ages (1 and 2) determined from single numbered metal federal band confirmed during recapture or if not recaptured, by which leg was banded (right or left leg, indicating origin year); minimum age (≥1, ≥2, ≥3, ≥4, ≥6, ≥7, or ≥8) applies to a bird captured as an unbanded adult, or an uncaptured natal bird whose origin year could not be determined. Abbreviations: ≥, greater than or equal to; —, not applicable]
Annual Survivorship
Survivorship Models—Adults Only
There were 52 adults included in the “Adults Only” survivorship pool; 38 banded as adults and 14 first-year birds that returned to the study area. We were able to determine the sex of all banded adults. Of the 52, 32 were male (7 originally banded as nestlings) and 20 were female (7 originally banded as nestlings).
The top model explaining adult annual survival included an effect of sex, although the constant survival model also received strong support (ΔAICc less than 2; table 14). Male annual survival was estimated at 69±7 percent, higher than the estimate of 45±10 percent for females (table 15), although only the male estimate significantly contributed to the model (table 16).
Table 14.
Survivorship models for the effect of sex on adult survival for Southwestern Willow Flycatchers at the upper San Luis Rey River monitoring area, San Diego County, California, 2015–19.[Detection probability was held constant in all models. Models are ranked from best to worst based on Akaike’s Information Criterion for small samples (AICc), ΔAICc, and Akaike weights (w). AICc is based on −2 x loge likelihood and the number of parameters (K) in the model]
Table 15.
Real parameter estimate, standard error (SE), and 95-percent confidence intervals (95% CI) for annual survivorship of adult female and adult male Southwestern Willow Flycatchers at the upper San Luis Rey River monitoring area, San Diego County, California, 2015–19.[Parameter estimates based on the top model]
Table 16.
Parameter estimate (β), standard error (SE), and 95-percent confidence intervals (95% CI) for the top models (ΔAICc<2) explaining annual survivorship of adult Southwestern Willow Flycatchers at the upper San Luis Rey River monitoring area, San Diego County, California, 2015–19.[Intercept represents adult females in the sex model and adults in the constant model. All other effects values are the difference between that parameter and the intercept]
Survivorship Models—Adults and First-Year Birds
A total of 95 individual flycatchers were included in the “Adults and First-Year Birds” survivorship analyses (57 banded as nestlings and 38 banded as adults).
The two best-supported models for flycatcher survival included an effect of age on survival (table 17). Although the top model also included an effect of year, year was not a significant contributor to the model (95-percent confidence interval of β includes zero; table 18). There was no evidence that previous year precipitation influenced survivorship of either age class. We averaged over all eight models in the model-set to estimate adult and first-year survival (table 19). Survival of adult flycatchers was significantly higher than that of first-year flycatchers; annual survival of adults ranged from 52 to 75 percent, and from 24 to 41 percent for first-year birds (table 19). Detection probability was high for both adults (0.80) and first-year birds (0.72).
Table 17.
Survivorship models for the effects of age, year, and previous year precipitation on survival of Southwestern Willow Flycatchers at the upper San Luis Rey River monitoring area, San Diego County, California, 2015–19.[Detection probability (Age) was included in all models. Models are ranked from best to worst based on Akaike’s Information Criterion for small samples (AICc), ΔAICc, and Akaike weights (w). AICc is based on −2 x loge likelihood and the number of parameters (K) in the model. Abbreviations: +, plus; Previous PrecipBY, precipitation from October–March of the previous bio-year; Previous PrecipEW, early winter precipitation from October to December of the previous bio-year; Previous PrecipLW, late winter precipitation from January to March of the previous bio-year]
Table 18.
Parameter estimate (β), standard error (SE), and 95-percent confidence intervals (95% CI) for the top models explaining annual survivorship of first year and adult Southwestern Willow Flycatchers at the upper San Luis Rey River monitoring area, San Diego County, California, 2015–19.[Detection probability (Age) was included in all models. Intercept represents first-year birds in all models and survival 2015-16 in models with year. All other effects values are the difference between that parameter and the intercept. Abbreviations: +, plus]
Table 19.
Model averaged real parameter estimate, standard error (SE), and 95-percent confidence intervals (95% CI) for annual survivorship for adult and first-year Southwestern Willow Flycatchers at the upper San Luis Rey River monitoring area, San Diego County, California, 2015–19.[Parameter estimates averaged over all eight models in the model-set]
Movement
First-Year Dispersal
Observations of returning birds banded as nestlings allowed us to calculate dispersal distances between their natal locations and their first breeding territories. The average natal dispersal distance was 3.1±2.6 km (n=9; range 0.3–8.5 km; table 20). There was no difference between the dispersal distances of males and females (F1,7=0.058, P=0.82). While our confirmed sample size was small (n=9), we also estimated dispersal distances for eight additional natal flycatchers that were observed but not captured. The estimated average dispersal distance of captured and uncaptured natal birds combined was 3.2±2.1 km. Of the natal flycatchers, 65 percent (11/17) established their first breeding territories within the nest monitoring area (average dispersal distance: 2.0±1.1 km), while the remaining birds moved to Lake Henshaw (n=6; average dispersal distance: 5.4±1.8 km).
Table 20.
Dispersal distances of natal banded Southwestern Willow Flycatchers at the upper San Luis Rey River monitoring area and Lake Henshaw, San Diego County, California, 2017–19.[Sex: F = female, M = male. Year/location/territory: MON, upper San Luis Rey River monitoring area; VLH, VID Lake Henshaw; see appendix 1, figs. 1.1–1.4 for territory locations. Dispersal distance: confirmed, includes flycatchers whose natal locations were confirmed by recapture; values represent the distance between the natal location and the first adult location; estimated, includes flycatchers whose exact natal locations within MON were unknown; min, minimum distance calculated between the closest successful nest in the bird’s natal year to the first adult location; max, maximum distance calculated between the farthest successful nest in the bird’s natal year to the first adult location; mid, midpoint of min and max distances. Other abbreviations: km, kilometer; —, not applicable]
Adult Fidelity and Movement
Resighting banded birds also allowed us to identify the behavior of adult flycatchers that either returned to the same territory they used in a previous year or showed between-year movement. We found that adult flycatchers were primarily territory-faithful; on average, 69±13 percent of between-year movements represented adults that returned to the same territory (or within 100 m) they held in the previous year (table 21). There was no difference in territory fidelity by sex (Fisher’s Exact test, P=1.00) or year (Fisher’s Exact test, P=0.55), although territory fidelity appeared lower in 2018–19 (50 percent) compared to earlier years (73–79 percent, table 21). Results of logistic regression of the likelihood that adult flycatchers remained on the same territory between years as a function of whether they successfully fledged young in the previous year indicated a strong relationship, with flycatchers successful in fledging young more likely to return to the same breeding territory than unsuccessful birds (table 22).
Table 21.
Territory fidelity of adult banded Southwestern Willow Flycatchers at the upper San Luis Rey River monitoring area, San Diego County, California, 2015–19.[±, plus or minus; SD, standard deviation]
Table 22.
Results of logistic regression on the effect of nesting success in the prior year on the probability that adult Southwestern Willow Flycatchers would remain on the same breeding territory in the subsequent year at the upper San Luis Rey River monitoring area, San Diego County, California, 2015–19.The average distance moved between years by adult flycatchers was 0.5±0.8 km (0.0–3.5 km; table 23). Adults moved significantly shorter distances between years compared to the average natal dispersal distance (3.1±2.6 km; H(1)=14.5, P<0.001). Adult males appeared to move longer distances than females, but there was no statistical difference (H(1)=0.7, P=0.41). Two adult males were documented moving from the monitoring area to Lake Henshaw. There was also no difference in the average distance moved between years (excluding two birds originally seen in 2016 that were not seen again until 2019; H(3)=2.1, P=0.56).
Table 23.
Between-year movement of adult Southwestern Willow Flycatchers by year and sex at the upper San Luis Rey River monitoring area and Lake Henshaw, San Diego County, California, 2015–19.[Distances are in kilometers. Abbreviation: N, sample size]
Habitat and Nest Site Characteristics
Habitat Characteristics
Flycatcher territories in the monitoring area between 2015 and 2019 occurred in five habitat types (table 24). Of the 5 habitat types, 47 percent (20/43) of territories were in willow-oak, 19 percent (8/43) in willow-ash, 16 percent (7/43) in oak-sycamore, 12 percent (5/43) in mixed willow riparian, and 7 percent (3/43) in willow-sycamore. All flycatcher territories occupied during the study period contained greater than 95-percent native plant cover. The most commonly recorded dominant species at flycatcher territories included red or arroyo willow, coast live oak, California sycamore, and velvet ash.
Table 24.
Habitat characteristics of Southwestern Willow Flycatcher territories at the upper San Luis Rey River monitoring area, San Diego County, California, 2015–19.[Territory: See appendix 1, figs. 1.1–1.4 for territory locations. Habitat type: Mixed willow riparian: Habitat dominated by one or more willow species, including Goodding’s black willow, and red or arroyo willow (SAL), with mule fat as frequent co-dominant. Oak-sycamore: Woodlands in which coast live oak (QUE) and California sycamore (PLT) exist a co-dominants, Willow-ash: Willow riparian habitat in which velvet ash (FRX) is a co-dominant. Willow-oak: Willow riparian habitat in which coast live oak is a co-dominant. Willow-sycamore: Willow riparian habitat in which California sycamore is a co-dominant. Dominant species: ALN, White Alder (Alnus rhombifolia). Years occupied: X, occupied, —, not occupied. NDVI change: The positive or negative percent change in values from 2016 to 2020. Other abbreviations: NDVI, normalized difference vegetation index; −, negative]
In 2018, we began noticing dead and dying oaks in the monitoring area. We investigated the change in mean NDVI values between 2016 and 2020 in all territories occupied by resident flycatchers between 2016 and 2019 and found that NDVI values decreased in 49 percent of flycatcher territories (21/43; table 24). The decrease in NDVI values occurred along a gradient of severity from upstream to downstream, with the territories furthest downstream (C20–24; R1–17; appendix 1, figs. 1.1–1.2) showing no negative change and the territories upstream (C1–14; V1–12; appendix 1, figs. 1.2–1.4) experiencing the largest decrease in NDVI values. The change is visually apparent with the spectrum of NDVI values overlaid on aerial imagery in one example territory (C13; fig. 11A, 11B; appendix 1, fig. 1.3) that showed a decline in overall NDVI values: live vegetation appears green on the image, and dead vegetation appears red (the San Luis Rey River also appears as “dead” vegetation within the image). This particular territory was occupied for 3 years of the study (2016–18) but was vacant in 2019. We did not see a clear relationship between territory occupancy and a change in NDVI values, as 43 percent (6/14) of territories occupied in 2019 were territories that showed a decrease in NDVI values; however, there may be a lag time associated with NDVI change and territory abandonment.
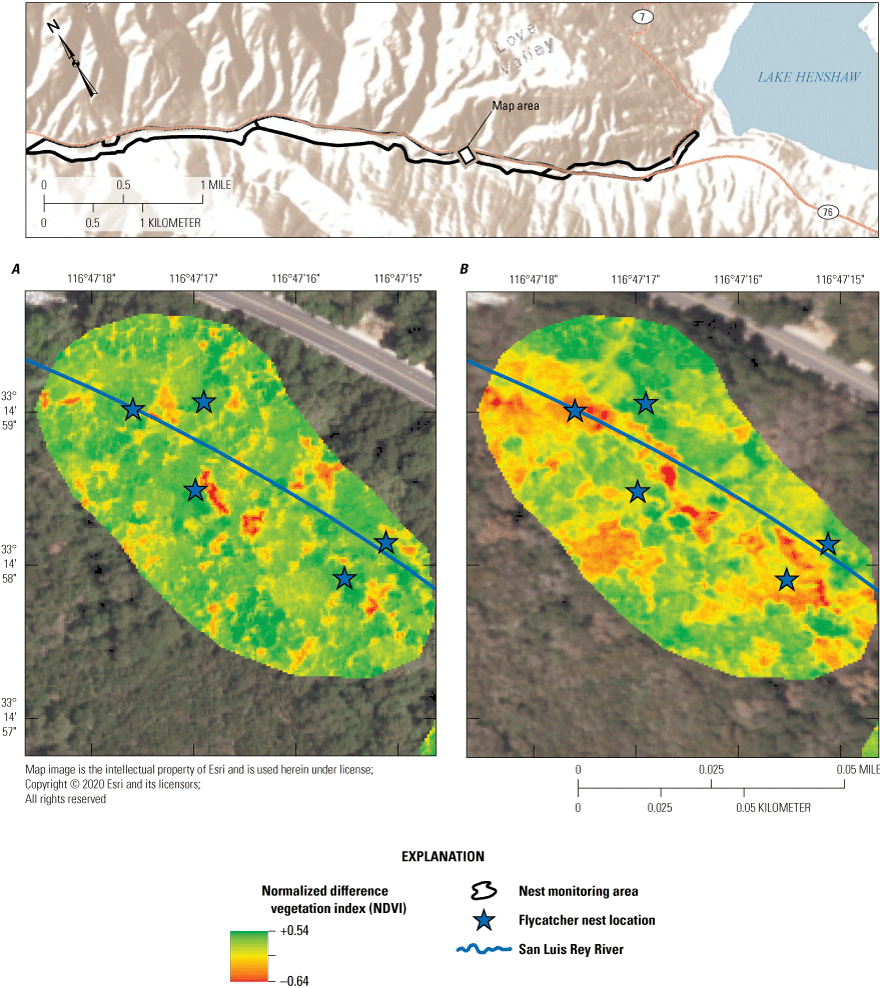
Comparison of NDVI values from A, 2016 to B, 2020 at Southwestern Willow Flycatcher territory C13 at the upper San Luis Rey River monitoring area, San Diego County, California.
Nest Site Characteristics
Flycatchers used 13 plant species for nesting from 2016 to 2019, although not all were used each year. The only host species that flycatchers used in all 4 years was coast live oak; overall, 70 percent of all nests were placed in coast live oak (table 25). Several other species were used in more than one year: wild rose (Rosa californica) and stinging nettle (Urtica dioica) were used in 3 of the 4 years, and creeping snowberry (Symphoricarpos mollis), California blackberry (Rubus ursinus), poison oak (Toxicodendron diversilobum), and velvet ash were used in 2 of the 4 years (table 25). All other species were only used for one individual nest in 1 of the 4 study years.
Table 25.
Host plant species used by Southwestern Willow Flycatchers at the upper San Luis Rey River monitoring area, San Diego County, California, 2016–19.[Numbers in parentheses are proportions of total nests. Abbreviation: —, no data]
None of the nest characteristics including host height, nest height, distance to the edge of the host, or distance to the edge of the vegetation clump where the nest was placed differed between years (table 26). In 2016, successful nests were placed higher than unsuccessful nests; no other within-year differences were observed (table 27).
Table 26.
Southwestern Willow Flycatcher nest characteristics and results of Kruskal-Wallis tests for between-year differences at the upper San Luis Rey River monitoring area, San Diego County, California, 2016–19.[Standard deviation presented in parentheses. Abbreviations: N, sample size; H, Kruskal-Wallis H statistic; P, P-value; m, meters]
Table 27.
Characteristics of Southwestern Willow Flycatcher nests and results of Mann-Whitney U tests comparing successful versus unsuccessful nesting attempts within years at the upper San Luis Rey River monitoring area, San Diego County, California, 2016–19.[Standard deviation presented in parentheses. Abbreviations: N, sample size; U, Mann-Whitney U statistic; P, P-value; m, meters]
Discussion
Countywide Surveys
Over the course of this study, we surveyed 33 locations along 10 drainages in San Diego County; 18 percent (6/33) of these locations supported resident flycatchers. We detected a minimum of 80 individual flycatchers at six locations, 83 percent (5/6) of which were along the San Luis Rey River (Bonsall, Cleveland National Forest, Lake Henshaw, Rey River Ranch, and Vista Irrigation District). Within our study footprint, the San Dieguito River was the only drainage other than the San Luis Rey River where resident flycatchers were documented. Out of the 33 locations we surveyed, 11 were historically occupied, and we found resident flycatchers continuing to occupy 45 percent (5/11) of these locations. Among the historic locations with resident flycatchers, in all cases the number of flycatchers had declined from previously reported numbers. Only one territory was at San Dieguito, a 67-percent decline from 1997, when three flycatcher territories were observed (Kus and Beck, 1998), and at Bonsall we documented a 50-percent decline from previous high population counts seen in 2014 (four to two; B. Kus, U.S. Geological Survey, unpub. data, 2014). The remaining resident flycatchers observed during this study occurred at the upper San Luis Rey River near Lake Henshaw. Collectively, the three locations that were historically occupied (Cleveland National Forest, Rey River Ranch, and Vista Irrigation District) declined by 71 percent from 1999 (48) to 2019 (14) and declined by 50 percent during the course of this study (2016–19). The last remaining location where resident flycatchers were documented in San Diego County was at Lake Henshaw. Of the 22 locations predicted to support suitable flycatcher habitat, Lake Henshaw was the only survey location where we documented resident flycatchers. We could find no previous historical accounts of flycatchers at Lake Henshaw; therefore, we believe this study provides the first documentation of this population, which included 40 individuals in 24 territories in 2019. Combining the Lake Henshaw population with the nearby historically occupied sites suggests that the decline in the upper San Luis Rey River flycatcher population since 1999 is closer to 21 percent (1999: 48 territories, 2019: 38 territories) than 71 percent and reveals a recent shift in the distribution of flycatchers along the drainage.
Although survey data for Lake Henshaw before 2018 are lacking, we believe that suitable habitat at Lake Henshaw increased for breeding flycatchers between 2014 and 2015. From 2012 to 2016, reservoir levels at Lake Henshaw dam were lower than average during a long-term drought in San Diego County (2012–16 average, 2,660 feet [ft]; 1953–2020 average, 2,664 ft; D. Smith, Vista Irrigation District, written commun., 2020). This would have allowed more shoreline to be exposed and for riparian habitat to increase. Paxton and others (2007) observed at their Roosevelt Dam study site in Arizona that new riparian habitat was first colonized by breeding flycatchers approximately 3 years after lake drawdown. If this scenario applies to our study area, the amount of suitable habitat at Lake Henshaw would have increased by 2015. A visual examination of NDVI/NAIP imagery layers in 2012, 2014, 2016, and 2018 supports this hypothesis, and shows the riparian area increasing as the shoreline recedes. Because we did not survey Lake Henshaw until 2018, we can only postulate about the state of historical riparian habitat and flycatcher occupancy at that site. One anecdotal observation (Andrews, 2020) reported five Willow Flycatchers at Lake Henshaw on August 10, 2017; these were most likely resident flycatchers. In addition, an adult male banded in 2015 at Vista Irrigation District was observed at Lake Henshaw in 2019. This bird held a territory in 2016 at Vista Irrigation District, disappeared in 2017 and 2018, and was rediscovered in 2019; this bird likely moved to Lake Henshaw in 2017. However, it is also possible that resident flycatchers may have existed at Lake Henshaw before the increase in suitable habitat because there are several “islands” of mature willow riparian and cottonwood trees with canopy heights as high as 12 m where resident flycatchers may have been present.
Only a small proportion of locations that we surveyed were occupied by flycatchers, despite being characterized by a habitat model (Hatten, 2016) as supporting suitable habitat. Flycatchers may be below carrying capacity with regard to available habitat, but it is also possible that the Hatten (2016) model did not capture some feature affecting habitat suitability, such as vegetation density in the lower canopy. While sites may appear suitable based on imagery of the upper canopy, sites lacking sufficient cover within 1–3 m of the ground where flycatchers place their nests are unlikely to be occupied. Additionally, the Hatten model was originally calibrated based on riparian habitats in Arizona and New Mexico and may not perform as well in coastal southern California. Proximity to a source population may also be a key determinant of colonization; although we documented a few long-distance dispersals of up to 55 km between drainages, most dispersal was more localized.
Demography of Monitored Population
Composition
Annually, most of the territories at the upper San Luis Rey monitoring area were occupied by pairs, with a variable number of single males present each year. Among the territories containing pairs, we documented monogamous and polygynous pairings. While previous surveys and limited nest monitoring of this population allowed for speculation about the degree of polygyny (Kus and others, 1999; B. Kus, U.S. Geological Survey, unpub. data, 2010), our banding studies allowed us to characterize this with more certainty. The degree of polygyny we documented at the upper San Luis Rey River monitoring area fluctuated annually but fell within the range reported in other studies (10–50 percent of paired males; Sedgwick, 2000; Davidson and Allison, 2003; Kus and others, 2017). Polygyny in Willow Flycatchers is thought to be facultative and has been linked to differences in adult sex ratios (Davidson and Allison, 2003; Kus and others, 2017). Kus and others (2017) documented rates of male polygyny up to 100 percent in a declining population at MCBCP, where the rate increased as the ratio of adult females to males increased. We observed a similar relationship at the upper San Luis Rey River monitoring area when the highest rate of male polygyny (54 percent) occurred following a decline in the number of males between 2016 and 2017, which created an adult sex ratio that favored females.
Breeding Productivity
The measures of breeding productivity we documented at the upper San Luis Rey River monitoring area were highly variable, and within the timeframe of this study, showed somewhat biennial rather than annual variation. Flycatchers experienced greater success in the first two years of the study, with multiple measures of productivity including hatching success, fledging success, nest success and seasonal productivity significantly higher in 2016 and 2017 than in 2018 and 2019. However, higher productivity in 2016 and 2017 did not result in a population increase in 2018 and 2019; instead, the population continued to decline. Although some of this decline could be attributed to emigration to Lake Henshaw, it appears to be largely a response to declining productivity over time. The highest productivity we documented was 1.6 young per pair in 2016 (comparable to 1.5 reported by Kus and others [1999]), and by the end of the study, productivity had dropped to 0.5 young per pair. Apparent nest success was highly variable, ranging from a high of 37 percent in 2016 and 2017 to a low of 11 percent in 2019, with the high comparable to that collected by Kus and others (1999) of 38 percent. The decline in nest success in the latter 2 years of the study appeared to coincide with higher rates of predation; 66 percent of all nests were depredated in 2018, compared to the low of 49 percent in 2016. Cowbird parasitism also increased in the latter years and averaged 25 percent of all nests in 2018–19 compared to 7 percent in 2016–17. Kus and others (1999) observed no cowbird parasitism in 1999, although cowbird trapping was performed in that year, and likely decreased the cowbird population (J.M. Wells, U.S. Forest Service, written commun., 1999). In contrast, over an 18-year period, the flycatcher population at MCBCP averaged higher average nest success (54±21 percent), higher overall seasonal productivity (1.9±0.7 young per pair), lower predation (32±17 percent of all nests depredated), and near zero cowbird parasitism.
Our analysis of daily nest survival produced a pattern across years mirroring that of apparent nest success, with DSR declining between the first two and the last two years of the study. The analysis identified precipitation as possibly influencing nest survival, although the contribution of precipitation relative to other factors discussed above and how those vary across years is unclear. In particular, it is unclear whether our results indicate a causal relationship between precipitation and DSR, or whether they are a statistical artifact driven by extreme differences between 2018 and 2019.
Although we were able to “rescue” most parasitized nests by removing cowbird eggs and thereby increasing annual nest success by up to 45 percent, parasitism reduced productivity through its effect on flycatcher clutch size, which sets the limit on the potential number of young that can be produced. Clutch size reduction is a typical feature of parasitism and occurs when cowbird females remove a host egg and replace it with one of their own (Rothstein and others, 2003). This reduces flycatcher clutch size, which averaged approximately three eggs annually, by about 30 percent, a substantial limit on reproductive potential. Moreover, parasitism may be contributing to higher predation rates observed in this population; Stumpf and others (2011) found predation rates were higher in parasitized nests compared to unparasitized nests. Parasitized nests may be at greater risk from predation because of increased activity at nest sites from adult flycatchers attempting to thwart parasitism attempts and increased noise from cowbird nestlings that may increase auditory cues for predators. Moreover, cowbirds themselves may depredate flycatcher nestlings. While the overall rate of parasitism during our study was low (16 percent), higher rates in 2018 (23 percent) and 2019 (27 percent) are cause for concern. The threshold set by the Southwestern Willow Flycatcher recovery plan (U.S. Fish and Wildlife Service, 2002) to trigger management intervention if parasitism rates exceed 20–30 percent for more than 2 years was exceeded in the latter years of this study.
One other possible explanation for the greater success observed in the first two years of the study is the timing of nest initiation: in 2016 the median initiation date was June 5, compared to June 9 in 2019. It is possible that there is greater food availability earlier in the season, less predation and parasitism pressure, or a combination of other unknown variables contributing to greater success. Earlier nest initiation also translates into earlier fledge dates, which can influence subsequent survival of young. Paxton and others (2007) demonstrated that at their study site in Arizona, earlier fledge dates were associated with higher first-year survivorship. For each day later into the season a nestling fledged, its odds of survival decreased by 2 percent. Earlier fledge dates in 2017 may have translated to higher first-year survival in our study, as most of the first-year flycatchers we encountered originated in 2017.
Survivorship and Movement
Annual Survivorship
Annual survivorship for adults and first-year birds does not appear to be a factor contributing to the declines seen in the monitored population at the upper San Luis Rey River. Our survivorship estimates for adults were within the range of survivorship estimates reported in other long-term studies of flycatchers. Adult survivorship in our study area averaged 64±11 percent across years, slightly above survivorship estimates for adults at MCBCP from 2000 to 2019 (60±3 percent; B. Kus, U.S. Geological Survey, unpub. data, 2000–19), comparable to the estimated adult survivorship for the Arizona population from 1996 to 2005 (64 percent; Paxton and others, 2007), and higher than the adult return rate reported at SFKRV from 1989 to 2007 (52±18 percent; Whitfield and Henneman, 2009). Our estimated adult male survivorship was 69±7 percent, and for females was 45±10 percent. The pattern of sex-related differences in survival varies across sites: at MCBCP, male survival estimates were lower than for females (53±5 percent versus 67±4 percent, respectively), while in Arizona, male and female estimates were identical at 64 percent. Female survival may have been underestimated in our study as a result of small samples sizes.
First-year flycatcher survival at our study site was approximately half that of adults, as is typical for passerines. Our estimate of 31±9 percent is higher than that estimated for MCBCP (20±3 percent) and SFKRV (26±3 percent; juvenile return rate), but lower than that estimated for Arizona (34 percent). First-year survival may be even higher at our site, as we may have under-estimated survival of first-year flycatchers in the 2016 cohort, since it is possible that some returning natal flycatchers in 2017 dispersed to Lake Henshaw in their first year as adults and were missed since we did not survey there until 2018. Additionally, longer term studies such as MCBCP (18 years), SFKRV (18 years), and Arizona (10 years) report that natal flycatchers may go undetected for up to 5 years, suggesting that a longer study period may provide more robust survivorship estimates.
Not only were our estimates of adult and first-year survival comparable to those from other well-studied populations, but we also found no variability across years, and no evidence that precipitation on the breeding grounds influenced survival. Together, these findings suggest that in this population annual survival is less susceptible than other demographic parameters to factors promoting population declines.
Movement
The results of our banding studies provided evidence of a shift in distribution among flycatchers in the upper San Luis Rey River area, including Lake Henshaw. We documented natal dispersal and adult movements from the monitoring area to Lake Henshaw. Of the first-year flycatchers, 33 percent dispersed to Lake Henshaw to breed for the first time as adults. Average first-year dispersal distance was 3.1±2.6 km with the longest dispersal observed for a female that dispersed from the monitoring area to Lake Henshaw, a distance of 8.5 km. While most adult between-year movements were short, our study also documented two adult males that moved to Lake Henshaw. Territory fidelity in adult flycatchers was higher from 2015 to 2018 (average 76 percent) but was lower between 2018 and 2019 (50 percent). We found a strong relationship between nesting success and territory fidelity, with successful flycatchers more likely to return to the same breeding territory than unsuccessful flycatchers. Apparent nest success was low in 2018, which may have prompted reduced territory fidelity the following year. The increased between-year movement may also indicate that adult flycatchers were evaluating all the habitat in the monitoring area in search of the most suitable habitat.
Habitat and Nest Characteristics
As previous studies have shown, coast live oak is one of the primary components of the habitat at the upper San Luis Rey River monitoring area (Kus and others, 1999; B. Kus, U.S. Geological Survey, unpub. data, 2010). The high proportion of oak in the upper San Luis Rey River monitoring area is unusual in that most of the occupied flycatcher habitats are primarily dominated by more traditional riparian vegetation such as willow, cottonwood, alder, and so forth. During our study, coast live oak was a co-dominant species in 63 percent of flycatcher territories. Coast live oak was also the most commonly used nest host, with 70 percent of nests in our study placed in this species. In 2018, we began to observe dead and dying oaks in our study area, which we believe to be the result of goldspotted oak borer (Agrilus auroguttatus) infestation. At the conclusion of this study, we investigated the overall change in NDVI in flycatcher territories within the monitoring area and found that the mean NDVI values decreased in 49 percent of monitored territories between 2016 and 2020. In the areas with dead oaks, the canopy appeared to be more open and there were more gaps in the habitat; this could create additional opportunities for predation and parasitism.
We found no differences between years in nest placement and no indication that flycatchers have adjusted their nest placement to avoid oak trees. Coast live oak remained the most commonly used nest host even in later years after we observed dead and dying oaks.
Conclusion
We began this study with the primary goals of investigating the status of Southwestern Willow Flycatchers in San Diego County at historically occupied locations, surveying habitat identified by a recently created habitat suitability model in search of previously unknown locations that supported breeding flycatchers and embarking on a comprehensive exploration of the demography of the upper San Luis Rey River population. Over the course of this study, we documented a large shift in distribution among populations of flycatchers in southern California and linked it to observed changes in habitat suitability and availability. The oak trees in this historically occupied section are dying and may be driving emigration from the site. Coincidentally, new habitat has emerged a short distance upstream at Lake Henshaw, populated at least in part by immigrants from the historic population. Lake Henshaw now supports the largest breeding population of Southwestern Willow Flycatchers in California, making it central to understanding the conditions that favor and promote flycatchers and their habitat. Maintaining favorable conditions, as well as identifying ways to improve historically occupied habitat downstream by combating the loss of oaks, will be essential to the persistence of this important population.
During countywide surveys, we documented population declines and reduced distribution in all historically occupied Southwestern Willow Flycatcher survey locations. The population declines observed in our study mirror declines observed at other known breeding locations for flycatchers in San Diego County, including at Marine Corps Base Camp Pendleton (B. Kus, U.S. Geological Survey, unpub. data, 2019) and the lower San Luis Rey River (Houston and others, 2021), which have declined precipitously or been extirpated. Of particular note is the decline at Marine Corps Base Camp Pendleton, which progressed over many years despite seemingly high demographic performance. Additionally, declines have continued statewide, with populations in South Fork Kern River Valley (M.J. Whitfield, Southern Sierra Research Station, written commun., 2020) recently extirpated after years of decline.
The knowledge gained during this study, in combination with other information on the status and distribution of Southwestern Willow Flycatchers in San Diego County, will inform management to protect and enhance flycatchers and their habitat. A successful strategy could address ways to monitor trends in flycatcher distribution and abundance through a comprehensive survey protocol, identify and protect suitable habitat, and identify and potentially manage threats that affect flycatcher vital rates.
References Cited
Andrews, R., 2020, eBird Checklist; eBird—An online database of bird distribution and abundance (web application): Ithaca, N.Y., eBird, accessed August 2, 2020, at https://ebird.org/ebird/view/checklist/S38575538.
Davidson, R.F., and Allison, L.J., 2003, Effects of monogamy and polygyny on reproductive success in Southwestern Willow Flycatchers (Empidonax traillii extimus) in Arizona, in Sogge, M., Kus, B.E., Sferra, S.J., and Whitfield, M.J., eds., Ecology and conservation of the willow flycatcher: Studies in Avian Biology, v. 26, p. 118–124.
Dinsmore, S.J., White, G.C., and Knopf, F.L., 2002, Advanced techniques for modeling avian nest survival: Ecology, v. 83, no. 12, p. 3476–3488. [Also available at https://doi.org/10.1890/0012-9658(2002)083[3476:ATFMAN]2.0.CO;2.]
Hatten, J.R., 2016, A satellite model of Southwestern Willow Flycatcher (Empidonax traillii extimus) breeding habitat and a simulation of potential effects of tamarisk leaf beetles (Diorhabda spp.), southwestern United States: U.S. Geological Survey Open-File Report 2016–1120, 88 p., accessed March 18, 2022, at https://doi.org/10.3133/ofr20161120.
Howell, S.L., and Kus, B.E., 2022, Southwestern Willow Flycatcher (Empidonax traillii extimus) surveys and nest monitoring in San Diego County, California: U.S. Geological Survey data release, https://doi.org/10.5066/P96VC5Y4.
Houston, A., Allen, L.D., Pottinger, R.E., and Kus, B.E., 2021, Least Bell's Vireos and Southwestern Willow Flycatchers at the San Luis Rey flood risk management project area in San Diego County, California—Breeding activities and habitat use—2020 annual report: U.S. Geological Survey Open-File Report 2021–1053, 67 p., accessed March 18, 2022, at https://doi.org/10.3133/ofr20211053.
Kus, B.E., and Beck, P.P., 1998, Distribution and abundance of the Least Bell’s Vireo (Vireo bellii pusillus) and the Southwestern Willow Flycatcher (Empidonax traillii extimus) at selected southern California sites in 1997: Sacramento, Calif., Prepared for the California Department of Fish and Game, Wildlife Management Division.
Kus, B.E., and Whitfield, M.J., 2005, Parasitism, productivity, and population growth—Response of Least Bell’s Vireos (Vireo bellii pusillus) and Southwestern Willow Flycatchers (Empidonax traillii extimus) to cowbird (Molothrus spp.) control, chap. 2 of Oretega, C.P., Chace, J.F., and Peer, B.D., eds., Ornithological monographs—Management of cowbirds and their hosts—Balancing science, ethics, and mandates: American Ornithological Society, v. 2005, no. 57, p. 16–27. [Also available at https://doi.org/10.2307/40166811.]
Kus, B.E., Howell, S.L., and Wood, D.A., 2017, Female-biased sex ratio, polygyny, and persistence in the endangered Southwestern Willow Flycatcher (Empidonax traillii extimus): The Condor, v. 119, no. 1, p. 17–25, accessed March 18, 2022, at https://doi.org/10.1650/CONDOR-16-119.1.
Paxton, E.H., Sogge, M.K., Durst, S.L., Theimer, T.C., and Hatten, J.R., 2007, The ecology of the southwestern willow flycatcher in central Arizona—A 10-year synthesis report: U.S. Geological Survey Open-File Report 2007–1381, 143 p. [Also available at https://doi.org/10.3133/ofr20071381.]
R Core Team, 2020, R—A language and environment for statistical computing: Vienna, Austria, R Foundation for Statistical Computing, accessed November 4, 2020, at https://www.R-project.org/.
Schlorff, R.W., 1990, Report to the Fish and Game Commission—Status review of the Willow Flycatcher (Empidonax traillii) in California: State of California, Resources Agency, Department of Fish and Game, Wildlife Management Division, Department Candidate Species Status Report 90–04, 23 p., accessed March 18, 2022, at https://nrm.dfg.ca.gov/FileHandler.ashx?DocumentID=22572.
Sedgwick, J.A., 2000, Willow Flycatcher (Empidonax traillii), in Poole, A.F., and Gill, F., eds., The birds of North America: Philadelphia, Pa., Cornell Lab of Ornithology, no. 533, 32 p., accessed March 18, 2022, at https://doi.org/10.2173/tbna.533.p.
Sogge, M.K., Ahlers, D., and Sferra, S.J., 2010, A natural history summary and survey protocol for the Southwestern Willow Flycatcher: U.S. Geological Survey Techniques and Methods, book 2, chap. A10, 38 p., accessed March 18, 2022, at https://pubs.usgs.gov/tm/tm2a10/.
Stumpf, K.J., Theimer, T.C., McLeod, M.A., and Koronkiewicz, T.J., 2011, Distance from riparian edge reduces brood parasitism of Southwestern Willow Flycatchers, whereas parasitism increases nest predation risk: The Journal of Wildlife Management, v. 76, no. 2, p. 269–277. [Also available at https://doi.org/10.1002/jwmg.246.]
U.S. Fish and Wildlife Service, 2002, Southwestern Willow Flycatcher recovery plan: Albuquerque, N. Mex., i-ix + 210 p., appendices A-O, accessed March 20, 2020, at https://www.fs.fed.us/rm/pubs_other/rmrs_2002_finch_d001.pdf.
U.S. Geological Survey, 2021, National Agriculture Imagery Program (NAIP) aerial photography, accessed March 18, 2021, at https://earthexplorer.usgs.gov/.
White, G.C., and Burnham, K.P., 1999, Program MARK—Survival estimation from populations of marked animals: Bird Study, v. 46, no. S1, p. S120–S139. [Also available at https://doi.org/10.1080/00063659909477239.]
Whitfield, M.J., and Henneman, C., 2009, Southwestern Willow Flycatcher monitoring and removal of Brown-headed Cowbirds for the South Fork Kern River Valley in 2008, Final report (Contract number W91238-04-C-0014): Sacramento, Calif., Prepared for the U.S. Army Corps of Engineers, Sacramento District.
Appendix 1. Locations and Breeding Status of Southwestern Willow Flycatchers at the Upper San Luis Rey River Monitoring Area, San Diego County, California, 2015–19
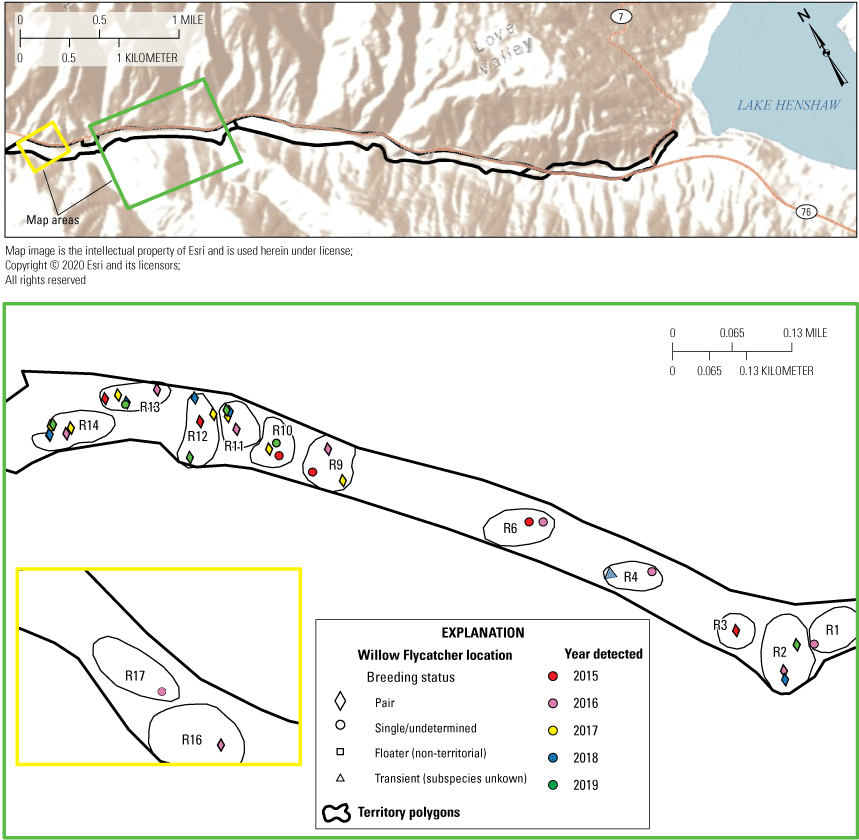
Locations and breeding status of Southwestern Willow Flycatchers at the upper San Luis Rey River monitoring area (downstream), San Diego County, California, 2015–19.
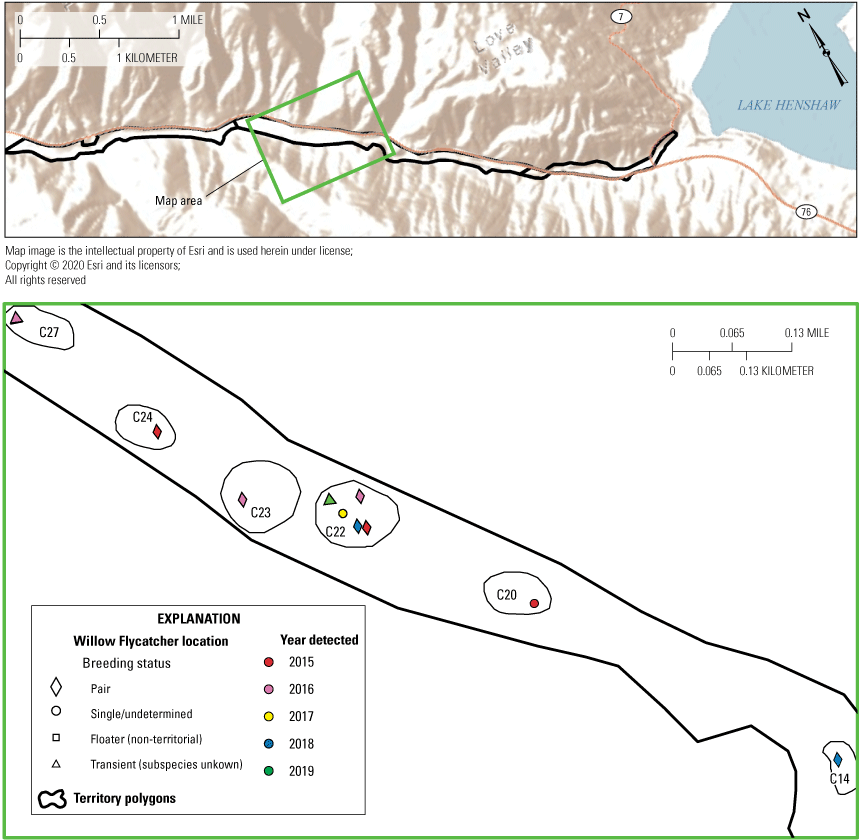
Locations and breeding status of Southwestern Willow Flycatchers at the upper San Luis Rey River monitoring area (west midstream), San Diego County, California, 2015–19.
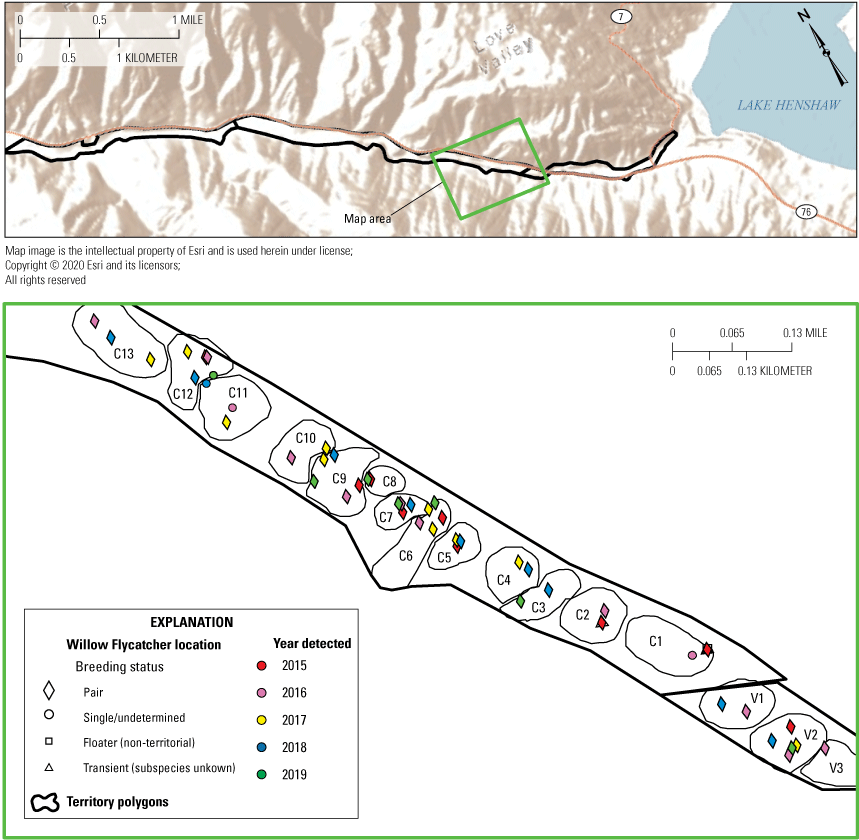
Locations and breeding status of Southwestern Willow Flycatchers at the upper San Luis Rey River monitoring area (east midstream), San Diego County, California, 2015–19.
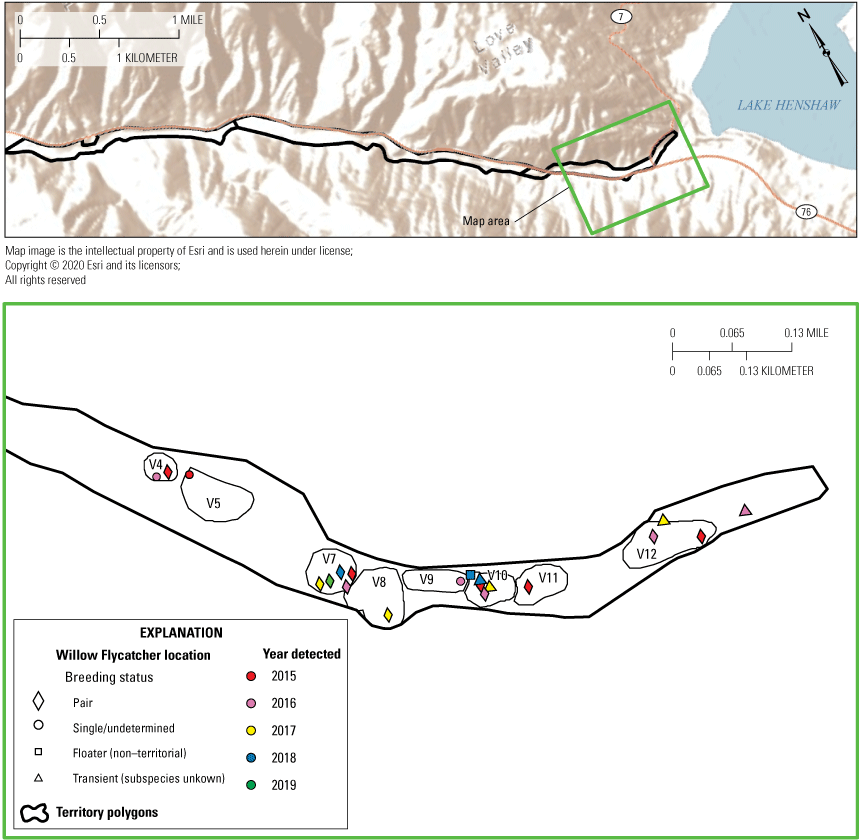
Locations and breeding status of Southwestern Willow Flycatchers at the upper San Luis Rey River monitoring area (upstream), San Diego County, California, 2015–19.
Datum
Horizontal coordinate information is referenced to the World Geographic System of 1984 (WGS 84).
Abbreviations
AIC
Akaike’s Information Criterion
ANOVA
Analysis of Variance
DSR
Daily Survival Rate
GPS
Global Positioning System
MCBCP
Marine Corps Base Camp Pendleton
NAIP
National Agricultural Inventory Program
NDVI
normalized difference vegetation index
SDMMP
San Diego Management and Monitoring Program
SFKRV
South Fork Kern River Valley
USGS
U.S. Geological Survey
For more information concerning the research in this report, contact the
Director, Western Ecological Research Center
U.S. Geological Survey
3020 State University Drive East
Sacramento, California 95819
https://www.usgs.gov/centers/werc
Publishing support provided by the U.S. Geological Survey
Science Publishing Network, Sacramento Publishing Service Center
Suggested Citation
Howell, S.L., Kus, B.E., and Mendia, S.M., 2022, Distribution and demography of Southwestern Willow Flycatchers in San Diego County, 2015–19: U.S. Geological Survey Open-File Report 2022–1082, 43 p., https://doi.org/10.3133/ofr20221082.
ISSN: 2331-1258 (online)
Study Area
| Publication type | Report |
|---|---|
| Publication Subtype | USGS Numbered Series |
| Title | Distribution and demography of Southwestern Willow Flycatchers in San Diego County, 2015–19 |
| Series title | Open-File Report |
| Series number | 2022-1082 |
| DOI | 10.3133/ofr20221082 |
| Year Published | 2022 |
| Language | English |
| Publisher | U.S. Geological Survey |
| Publisher location | Reston, VA |
| Contributing office(s) | Western Ecological Research Center |
| Description | Report: ix, 43 p.; Data Release |
| Country | United States |
| State | California |
| County | San Diego County |
| Online Only (Y/N) | Y |
| Additional Online Files (Y/N) | N |
| Google Analytic Metrics | Metrics page |