

Juvenile Green Sturgeon (Acipenser medirostris) Movement During Autumn and Winter in the Lower Sacramento River, California, 2016–20
Links
- Document: Report (4.3 MB pdf) , HTML , XML
- Download citation as: RIS | Dublin Core
Acknowledgments
The study and review would have not been possible without coordination and assistance from Sacramento Area Flood Control Authority (KC Sorgen); California Department of Fish and Wildlife (Marc Beccio, John Kelly); University of California, Davis; National Marine Fisheries Service, Sacramento and Santa Cruz Office (Ally Bosworth, Page Vick, Annalisa Tuel, Arnold Ammann, Cyril Michel); Bureau of Reclamation (Rodney Wittler); U.S. Army Corps of Engineers, Albuquerque District Office (Michael Porter); U.S. Army Corps of Engineers, Sacramento District Office (Andrea Meier, Ashley Lopez, David Colby, Brian Mulvey, Marshall Harper, Dan Artho, Melanie Tymes), and HDR Consultants (Gabriel Kopp). In memory of Ethan Mora. Data are not currently available from the funding organization, the U.S. Army Corps of Engineers. Contact the U.S. Army Corp of Engineers for further information.
Abstract
A collaborative acoustic telemetry study was conducted to describe behavior and movement patterns of juvenile green sturgeon (Acipenser medirostris) in the lower Sacramento River, California during 2016–19. For the study, juvenile green sturgeon were collected, tagged, and released in the Sacramento River between river kilometer (rkm) 467 and rkm 419 near Red Bluff, California. Telemetry monitoring sites were located between rkm 464 and rkm 1 to detect tagged fish that moved downstream. In this report, we describe movement patterns of juvenile green sturgeon in the lower Sacramento River between rkm 167 and rkm 52. In total, 98 juvenile green sturgeon were tagged and released during the study and 46 of these fish moved downstream and were detected in the lower Sacramento River. Downstream movement appeared to be associated with periods of increasing river flow, and the greatest percentage of tagged fish were detected moving downstream during the first period of increased streamflow each autumn. The number of tagged fish that were detected decreased in lower reaches of the study area, but it’s not clear if this was because fish experienced mortality while moving downstream, stopped moving downstream to rear in study reaches, or their transmitters stopped working due to battery life limitations. We did find that several fish were detected moving upstream between telemetry monitoring sites in the lower reaches of the study area. This study provides new insights into movement patterns and behavior of juvenile green sturgeon in the lower Sacramento River, but additional research will be required to better understand factors such as survival and how fish respond to estuarine conditions.
Introduction
Although green sturgeon (Acipenser medirostris) are a widely distributed member of the sturgeon family Acipenseridae (Adams and others, 2007), much of their life history is poorly understood. Adult green sturgeon are the most marine oriented of the sturgeon species (Adams and others, 2007). They reach sexual maturity between 13 and 20 years of age and spawn every 2–5 years in freshwater rivers (Moyle, 2002). Currently, spawning areas for green sturgeon have only been identified in Oregon and California (Moyle, 2002). Juveniles spend 1–4 years in freshwater and then outmigrate to the ocean, but little is known about behavior or survival during this life stage (Adams and others, 2007; Thomas and others, 2019). For example, outmigration timing, factors that influence outmigration timing, estuarine residence behavior, and freshwater survival rates are critical uncertainties which must be fully assessed to provide resource managers with information required for effective management. Green sturgeon in the Sacramento River comprise the southern distinct population segment (sDPS) of the overall population; the sDPS was listed as “threatened” under the U.S. Endangered Species Act in 2006 (National Marine Fisheries Service, 2006). Consequently, the need to better understand factors affecting behavior, movement, and survival of green sturgeon is particularly relevant in the sDPS. Juvenile green sturgeon collection is considered rare; telemetry studies involving the few juveniles encountered would greatly improve the understanding of habitat and utilization (Heublein and others, 2017).
Substantial efforts in the Sacramento River Basin have focused on monitoring the migration and survival of juvenile Pacific salmon (Oncorhynchus spp.), which include the annual deployment and maintenance of an extensive network of acoustic telemetry receivers to detect tagged juvenile salmon (Michel and others, 2013; Notch and others, 2020). Given these existing telemetry arrays and the need for information on juvenile green sturgeon behavior and movement, the U.S. Army Corps of Engineers (USACE) purchased and deployed additional telemetry receivers and acoustic transmitters for a study that focused on juvenile green sturgeon in the lower Sacramento River during 2016–19. Juvenile green sturgeon tagged and released during this study could be detected on monitoring sites established explicitly for the evaluation along with other sites that were operated for the previously mentioned juvenile salmon studies. Juvenile green sturgeon were collected for tagging in benthic trawls and screw traps operated by the U.S. Fish and Wildlife Service (USFWS), and staff from the USFWS and the University of California, Davis tagged and released study fish. After release, tagged fish were monitored using acoustic receivers managed by multiple research partners in the Sacramento River Basin. The study area was partitioned into two regions for data analysis and reporting: the upper Sacramento River, which included the reach between river kilometer (rkm) 465 (as measured from the Golden Gate Bridge) and rkm 192, and the lower Sacramento River, which included the reach between rkm 167 and rkm 0. This report summarizes results from the lower Sacramento River reach.
The goal of this project was to describe movements of juvenile green sturgeon in the lower Sacramento River. We expected fish to be present in the lower Sacramento River throughout the study period and fish movements to be linked with flow cues. Published information about juvenile green sturgeon movements is limited. This project aims to fill in some of the knowledge gaps.
Methods
Fish Tagging and Release
Juvenile green sturgeon were collected for tagging in benthic trawls (Gruber and others, 2017) in the Sacramento River between rkm 467 and rkm 419 or as bycatch in the Red Bluff Diversion Dam (RBDD) rotary screw trap (rkm 463) operated by the USFWS. Fish were collected in 11 benthic trawl locations in the Sacramento River and its tributaries at the following locations: Antelope Bridge (rkm 467), Antelope Creek (rkm 462), Altube Island Complex (rkm 461); Juvenile Glide (rkm 460); Bow River (rkm 455); Bank Robber (rkm 453); Hunters (rkm 450); Oat Creek (rkm 447); and upper (rkm 422), middle (rkm 421), and lower (rkm 419) Woodson Glide.
After collection, fish were surgically tagged with an acoustic transmitter. Tagging was conducted at the collection site by trained staff from the University of California, Davis (in 2016) or USFWS (in 2017–19). Juvenile sturgeon were anesthetized with buffered tricaine methanesulfonate (MS-222) while placed in a foam yoga block modified with a v-shaped slot to cradle the fish during tagging. Water was continuously supplied over the gills throughout the surgery.
Methods varied by year for pre-tag holding duration, tagging entity, and post-tag holding duration. In 2016, fish were held overnight prior to tagging whereas during 2017–19 tagging occurred on the same day as collection. In 2016, fish were held in a net pen at the RBDD overnight prior to tagging, tagged, and released after sunset on the day of tagging near the collection site. During tag implantation, a small ⁓ 10 millimeter (mm) incision was made with a micro scalpel blade on the ventral side of the fish between the third and fourth scute. Incisions were closed with 6/0 absorbable sutures. One of two transmitters was implanted based on fish length and tag availability. Fish with a total length greater than 150 mm were implanted with Advanced Telemetry Systems (ATS) model SS300 and battery 337 whereas fish with a total length greater than 250 mm were implanted with Pacific Northwest National Laboratory (PNNL) prototype tag (table 1; Lu and others, 2016). During 2017–19, acoustic transmitters were implanted in juvenile green sturgeon using a sutureless flank incision following Liss and others (2017). One of four transmitters was implanted based on fish length and tag availability. Fish greater than 150 mm total length were implanted with the ATS model SS300 and battery 337 or 348 or model SS400 cylindrical tag. Fish greater than 250 mm were implanted the PNNL sturgeon tag. Fish were allowed to recover from the surgical/handling process for a median of 23 minutes after the process was completed and were then released near the collection site
Table 1.
Specifications for acoustic transmitters used during a study of juvenile green sturgeon (Acipenser medirostris) in the lower Sacramento River, California, 2016–20.[Pulse rate interval on all transmitters was approximately 10 seconds (range = 9.4–10.3). Abbreviations: ATS, Advanced Telemetry Systems, Isanti, Minnesota; PNNL, Pacific Northwest National Laboratory, Richland, Washington; n, number of fish; g, grams; d, days]
A total of 98 juvenile green sturgeon were tagged and released during the study (table 1). Eight fish were collected from the RBDD rotary screw trap, tagged, and released on October 31, 2016, (n, number of fish; n=2), November 1, 2016, (n=1), and November 16, 2017 (n=5). All other fish (n=90) were collected in benthic trawls. More than half of the fish (55 fish) were tagged and released during October 2017–February 2018. Most fish (85.7 percent) were released in October or November each year; winter releases (December–February) of tagged fish only occurred during 2017–2018. Fish sizes ranged from 141 to 294 mm (total length; mean = 204) and weights from 18.5 to 168.9 grams (g; mean = 60.0 g) in all years (table 2). Tag burden (transmitter weight divided by body weight of fish) did not exceed 1.5 percent.
Table 2.
Summary of tagging numbers, collection method, mean total fish length, and mean fish weight for study of juvenile green sturgeon (Acipenser medirostris) in the Sacramento River, California, 2016–19.[Abbreviations: mm, millimeters; g, grams]
Fish Monitoring
We primarily relied on the extensive Juvenile Salmon Acoustic Telemetry System (McMichael and others, 2010) monitoring network that is deployed annually throughout the Sacramento-San Joaquin River and Interior Delta for juvenile Chinook salmon (Oncorhynchus tshawytscha) studies (Notch and others, 2020, 202121; Michel and others, 2021) to detect tagged green sturgeon during our study. However, juvenile green sturgeon were collected, tagged, and released outside of the primary study period for the salmon studies, so the number of sites that were operational during our study period varied. Therefore, it was necessary to pool detections from multiple receiver sites in specific regions of the study area to create regional detection “gates” that were used to describe movement patterns in study reaches. Our analysis of detection records in the lower Sacramento River included sites on the main-stem river and in Sutter and Steamboat sloughs (fig. 1; table 3).
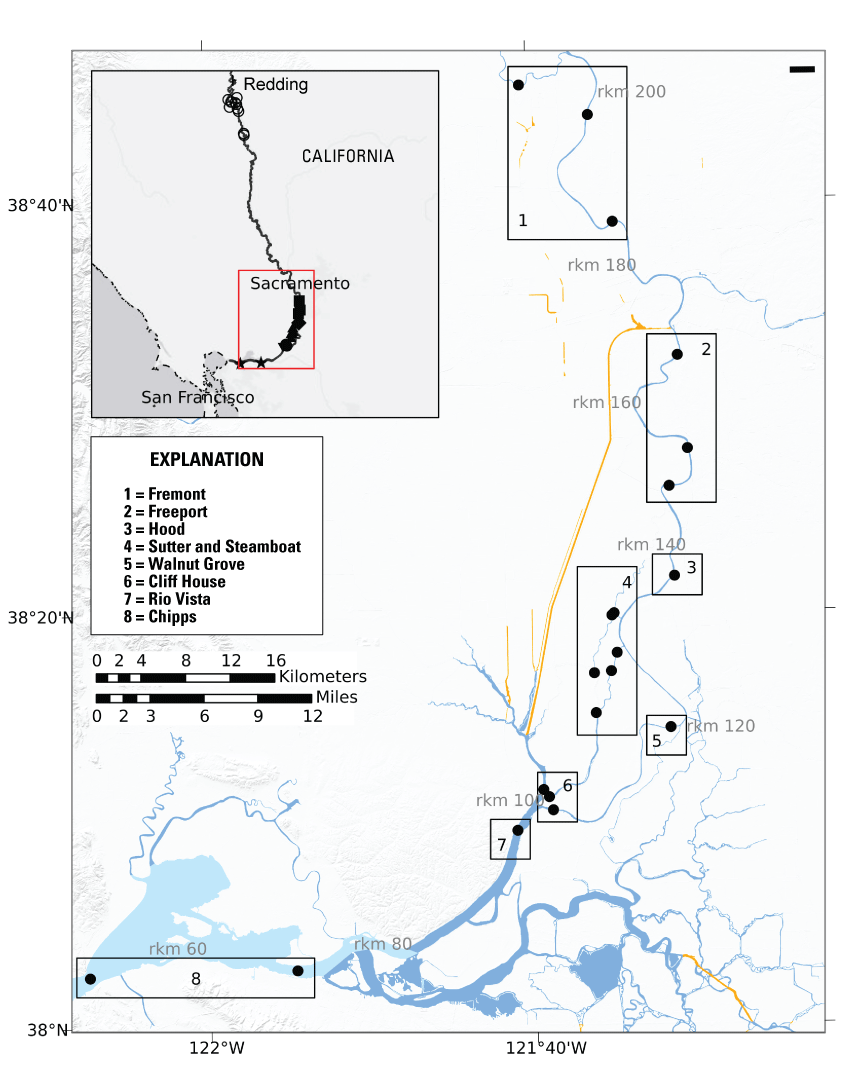
Locations of acoustic telemetry receivers (filled symbols) in the Sacramento River, in California for a study of juvenile green sturgeon (Acipenser medirostris) behavior and movement, 2016–20. Open circles on the upper portion of the inset map are release locations. rkm, river kilometer.
Table 3.
Detection location, river kilometer, and gate assignment during a telemetry study in the lower Sacramento River, California, 2016–20.Regional detection gates were created using sites at major river junctions and other locations of interest which were specified by the USACE. In total, the study area included eight gates, and travel rates are described in the reaches between these gates (table 3). Two main travel routes were possible for tagged sturgeon: fish could either remain entirely in the mainstem Sacramento River while moving downstream or move downstream in the mainstem Sacramento River, into Sutter and Steamboat Sloughs, and then return to the mainstem Sacramento River. A third route included entering Georgiana Slough and the Interior Delta, but only one fish was detected at the upstream end of Georgiana Slough (600 meters [m] from the Sacramento River) and not thereafter so movements via that route are not discussed further. The upstream-most gate in the study area was comprised of four receiver sites located at rkm 167.0, 166.6, 152.4, and 147.6 and labeled Freeport (fig. 1). The second gate was Hood and consisted of one site at rkm 138.2 (fig. 1). The third gate was Walnut Grove, which was located just downstream from the junction to Georgiana Slough, near the town of Walnut Grove: two receivers in this gate were located at rkm 119.1 and 118.4 (fig. 1). The Cliff House gate consisted of three sites located upstream from the junction of the Sacramento River (rkm 101.5), Cache Slough (rkm 107.5), and the downstream end of Sutter and Steamboat Sloughs (rkm 111.8; fig. 1). The next gate (Rio Vista) was comprised of two sites at Rio Vista at rkm 97.9 and 97.5 (fig. 1). The most downstream gate was near Chipps Island and consisted of three sites located at rkm 71.7, 71.2, and 52.2 (fig. 1). Fish that left the Sacramento River (either downstream from Freeport or downstream from Hood) and entered Sutter and Steamboat Sloughs (Sutter Steam) could be detected at six sites which were located at rkm 131.0, 130.4, 128.4, 126.6, 124.6, and 121.9 (fig. 1). Fish moving downstream from Sutter Steam returned to the Sacramento River at Cliff House.
The number of receivers deployed in each gate varied within and across years (figs. 2–5). Receivers in the Freeport and Chipps gates were generally deployed earliest in most study years. Study years 2016–17 and 2017–18 had the greatest amount of receiver coverage within the study period (figs. 2–3). In 2018–19 and 2019–20, several gates were not deployed during much of the study period, especially during October–January. Hood and Sutter Steam were deployed 1–2 months after the first fish releases in both study years and the Cliff House gate was not installed in either year (figs. 4–5). Rio Vista was deployed in the middle of February 2019 during the 2018–19 study period and in December of the 2019–20 study period (figs. 4–5).
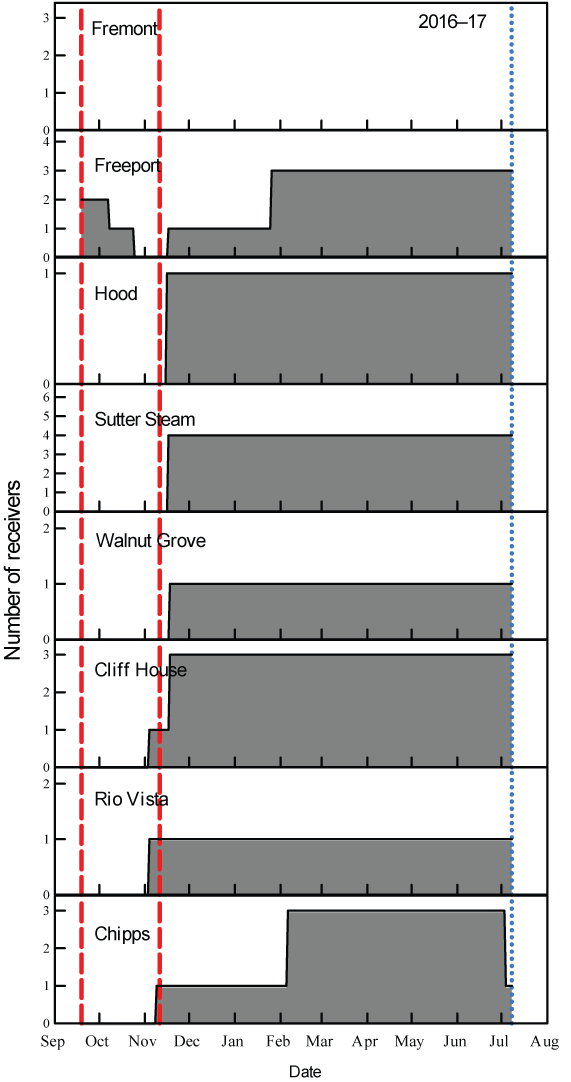
Number of acoustic receivers deployed at each gate by date, 2016–17, with the maximum number on each vertical axis representing the number of receivers available for analysis. Dashed red vertical lines are the first and last release dates of acoustic-tagged green sturgeon (Acipenser medirostris) and the dotted blue vertical line is the maximum expected life of acoustic transmitters in the study period.
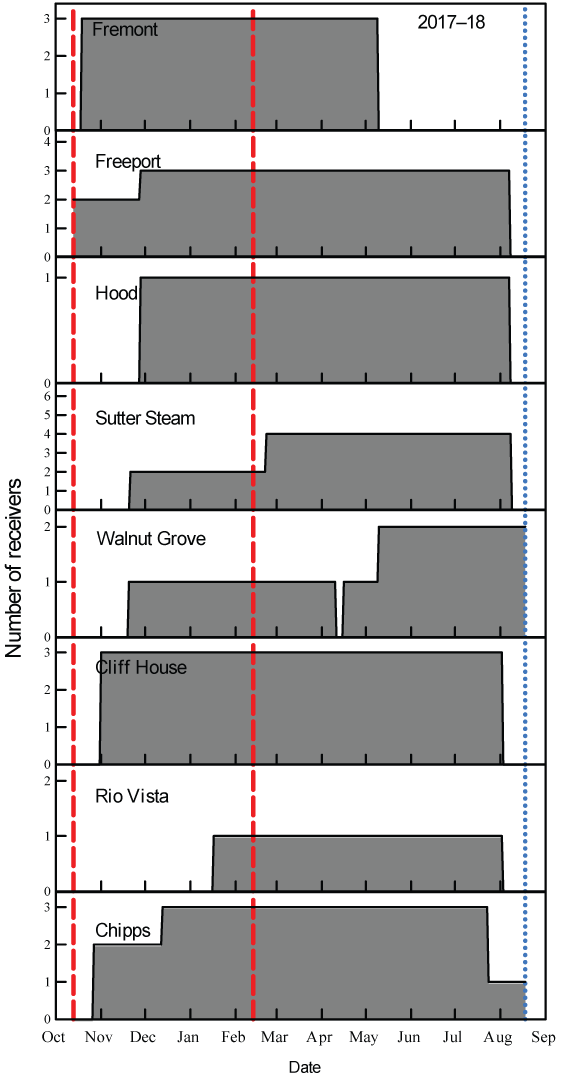
Number of acoustic receivers deployed at each gate by date, 2017–18, with the maximum number on each vertical axis representing the number of receivers available for analysis. Dashed red vertical lines are the first and last release dates of acoustic-tagged green sturgeon (Acipenser medirostris) and the dotted blue vertical line is the maximum expected life of acoustic transmitters in the study period.
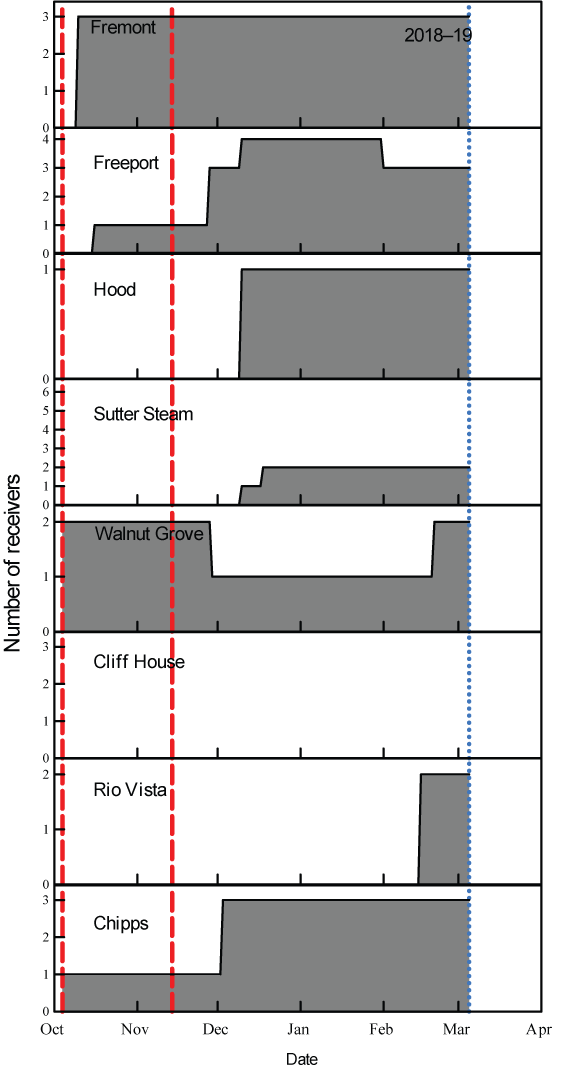
Number of acoustic receivers deployed at each gate by date, 2018–19, with the maximum number on each vertical axis representing the number of receivers available for analysis. Dashed red vertical lines are the first and last release dates of acoustic-tagged green sturgeon (Acipenser medirostris) and the dotted blue vertical line is the maximum expected life of acoustic transmitters in the study period.
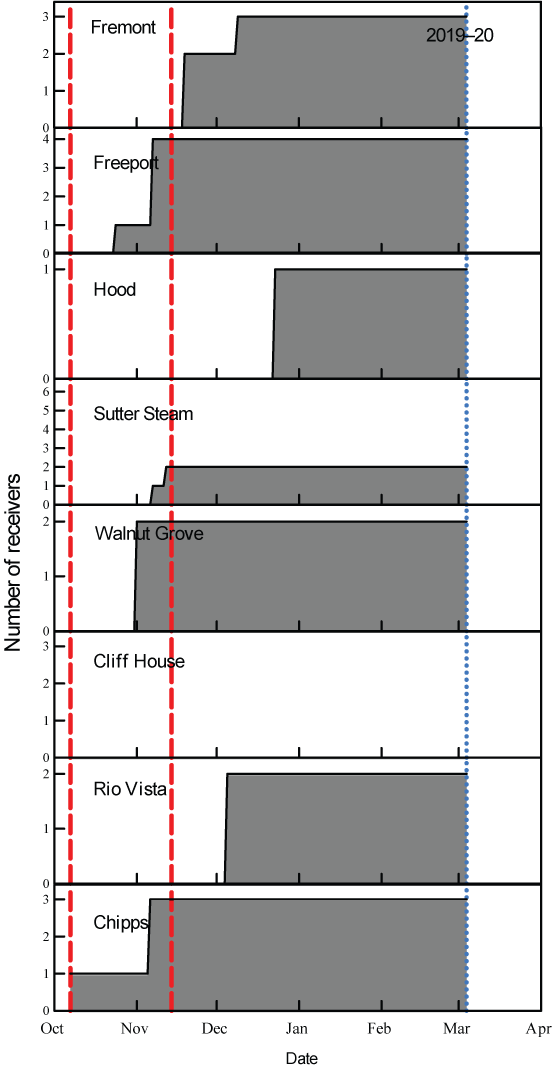
Number of acoustic receivers deployed at each gate by date, 2019–20, with the maximum number on each vertical axis representing the number of receivers available for analysis. Dashed red vertical lines are the first and last release dates of acoustic-tagged green sturgeon (Acipenser medirostris) and the dotted blue vertical line is the maximum expected life of acoustic transmitters in the study period.
Data Analysis
Mean daily Sacramento River flow data for the Freeport streamgage (11447650) were downloaded from the U.S. Geological Survey National Water Information System database (U.S. Geological Survey, 2021). These data were merged with telemetry detection records (release, receiver deployment, and receiver detections). False positives in the detection data were identified and removed through a series of filters (see supplementary information in Deng and others, 2017). Tagging and release data were summarized by month and year and merged with river flow data and receiver detection records to create a dataset for analysis.
Data management and descriptive summaries were run in RStudio (R Core Team, 2021; RStudio Team 2021) and SAS (version 9.4, SAS Institute Inc., Cary, North Carolina). Travel times were calculated as the elapsed time (in days) between the last detection at a detection gate and the first detection at the next downstream gate. Travel rates were calculated as the reach length divided by the travel time. Travel rates were plotted against the mean river flow experienced by each fish between the first and last detections in a reach. We also examined residence time at each site and assessed for upstream movements by tagged individuals. Residence time at each site was calculated by subtracting the last detection of a tagged fish from the first detection of that same fish at a given site. The dataset was queried to determine if tagged fish were detected at an upstream site after previously being detected on a site located farther downstream. If the residence time was interrupted by detections at another gate or a lapse in detections of at least 24 hours, we assigned it as a new trip and a new residence time was calculated.
Results
During each study year, flows were at base levels (less than 550 cubic meters per second [m3/s]) during October–November when collection and tagging began (fig. 6). River flow increased for short periods due to seasonal precipitation and snow melt events that occurred during late November–May, and in some cases these flow peaks were large and persisted for long time periods (fig. 6). Substantial variability was observed between study years and included wet (2016–17, 2018–19), below normal (2017–18), and dry (2019–20) water years. 2016–17 was the highest flow year as flows exceeded 1,500 m3/s on 72.1 percent of the days between December 1, 2016, and May 1, 2017. 2019–20 was a low-flow year; maximum daily flow occurred on January 29, 2020, at 693.8 m3/s. 2017–2018 and 2018–2019 were intermediate flow years which included several flow peaks that exceeded 1,500 m3/s (fig. 6).
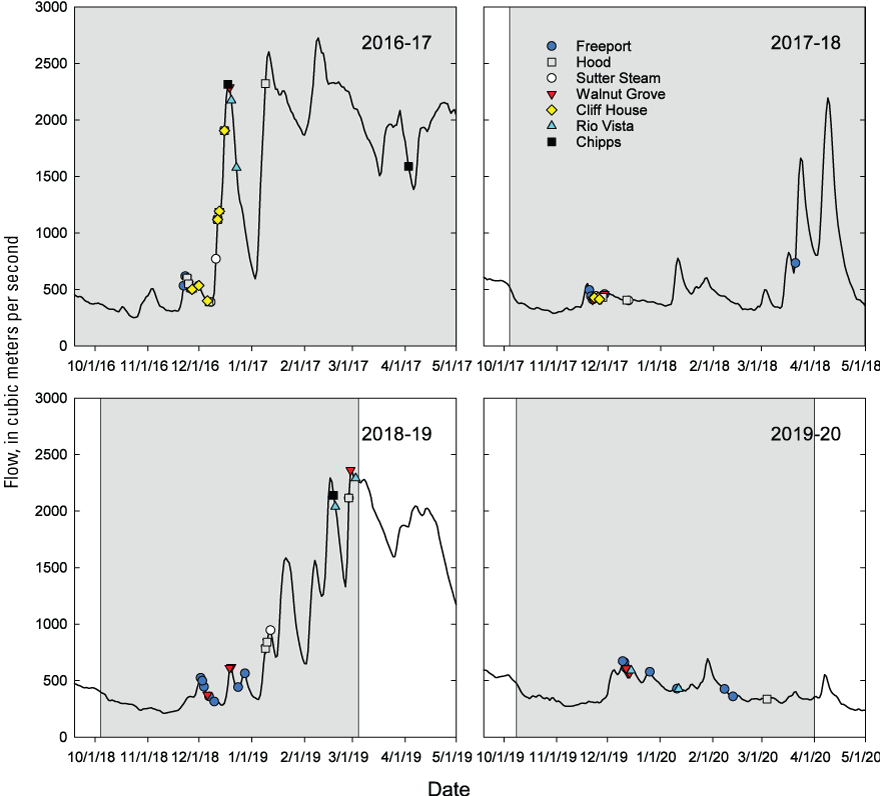
First arrival date of individually acoustic tagged juvenile green sturgeon (Acipenser medirostris) at each gate and corresponding mean daily Sacramento River flow (solid black line), September 9 to May 1. Gray shading indicates each study period from first release to the maximum expected life of acoustic transmitters in the study period. Flow data are from the U.S. Geological Survey streamgage at Freeport on the Sacramento River (streamgage 11447650).
A total of 46 percent of tagged juvenile green sturgeon were detected in the lower Sacramento River study area during 2016–20. Fish released in 2016–17 had the highest detection (95 percent) whereas the lowest occurred in 2017–18 (24 percent; table 4). In 2018–19, and 2019–20, 78 percent of the tagged fish and 53 percent of the tagged fish were detected, respectively, in the lower Sacramento River (table 4). The greatest percentage of fish detections occurred at upriver gates (81 percent at Freeport; 50 percent at Walnut Grove), whereas few fish were detected in Sutter and Steamboat sloughs (n=6; 6 percent). Tagged fish were not detected at the Freeport gate until late November or early December each year (fig. 6), and most arrivals at each gate (96 percent) occurred prior to January. Three fish were detected at Chipps during the entire study period (table 4).
Table 4.
Number of acoustic tagged juvenile green sturgeon (Acipenser medirostris) released and detected at each gate by study year, 2016–20.[Receivers were not deployed at the Cliff House gate during 2018–20. Abbreviation: ND, not deployed]
Tagged fish that moved downstream had relatively short travel times between detection gates, and residence times at individual sites were low. Median travel times were less than two days between most gates, with longer travel times observed between Freeport and Hood in 2017–18 (4.6 days [d]), Sutter Steam and Rio Vista in 2016–17 (4.7 d), Walnut Grove and Rio Vista in 2016–17 (8.9 d), 2018–19 (63.0 d), and 2019–20 (17.1 d), and Rio Vista and Chipps in 2016–17 (5.3 d; table 5). Median travel rates were faster in the upper reaches than the lower reaches in most years (table 5). During the multi-year study, 79.2 percent of tagged fish arrived at detection gates within 4 days of a flow peak (fig. 6). Relatively modest flow increases of 51.0 m3/s (1,800 cubic feet per second [ft3/s]) in late November 2016 and 68.0 m3/s (2,400 ft3/s) in December 2019 corresponded with substantial fish movement (fig. 6). Median travel time in each reach was plotted against mean river flow during the period that tagged fish moved through the reach, which showed evidence of a flow/travel rate relationship (fig. 7). Median residence times at individual monitoring sites were low (less than 1 hour) except at the Highway 84 Ferry (7.2 hours) and Chipps (22.5 hours) sites (table 6).
Table 5.
Median travel time and median travel rate of green sturgeon (Acipenser medirostris) between each of the study reaches in the lower Sacramento River, California, during study years 2016–19.[Abbreviations: km/d, kilometers per day; NA, not applicable]

Travel rate (km/d) of acoustic tagged juvenile green sturgeon (Acipenser medirostris) through reaches in the lower Sacramento River, California. Travel rates are plotted by the mean flow experienced by each fish between the first and last detections in that reach.
Table 6.
Median residence time at individual telemetry monitoring sites for acoustic-tagged juvenile green sturgeon (Acipenser medirostris) during a telemetry study in the lower Sacramento River, California, 2016–20.[Abbreviations: N, number of individual fish]
Several fish exhibited upstream movement within the study area. One tagged sturgeon made two upstream trips between Rio Vista and Cliff House (9.6 rkm) during November 27–30, 2016 and was last detected at Rio Vista. Four fish (three in December of 2016 and one in November–December 2017) were detected in the Sacramento River near the junction with Sutter Steam and Cache Slough and were later detected in Cache Slough, 1.5 rkm upstream from the junction. None of these fish were detected after last detection at Cache Slough.
Discussion
Results from this study provide new information on behavior and movement patterns of juvenile green sturgeon (Acipenser medirostris) in the lower Sacramento River. These findings are substantial because little is known about factors that affect movement and survival of juvenile green sturgeon and their populations, particularly those in the southern distinct population segment (sDPS), which are threatened (National Marine Fisheries Service, 2006). We found that tagged green sturgeon primarily moved downstream in the lower Sacramento River and were detected on fixed monitoring sites during periods of increasing river flow. A noteworthy period of downstream movement was observed in early December during all 4 study years. Minor flow peaks that occurred during this period were associated with a relatively large number of tagged fish moving downstream. Based on this observation, juvenile green sturgeon may initiate downstream movement during the autumn each year and rely on periods of increasing river flow to facilitate migration. Flow peaks that occurred after early December in our study were also associated with detections of tagged fish that moved downstream and, in some cases, those peaks were much larger than those that occurred in early December each year. However, fewer tagged fish were detected during these large flow peaks. This could be due to the relatively small sample sizes in our study each year. Our results suggest that juvenile green sturgeon rely on periods of increased river flow to facilitate downstream movement during autumn and winter months in the Sacramento River, but additional research will be required to better understand population-level responses to increased flow during this period.
Tidal influences greatly affect river flow in the lower portion of our study area, in the reach between Cliff House and Chipps, which likely affects movements of juvenile green sturgeon. In the lower Sacramento River, incoming tides can reverse river flow and result in upstream flows as far upstream as rkm 152 (U.S. Geological Survey, 2016), which has been shown to have substantial effects on migration behavior of several fish species. For example, Perry and others (2015) found a greater probability of an incoming flood tide (when river flow was reversed) affecting juvenile salmon routing in the Interior Delta compared to an outgoing ebb tide. During low flows, more tagged salmon were diverted into the Interior Delta. Juvenile salmon traveling through the Interior Delta tend to have longer travel times and lower survival probabilities than those traveling in the Sacramento River or through Sutter and Steamboat Sloughs (Perry and others, 2010; Perry and others, 2018), so these sloughs may benefit juvenile green sturgeon as well. At low river flows, travel times were considerably longer in tidal reaches than in other reaches in the Sacramento River (Perry and others, 2018). Both the 2017–18 and 2019–20 study periods were below normal or dry water years and had the lowest proportion of fish detected, with no fish detected below Cliff House in 2017–18 or at Chipps in 2019–20. Similarly, in the Columbia River as fish transition from the river to the estuary, juvenile salmon exhibited decreased travel rate (McMichael and others, 2013) suggesting a response due to the effects of tides on downstream river flow. Juvenile green sturgeon likely respond in a similar fashion to tidal influences in the lower Sacramento River. Alternatively, juvenile green sturgeon may not be attempting to exit the estuary immediately. While our sample sizes were small, tagged sturgeon spent up to two months in the lower Sacramento River and the only upstream movements documented in this study were in this lower region. Whereas the juvenile green sturgeon were at least twice as large as those in our study, Miller and others (2020) found tagged juvenile fish residing in Suisan Bay (including our Chipps gate) and downstream to the Golden Gate Bridge (rkm 0–78.3) in every month of the year. This year-round presence by juvenile fish supports other research showing they are not actively entering the ocean but stopping to rear and feed (Miller and others, 2020). Additional monitoring in the lower Sacramento River and increased numbers of tagged green sturgeon and additional acoustic arrays in strategic locations in future studies will be required to better understand fish movement patterns in this reach. This has also been identified in the Green Sturgeon Habitat Mitigation Monitoring Plan (U.S. Army Corps of Engineers, 2021).
Detections of tagged green sturgeon were limited at gates in the lower portion of our study area which could be due to several factors. It is possible that tagged fish experienced substantial mortality while moving downstream, although Baird and others (2020) showed limited predation of this size class of sturgeon. Previous studies of juvenile salmon in the Sacramento River have shown that decreased flow, outmigration period, increased travel time, entrainment into water diversions, predation, and other factors have resulted in substantial mortality (Perry and others, 2013; Henderson and others, 2019; Michel, 2019; Michel and others, 2020). Our study had shortcomings that prevented us from estimating survival. For example, the detection monitoring was incomplete. The Freeport gate was operational for 94 percent of the study period but missed seven fish (39 percent) in 2016–17 that were later detected downstream. Most of the other sites were operational for a shorter percentage of the study period, some beginning 2 months after the first fish release and may have missed migrating fish. The longer pulse rate interval (PRI) of the acoustic tag used in green sturgeon may also have reduced the detections. While detection probability of a transmitter with a shorter PRI (5 seconds; often used in the juvenile salmon studies) was less than 84 percent at the Hood gate in July of 2019 (Ammann, 2020), a longer PRI means tagged fish may be missed at a detection area or additional receivers monitoring the area are needed to bolster detection probability. Several fish were detected at acoustic sites near the end of the tag life, suggesting a longer life tag may have allowed for additional detections. Only 1 of the 5 prototype sturgeon transmitters with an expected tag life of 279 days was detected in the study area. This fish was detected at Chipps at 154 days after release, information that would not have been captured with a shorter tag life. Other fish were detected at Freeport and Hood late in the study periods (mid-February and March), so it is likely that some green sturgeon moved downstream through the study area after their transmitter had expired and thus went undetected.
Juvenile salmon studies provide critical information to resource managers in the Sacramento River Basin (Perry, 2010; Perry and others, 2010; Michel and others, 2015, 202116; Notch and others, 2020, 202121), and are likely to occur for many years. The infrastructure for these studies can be used to substantially increase the current state-of-knowledge on juvenile green sturgeon behavior and survival in the system. New developments in acoustic transmitter technology can provide smaller, lighter transmitters with longer tag life thereby reducing tag burden and allowing a greater proportion of the run to be monitored while the transmitters are active. Efforts could focus on coordinating telemetry receiver deployments to ensure that key monitoring sites are in place and fully functional when tagged green sturgeon are released. Studies of juvenile green sturgeon will benefit from using transmitters with the longest possible operating life. Operating life is a function of battery capabilities and PRI; if relatively long PRIs are required to achieve long operating life, then additional receivers may be necessary at specific gates to ensure that sufficient detection capabilities are in place. Given the lack of information on early life history aspects of juvenile green sturgeon and the perilous state of their populations, continued research will be critical to protect and restore this species.
This study described a link between fish movement and river flow as well as extended residence time in the lower Sacramento River, especially downstream from the confluence of the Sutter and Steamboat Sloughs, Cache Slough, and the Sacramento River (Cliff House gate). Fish movements were focused in the winter months but continued into the spring as tag batteries died. Few fish were detected at the lower detection sites described (rkm 61, 54, 45, and 32) and no fish were detected at the Golden Gate Bridge, suggesting 140–300 mm green sturgeon remain in the lower Delta during the winter and spring. Further studies will enhance the knowledge of juvenile green sturgeon movements and rearing in the lower Sacramento River system.
References Cited
Deng, Z.D., Martinez, J.J., Li, H., Harnish, R.A., Woodley, C.M., Hughes, J.A., Li, X., Fu, T., Lu, J., McMichael, G.A., Weiland, M.A., Eppard, M.B., Skalski, J.R., and Townsend, R.L., 2017, Comparing the survival rate of juvenile Chinook salmon migrating through hydropower systems using injectable and surgical acoustic transmitters: Scientific Reports, v. 7, no. 1, 8 p.
Gruber, J.J., Poytress, W.R., Praetorius, C.E., and Ryan, D.J., 2017, 2014 and 2015 juvenile green sturgeon capture feasibility study—Technical report by the Red Bluff Fish and Wildlife Office, Anadromous Fish Restoration Program: Red Bluff, California, U.S. Fish and Wildlife Service, accessed October 3, 2022, at https://www.researchgate.net/profile/William-Poytress/publication/314172043_2014_and_2015_Juvenile_Green_Sturgeon_Capture_Feasibility_Study/links/58b836fdaca27261e51cd38d/2014-and-2015-Juvenile-Green-Sturgeon-Capture-Feasibility-Study.pdf.
Heublein, J., Bellmer, R., Chase, R.D., Doukakis, P., Gingras, M., Hampton, D., Israel, J.A., Jackson, Z.J., Johnson, R.C., Olaf, L.P., Luis, S., Mora, E., Moser, M.L., Rohrbach, L., Seesholtz, A.M., and Sommer, T., 2017, Improved fisheries management through life stage monitoring—The case for the southern distinct population segment of North American green sturgeon and the Sacramento-San Joaquin River white sturgeon: NOAA Technical Memorandum NMFS, accessed September 17, 2021, at https://doi.org/10.7289/V5/TM-SWFSC-588.
Liss, S.A., Ashton, N.K., Brown, R.S., Walker, R.W., Bates, P., Klassen, C., and Backhouse, S., 2017, Evaluation of four surgical implantation techniques for age-0 white sturgeon (Acipenser transmontanus Richardson, 1836) with a new acoustic transmitter: Journal of Applied Ichthyology, v. 34, no. 2, p. 382–389, accessed November 17, 2021, at https://onlinelibrary.wiley.com/doi/pdf/10.1111/jai.13564.
Lu, J., Deng, Z.D., Li, H., Myjak, M.J., Martinez, J.J., Xiao, J., Brown, R.S., and Carmell, S.S., 2016, A small long-life acoustic transmitter for studying the behavior of aquatic animals: The Review of Scientific Instruments, v. 87, no. 11, p. 114902, accessed November 18, 2021, at https://aip.scitation.org/doi/full/10.1063/1.4967941.
McMichael, G.A., Hanson, A.C., Harnish, R.A., and Trott, D.M., 2013, Juvenile salmonid migratory behavior at the mouth of the Columbia River and within the plume: Animal Biotelemetry, v. 1, no. 14, 17 p., https://doi.org/10.1186/2050-3385-1-14.
Michel, C.J., Ammann, A.J., Chapman, E.D., Sandstrom, P.T., Fish, H.E., Thomas, M.J., Singer, G.P., Lindley, S.T., Klimley, A.P., and MacFarlane, R.B., 2013, The effects of environmental factors on the migratory movement patterns of Sacramento River yearling late-fall run Chinook salmon (Oncorhynchus tshawytscha): Environmental Biology of Fishes, v. 96, no. 2-3, p. 257–271.
Michel, C.J., Ammann, A.J., Lindley, S.T., Sandstrom, P.T., Chapman, E.D., Thomas, M.J., Singer, G.P., Klimley, A.P., and MacFarlane, R.B., 2015, Chinook salmon outmigration survival in wet and dry years in California’s Sacramento River: Canadian Journal of Fisheries and Aquatic Sciences, v. 72, no. 11, p. 1749–1759.
Miller, E.A., Singer, G.P., Peterson, M.L., Chapman, E.D., Johnston, M.E., Thomas, M.J., Battleson, R.D., Gingras, M., and Klimley, A.P., 2020, Spatio-temporal distribution of green sturgeon (Acipenser medirostris) and white sturgeon (A. transmontanus) in the San Francisco Estuary and Sacramento River, California: Environmental Biology of Fishes, v. 103, no. 5, p. 577–603, accessed January 7, 2022, at https://doi.org/10.1007/s10641-020-00972-x.
Notch, J.J., McHuron, A.S., Michel, C.J., Cordoleani, F., Johnson, M., Henderson, M.J., and Ammann, A.J., 2020, Outmigration survival of wild Chinook salmon smolts through the Sacramento River during historic drought and high water conditions: Environmental Biology of Fishes, v. 103, no. 5, p. 561–576.
Notch, J., Robinson, R., Pham, T., Logston, R., McHuron, A., Ammann, A., and Michel, C., 2021, Enhanced acoustic tagging, analysis, and real-time monitoring of wild and hatchery salmonids in the Sacramento River Valley, 2018–2020 Final Report: Report prepared by University of California, Santa Cruz for the U.S. Bureau of Reclamation under contract USDI/BOR# R18AC00039, https://oceanview.pfeg.noaa.gov/CalFishTrack/.
Perry, R.W., 2010, Survival and migration dynamics of juvenile Chinook salmon (Oncorhynchus tshawytscha) in the Sacramento-San Joaquin River Delta: Dissertation, University of Washington, accessed October 3, 2022, at https://citeseerx.ist.psu.edu/viewdoc/download?doi=10.1.1.386.1694&rep=rep1&type=pdf.
Perry, R.W., Brandes, P.L., Burau, J.R., Klimley, A.P., MacFarlane, B., Michel, C., and Skalski, J.R., 2013, Sensitivity of survival to migration routes used by juvenile Chinook salmon to negotiate the Sacramento–San Joaquin River Delta: Environmental Biology of Fishes, v. 96, nos., 2–3, p. 381–392, https://doi.org/10.1007/s10641-012-9984-6.
Perry, R.W., Pope, A.C., Romine, J.G., Brandes, P.L., Burau, J.R., Blake, A.R., Ammann, A.J., and Michel, C.J., 2018, Flow-mediated effects on travel time, routing, and survival of juvenile Chinook salmon in a spatially complex, tidally forced river delta: Canadian Journal of Fisheries and Aquatic Sciences, v. 75, no. 11, p. 1886–1901.
Perry, R.W., Skalski, J.R., Brandes, P.L., Sandstrom, P.T., Klimley, A.P., Ammann, A., and MacFarlane, B., 2010, Estimating survival and migration route probabilities of juvenile Chinook salmon in the Sacramento-San Joaquin River Delta: North American Journal of Fisheries Management, v. 30, no. 1, p. 142–156.
R Core Team, 2021, R: A language and environment for statistical computing: R Foundation for Statistical Computing, Vienna, Austria, https://www.R-project.org/.
RStudio Team, 2021, RStudio: Integrated Development Environment for R. RStudio, PBC, Boston, Massachusetts, https://www.rstudio.com/.
U.S. Army Corps of Engineers, 2021, Green sturgeon habitat mitigation and monitoring plan—U.S. Army Corps of Engineers: Sacramento, California, Sacramento District, https://www.spk.usace.army.mil/Media/USACE-Project-Public-Notices/.
U.S. Geological Survey, 2021, USGS 11447650 Sacramento River at Freeport, CA, in USGS water data for the Nation: U.S. Geological Survey National Water Information System database, accessed October 7, 2020, at https://doi.org/10.5066/F7P55KJN. [Site information directly accessible at https://waterdata.usgs.gov/nwis/uv?site_no=11447650.]
U.S. Geological Survey, 2016, Innovation in monitoring: The U.S. Geological Survey Sacramento-San Joaquin River Delta, California, Flow-Station Network, ver. 3.5.1, accessed December 29, 2021, at https://doi.org/10.3133/fs20153061.
Conversion Factors
For more information about the research in this report, contact
Director, Western Fisheries Research Center
U.S. Geological Survey
6505 NE 65th Street
Seattle, Washington 98115-5016
https://www.usgs.gov/centers/wfrc
Manuscript approved on September 30, 2022
Publishing support provided by the U.S. Geological Survey
Science Publishing Network, Tacoma Publishing Service Center
Suggested Citation
Hansen, A.C., Chase, R.D., Kock, T.J., Perry, R.W., Gruber, J.J., and Poytress, W.R., 2022, Juvenile green sturgeon (Acipenser medirostris) movement during autumn and winter in the lower Sacramento River, California, 2016–20: U.S. Geological Survey Open-File Report 2022–1091, 17 p., https://doi.org/10.3133/ofr20221091.
ISSN: 2331-1258 (online)
Study Area
| Publication type | Report |
|---|---|
| Publication Subtype | USGS Numbered Series |
| Title | Juvenile green sturgeon (Acipenser medirostris) movement during autumn and winter in the lower Sacramento River, California, 2016–20 |
| Series title | Open-File Report |
| Series number | 2022-1091 |
| DOI | 10.3133/ofr20221091 |
| Year Published | 2022 |
| Language | English |
| Publisher | U.S. Geological Survey |
| Publisher location | Reston, VA |
| Contributing office(s) | Western Fisheries Research Center |
| Description | vii, 17 p. |
| Country | United States |
| State | California |
| Other Geospatial | Lower Sacramento River |
| Online Only (Y/N) | Y |
| Google Analytic Metrics | Metrics page |