

Mapping Areas of Groundwater Susceptible to Transient Contamination Events from Rapid Infiltration into Shallow Fractured-Rock Aquifers in Agricultural Regions of the Conterminous United States
Links
- Document: Report (5.64 MB pdf) , HTML , XML
- Download citation as: RIS | Dublin Core
Abstract
Current time-invariant groundwater vulnerability assessments may not capture intermittent contamination events in landscape areas that experience rapid infiltration following precipitation or snowmelt. Occurrences of rapid infiltration and intermittent degradation of groundwater quality are frequently reported in fractured-rock aquifers. This investigation identifies landscape areas underlain by fractured rock within the conterminous United States (CONUS) that may be susceptible to rapid infiltration and where groundwater is a principal source of water supply to the population. Our analysis shows that approximately 27 percent of the CONUS, corresponding to a population of approximately 150 million people, is both underlain by fractured rock and denoted as an area of significant groundwater use.
This investigation identifies areas of rapid infiltration into fractured rock using index values applied to the attributes (1) depth to the water table, (2) depth to bedrock, and (3) percentage of sand in soil, where larger index values indicate a greater susceptibility to rapid infiltration. These attributes are selected as the most likely factors that affect rapid infiltration to the water table. The combination of depth to water table and depth to bedrock highlight those aquifer settings that are characterized as shallow fractured-rock aquifers, where the water table may reside either in the bedrock or in overlying unconsolidated geologic materials. In addition, we consider the percentage of agricultural use as a land-use attribute when formulating an index of susceptibility to rapid infiltration and contamination. Agricultural areas are well recognized as nonpoint sources of contaminants that can affect groundwater quality because of seasonal amendments applied to the land surface. Rural agricultural areas are also characterized by septic tanks and leach fields for onsite treatment of wastewater, which may also be a source of contamination that may be introduced into the groundwater following precipitation or snowmelt events.
The results of this survey identified shallow fractured-rock aquifers underlying glacial sediments in the upper Midwest and northeastern United States as areas that may be subject to rapid infiltration events. Additionally, aquifers associated with the early Mesozoic basins located in the northeastern and mid-Atlantic United States and bands of carbonate aquifers in the southeastern United States show high susceptibility to rapid infiltration. Index values used in this investigation indicate isolated areas in the western half of the United States also show high susceptibility to rapid infiltration. The isolated areas in Oklahoma, Texas, Arkansas, and southwestern Missouri correspond to karst regions of carbonate aquifers. The isolated areas showing high susceptibility to rapid infiltration and contamination from agricultural sources are locations where more detailed investigations of transient contamination events are warranted.
This survey also addresses the potential for contaminant longevity in fractured-rock aquifers stemming from intermittent contamination events. Contaminants that can dissolve into the groundwater following infiltration may be introduced into fractures, and the dissolved constituents can diffuse from fractures into the porosity of the adjacent rock matrix. These constituents can then diffuse back into permeable fractures and adversely affect groundwater quality at downgradient locations over an extended time frame. Rock types with larger matrix porosities have the capacity to retain and then release larger quantities of dissolved constituents, resulting in longer residence times for dissolved groundwater contaminants. The magnitude of the dissolved contaminant concentration infiltrating to the water table will also dictate whether the contaminant concentration in the groundwater exceeds limits for human consumption over the duration of a contamination event.
In general, sedimentary- and carbonate-rock aquifers have larger matrix porosities in comparison to igneous- and metamorphic-rock aquifers, and thus, they are more susceptible to longer contaminant residence times. Aquifers composed of sedimentary or carbonate rock constitute approximately 51 percent of the CONUS, and 19 percent of the CONUS is associated with sedimentary- or carbonate-rock aquifers that are of significance for groundwater use. Depending on the contaminants of concern and the concentration of the contaminants introduced into the groundwater from infiltrating water, it would be beneficial for investigations of susceptibility to rapid infiltration to also consider the potential for contaminant longevity.
Introduction
During the past several decades, assessments of drinking-water vulnerability have used guidance provided by the U.S. Environmental Protection Agency (EPA; 1997). Over this time frame, assessments of groundwater resources have evolved from investigations of wellhead protection (EPA, 1994) to more comprehensive and spatially extensive surveys relating hydrogeologic and landscape attributes, land use, and the occurrence of naturally occurring and anthropogenic contaminants as factors affecting the potential for groundwater contamination (Aller and others, 1985; Rupert, 1999).
Current methods of assessing groundwater vulnerability to contamination broadly fall into three categories: (1) index and overlay methods, (2) statistical and regression analyses, and (3) application of process-based models (National Research Council, 1993; Focazio and others, 2002). Index and overlay methods are developed from geospatial information, where attributes of land use, hydrogeology, geochemistry, and various landscape features are assigned index values that are scaled according to the anticipated impact on the occurrence of contamination. However, the underlying map products used in index methods are infrequently updated, and thus the resulting vulnerability assessments are likely to be time-invariant.
Whereas assigning indices to landscape and other attributes cannot fully capture physical and chemical processes affecting contaminant occurrence and the relative significance of the selected attributes, statistical and regression methods attempt to define the probability of exceeding threshold concentrations of target constituents as a function of landscape, hydrogeologic, and other spatial factors (Squillace and Moran, 2000; Nolan and others, 2002). Similar to index methods, statistical and regression analyses also tend to be static in time. The underlying geochemical information at monitoring locations that forms the basis of these analyses may only be infrequently collected, and thus vulnerability assessments are based only on a snapshot of geochemical conditions or maximum concentrations, regardless of when those geochemical conditions occurred.
The static nature of these groundwater assessment methods sometimes belies the transient nature of land-use conditions and meteorological events that may result in contaminants being intermittently introduced into the groundwater. While it is widely expected that there are combinations of hydrogeologic conditions and land use that render regions of aquifers continuously susceptible to contamination, as well as circumstances where aquifer conditions are unlikely to ever be affected by contaminants in recharged water, there are also scenarios where meteorological events coupled with land use and hydrogeologic conditions lead to transiently occurring contamination events. For example, in agricultural areas, manure, fertilizers, and other amendments applied to the land surface during parts of the year can be mobilized to the groundwater depending on the occurrence of extended periods of above average precipitation, extreme precipitation events or climatic conditions that rapidly apply water at the land surface, including conditions such as spring snowmelt or flooding (Newman and McGroarty, 2019). These events can lead to rapid infiltration through the soil and the unsaturated zone to the water table, such that the natural filtration capacity of near-surface unconsolidated geologic materials may not be sufficient to retard and transform contaminants and pathogens.
Rapid infiltration into shallow fractured-rock aquifers that are overlain by a thin cover of unconsolidated geologic materials has been well documented (Gburek and Folmar, 1999; Gleeson and others, 2009; Miles and Novakowski, 2016). In aquifers characterized by highly permeable and spatially extensive fractures, water infiltrating to the water table carrying surface contaminants and pathogens can migrate rapidly through permeable fractures to locations where groundwater is withdrawn from public or private wells. Instances of disease-causing microorganisms being introduced into the groundwater following precipitation events have been documented in fractured-rock aquifers and discussed by Hrudey and others (2003), Muldoon and others (2018), Newman and McGroarty (2019), Owens and others (2019), and Murphy and others (2020). Many of these events have occurred in areas of glaciated terrane in the northern United States and southern Canada that are characterized by a thin veneer of unconsolidated sediments overlying sedimentary and carbonate rock aquifers in which private and public-supply wells are completed because of their shallow depth and high permeability. In some instances, contamination events in these areas have led to severe illnesses and death from exposure to the groundwater (Hrudey and others, 2003), and jurisdictions have placed restrictions on dates when manure and other agricultural amendments can be applied, mostly in the spring season, so as not to coincide with time frames that are conducive to rapid infiltration (Czymmek and others, 2011; Liu and others, 2018). However, the institutional controls that are intended to limit human exposure to potential groundwater contaminants cannot always capture the susceptibility to groundwater contamination from changing meteorological and hydrologic conditions throughout the calendar year.
Areas supplied by public or private groundwater wells that are affected by intermittent contamination events may or may not be captured under existing time-invariant groundwater vulnerability assessments. If results from these assessments raise concern about the susceptibility to contamination, the static nature of index methods and statistical assessments are unable to provide a real-time warning as to the susceptibility to contamination based on current conditions.
Physical-process models that characterize the fate and transport of contaminants and pathogens have the capacity to consider both time-varying chemical inputs and meteorological events to assess potential time-varying contamination in groundwater (Holtschlag and Luukkonen, 1997; Masterson and Walter, 2000). To our knowledge, however, such models have not been applied to address intermittent contamination following precipitation events and the forecasting of potential contamination events based on future meteorological conditions. Instead, these models have been used primarily to define groundwater capture zones based on long-term average or average seasonal recharge conditions. Recently, Tiedeman and Shapiro (2022) used groundwater flow and particle tracking models to demonstrate that water infiltrating to the water table following extreme precipitation events can rapidly reach private domestic wells within hours, and areas contributing to the wells vary over the duration of the precipitation event and a cyclic pumping schedule commonly associated with private domestic wells. However, applying process-based models to specific field scenarios is computationally demanding and requires the detailed spatial characterization of physical and chemical parameters. This usually limits the spatial extent to which these models can be applied and may also increase the uncertainty of model outcomes because of the associated uncertainty in the model parameterization.
Although the groundwater vulnerability assessments usually rely on occurrences of particulate, microbial, and chemical indicators, those data are not readily available or are expensive or impractical to collect as continuous time-series records that are necessary to evaluate responses to individual precipitation events over large areas of the landscape. As an alternative, Shapiro and Day-Lewis (2021) and Shapiro and others (2022) discuss quantifying time-varying groundwater recharge using the more economic and more spatially abundant measurements of water-table responses to recharge events, where time-varying groundwater recharge can potentially act as a surrogate in developing indicators for evaluating time-varying groundwater vulnerability. There would still be a need to correlate time-varying groundwater recharge and water-quality indicators, but that could be conducted on a select number of wells to screen areas for more detailed vulnerability assessments using water-quality indicators. In addition, a forecasting capability to project time-varying groundwater recharge based on current conditions and near-term forecasts of meteorological conditions would benefit communities in those areas where groundwater quality is intermittently degraded following intense precipitation events.
Prior to applying process-based transport models, methods described by Shapiro and Day-Lewis (2021), or other means of assessing time-varying susceptibility to groundwater contamination, it is first necessary to identify landscape areas having features that can potentially yield rapid infiltration to the water table. Although rapid infiltration to the groundwater table in unconsolidated porous media aquifers can occur, the large porosity associated with such aquifer materials would generally reduce the groundwater velocity and the distance that contaminants may ultimately travel from areas of groundwater recharge. Additionally, aquifers composed of granular porous materials tend to be more effective in filtering pathogens and particulate contaminants, and the surface area of these geologic materials also promotes the retention of selected contaminants. In contrast, fractured-rock aquifers are characterized by highly permeable fractures and by a small effective fracture porosity. Consequently, rapidly infiltrating water can advect significant distances from locations of groundwater recharge to points of groundwater withdrawals. Additionally, physical dimensions of fracture apertures are more conducive to the transport of particulate contaminants and pathogens in the subsurface.
The purpose of this study is to survey the CONUS and identify those areas underlain by shallow fractured-rock aquifers, where groundwater is a source of drinking water from community or private wells, and where hydrologic, geologic, and other landscape attributes may lead to rapid infiltration. Selected hydrologic and geologic attributes and land-use characteristics are used and combined to identify areas of the CONUS that may be susceptible to rapid infiltration to underlying shallow fractured-rock aquifers following extreme precipitation events or spring snowmelt. Numerical indices applied to landscape attributes are used to arrive at an index of susceptibility associated with each attribute. These indices are combined and used to create maps of susceptibility to rapid infiltration. Our development of a susceptibility index is not intended as a quantitative assessment of rapid infiltration to underlying fractured-rock aquifers. Instead, it is intended as a qualitative survey of landscape areas that may warrant more robust local investigations of hydrogeologic and geochemical conditions that are indicative of rapid infiltration and intermittent groundwater contamination events.
As per the definitions of groundwater susceptibility and vulnerability discussed in Focazio and others (2002), we use the term susceptibility when describing the maps produced in this investigation, as we are not considering the potential for groundwater contamination from specific contaminant sources. Instead, we are considering the landscape and hydrogeologic attributes that may result in contamination if various target contaminants are present during rapid infiltration events. Included in our investigation is a spatial attribute characterizing agricultural land use. Various contaminants can be attributed to agricultural practices; however, we do not include chemical attributes of specific contaminants or data on the presence of microbes in groundwater in our analyses. Thus, maps from our investigation address susceptibility to contamination in agricultural areas. Furthermore, the susceptibility indices illustrated on maps in this report are not intended to represent current contamination or the potential for future contamination events. Instead, is the results of this investigation are intended to provide guidance in selecting areas of the CONUS where more detailed investigations of groundwater vulnerability from rapid infiltration events in shallow fractured-rock aquifers are warranted.
Areas Underlain by Fractured Rock
When surveying shallow fractured-rock aquifers in the conterminous United States (CONUS) that are potentially susceptible to rapid infiltration from extreme precipitation events or spring snowmelt, areas underlain by fractured rock must first be identified. Areas of the CONUS underlain by fractured rock are drawn from data coverages defining the principal aquifers (PAs) (U.S. Geological Survey [USGS], 2003) and secondary hydrogeologic regions (SHRs) (Belitz and others, 2018) of the United States. Included in the areal coverage are those PAs defined by USGS (2003) as sandstone aquifers, carbonate-rock aquifers, and igneous- and metamorphic-rock aquifers (fig. 1A). Those PAs in figure 1A that are described as unconsolidated and semiconsolidated sand and gravel aquifers are excluded from this analysis.
Undesignated areas of the CONUS on the PAs map are described as minimally permeable rocks that may contain locally productive aquifers (USGS, 2003). These regions of the CONUS were classified into 69 SHRs by Belitz and others (2019) and grouped according to age, lithology, and geologic or physiographic setting. The classification of SHRs also included reference to the presence or absence of overlying or underlying PAs and (or) presence of overlying unconsolidated glacial materials. The rock lithologies within the SHRs were identified by Belitz and others (2019) as being sedimentary (clastic or carbonate), crystalline (plutonic or metamorphic), or volcanic. All 69 SHRs are included in our designation of areas in the CONUS underlain by fractured rock (fig. 1B).
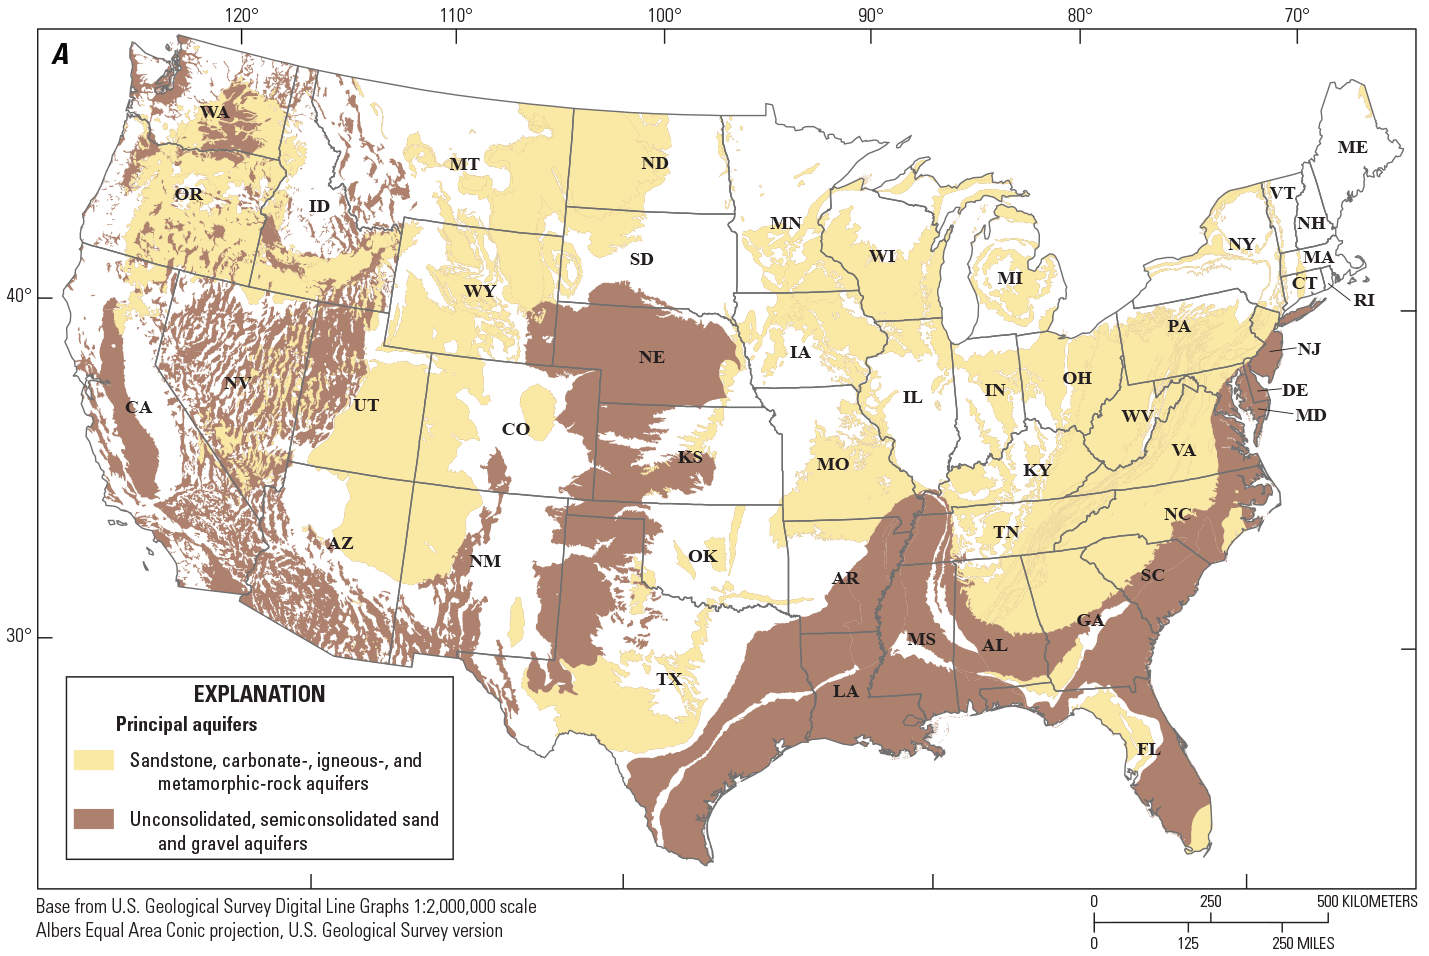
Maps of the conterminous United States showing (A) the principal aquifers underlain by fractured rock as defined in U.S. Geological Survey (2003); beige indicates sandstone, carbonate-, igneous-, and metamorphic-rock aquifers, brown indicates unconsolidated and semiconsolidated sand and gravel aquifers, and white areas denote regions without a principal aquifer; and (B) the secondary hydrogeologic regions as defined by Belitz and others (2019), where white areas denote regions defined by principal aquifers.
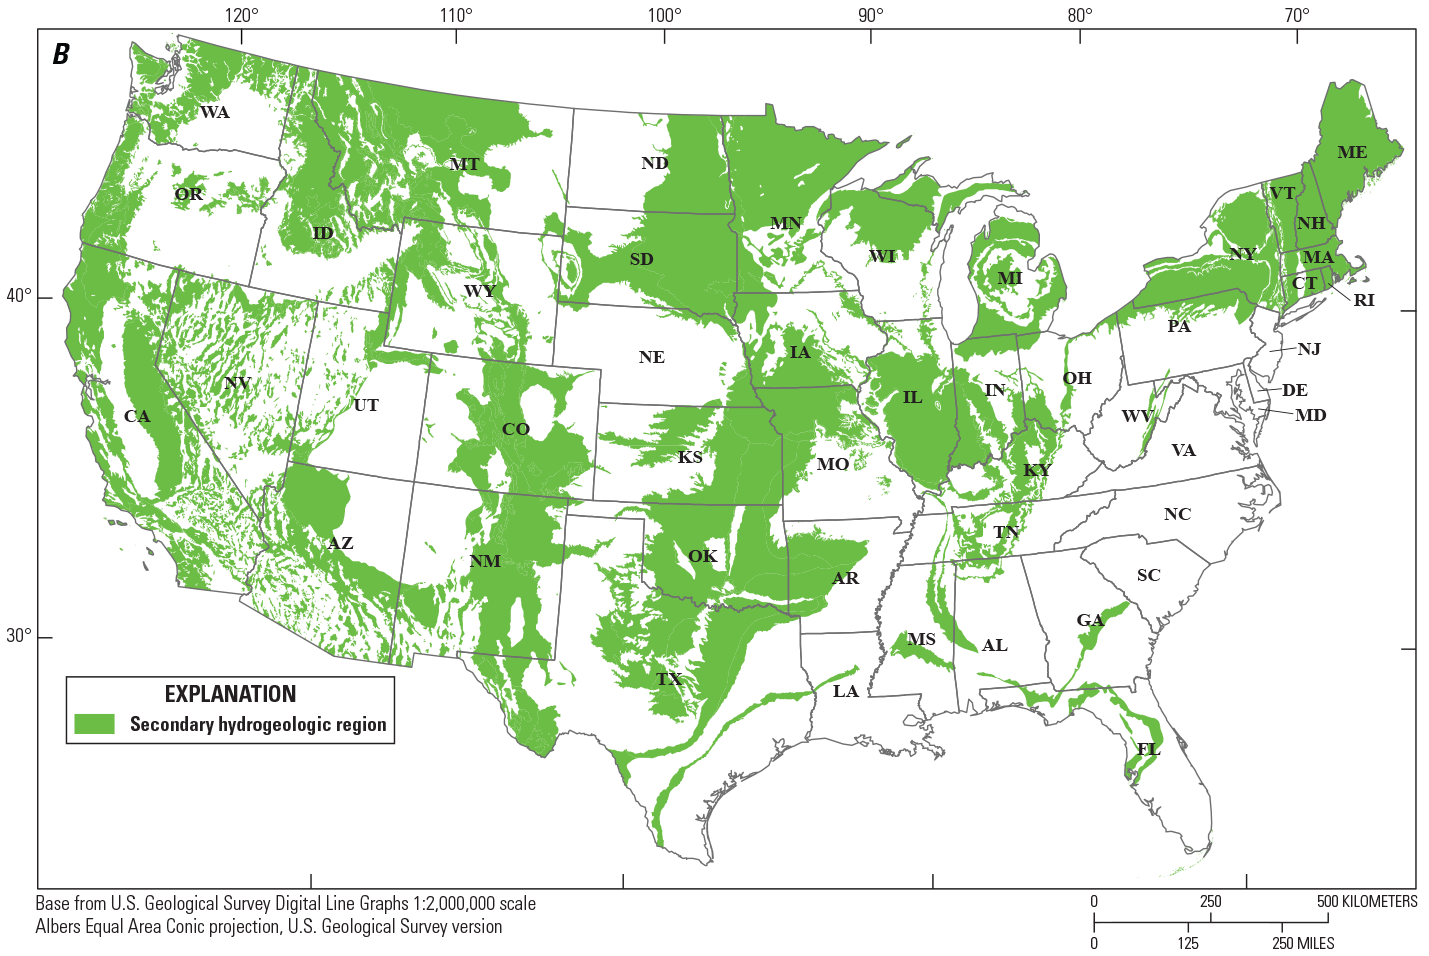
The union of the areas underlain by fractured rock in figure 1A and 1B is shown in figure 2. The highlighted area in figure 2 represents approximately 73 percent of the CONUS. Not all areas highlighted in figure 2 are close to land surface and serve as sources of water supply. Other data resources on groundwater use in the CONUS are used to filter the area shown in figure 2 for consideration in this survey.
Map showing the union of areas underlain by fractured rock defined from principal aquifers (U.S. Geological Survey, 2003) and secondary hydrogeologic regions (Belitz and others, 2019) in the conterminous United States.
Areas of Significant Groundwater Use
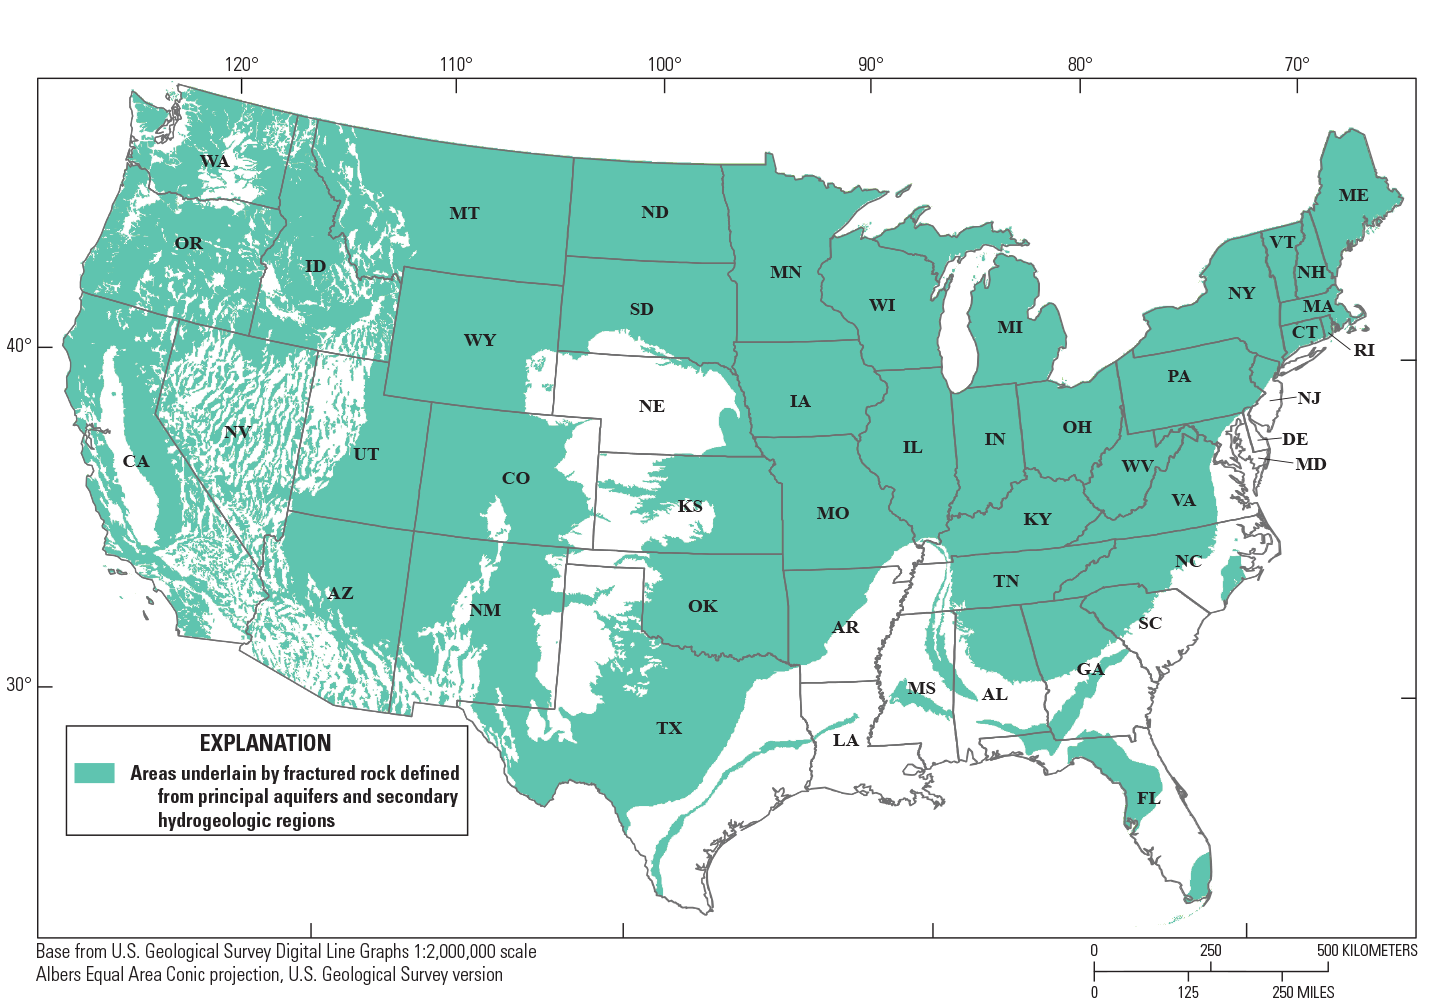
Areas of significant groundwater use in the CONUS are identified from two data sources. Johnson and Belitz (2019) mapped at a 1-kilometer resolution the estimated number of people using private domestic wells, and USGS (2020) provides a map of approximately 147,000 point locations of public supply wells located within Hydrologic Unit Code (HUC) 12 watersheds (U.S. Department of Agriculture, 2017). The range of each of these datasets is divided into quartiles, with values associated with the topmost quartile identified as areas of significant groundwater use. Those areas of significant groundwater use are then applied to the map of areas underlain by fractured rock in the CONUS (fig. 2). The resultant union of areas underlain by fractured rock and areas of significant groundwater use is shown in figure 3, where the highlighted area represents approximately 27 percent of the CONUS.
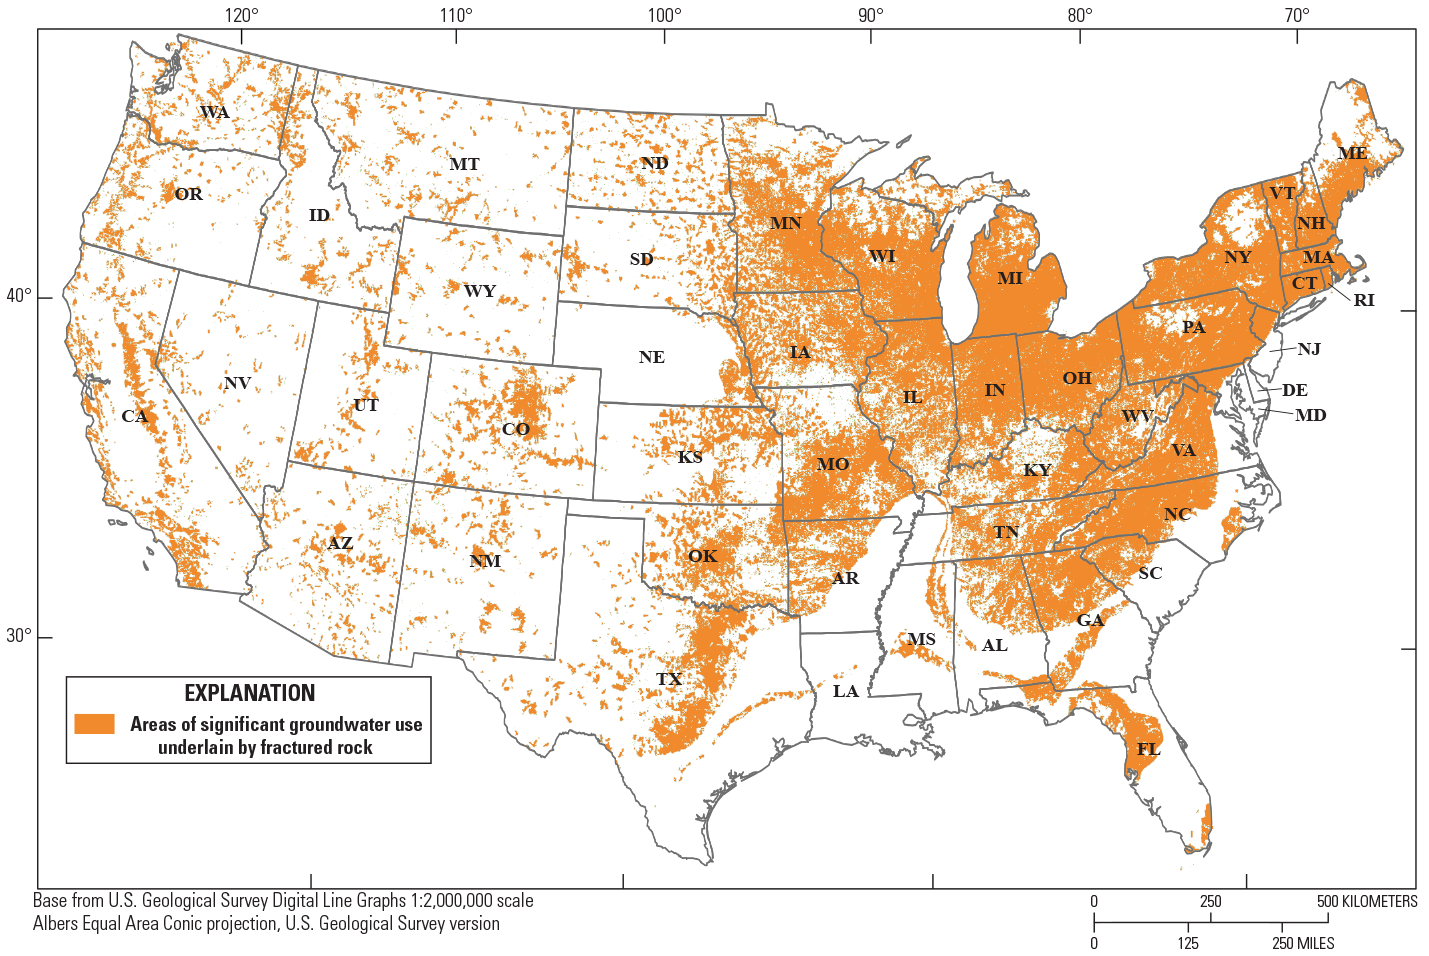
Map showing areas of significant groundwater use underlain by fractured rock in the conterminous United States. The orange highlighted area shows the intersection of areas of significant groundwater use from private domestic wells and public supply wells with areas underlain by fractured rock defined from principal aquifers (U.S. Geological Survey, 2003) and secondary hydrogeologic regions (Belitz and others, 2019).
The information used here to identify areas of significant groundwater use does not distinguish between groundwater withdrawals from wells completed in hydrogeologic units at various depths below land surface. In areas of the CONUS that are underlain by fractured rock, sufficient supplies of groundwater may be derived from unconsolidated, near-surface materials. Buried-valley aquifers and regions of extensive glacial outwash in the glaciated areas of the northern United States are examples of unconsolidated sediments that serve as sources of groundwater overlying fractured rock (Norris and Fidler, 1969; Seyoum and Eckstein, 2014). Local variability in the thickness and permeability of near-surface unconsolidated sediments and local variations in the topography of the bedrock surface can lead to wells completed in unconsolidated sediments and the underlying fractured rock that are in close proximity to each other. Thus, areas supplied only by groundwater from fractured rock, as opposed to near surface unconsolidated sediments, may be difficult to distinguish without more granular investigations of the depth associated with private-domestic and public-supply wells. A recent investigation of groundwater quality by Erickson and others (2019) focuses on groundwater wells withdrawing water from glacial sediments in the northern United States, and Johnson and others (2022) compiled information to map the population using public-supply wells in the CONUS and attributed those wells to different hydrogeologic units. These investigations provide greater clarity in distinguishing groundwater withdrawals from different hydrogeologic units but data enumerating sources of groundwater supplying private domestic wells outside of the glaciated northern United States have yet to be compiled.
In this investigation, we recognize that using information to classify areas of significant groundwater usage, without identifying the aquifer source (either unconsolidated sediments or the underlying bedrock), results in a larger area attributed to groundwater withdrawals from fractured rock. We accept the larger area attributed to groundwater usage from fractured-rock aquifers, because this investigation is not intended to be indicative of contamination susceptibility at specific groundwater wells at various depths below land surface. Instead, the results are intended as a cursory review of landscape areas that could be susceptible to rapid infiltration to the underlying fractured-rock aquifer. Thus, our investigation is intended as an impetus to conduct more targeted spatial investigations for wells completed in bedrock aquifers.
The highlighted area in figure 3 maintains the general shape of areas of the CONUS underlain by fractured rock in the upper Midwest and eastern United States. The more sparsely populated areas of the midwestern and western United States that are both underlain by fractured rock and designated as areas of significant groundwater use tend to be focused in areas of greater population density. Using information on the spatial distribution of population from 2010 (Falcone, 2016), the population in the area highlighted in figure 3 is approximately 150.5 million people, which reflects densely populated areas of the eastern United States and metropolitan areas in the midwestern and western United States. It is not anticipated that the entire population in the highlighted area of figure 3 is supplied solely by groundwater. Population centers are likely supplied by a combination of surface water and groundwater resources, depending on proximity to available surface-water resources and infrastructure. Nevertheless, the population associated with the area highlighted in figure 3 points to the spatial significance of groundwater resources in supplying the population and the potential reliance on aquifers characterized as fractured rock.
Landscape Attributes Affecting Susceptibility to Rapid Infiltration and Contamination From Agricultural Sources
The highlighted area in figure 3 is used as a starting point when surveying areas of the CONUS that are potentially susceptible to contamination events stemming from rapid infiltration into shallow fractured-rock aquifers. We then identify selected geologic, hydrologic, and land-use attributes and apply index values to these attributes. Larger index values are assigned to imply a greater susceptibility to conditions that may lead to rapid infiltration following meteorological conditions that deliver water to the land surface. The summation of index values from the selected landscape attributes provides a qualitative measure of the susceptibility to contamination from land-surface contaminants. This approach is similar to methods of assessing groundwater vulnerability described in Aller and others (1985) and Rupert (1999). The resultant susceptibility index is not intended as a quantitative measure of the probability of occurrence of contaminants in response to meteorological events. Instead, the resulting susceptibility index is intended as an indicator of where the processing of additional information is warranted to perform more detailed investigations of groundwater quality in response to meteorological events. Additional investigations and information could entail (1) analyses of historical groundwater quality data and correlating the occurrence of pathogens and high concentrations for constituents of concern with records of precipitation and snowmelt, (2) investigations of historical and current time-varying groundwater recharge in response to precipitation events and snowmelt, and (3) formulating other index-based or statistical methods using landscape and land-use attributes in the areas of interest to identify susceptibility to rapid recharge events that may carry surface contaminants to the water table.
The landscape attributes used in this investigation to assign index values of susceptibility to contamination in fractured-rock aquifers from rapid recharge following precipitation and snowmelt events are (1) depth to water table, (2) depth to bedrock, and (3) percentage of sand in soil. These attributes are most likely to correlate with rapid infiltration to the water table because conditions associated with shallow depth to the water table, shallow depth to bedrock, and high sand content (as opposed to clay or silt content) in near-surface material are most conducive to rapid infiltration to the water table. Other landscape attributes that are expressed as either measures of the capacity of the near surface materials to conduct infiltrating water or topographic conditions that may focus surface runoff to low-lying areas and surface depressions (for example, Doctor and others, 2020) could also be included in susceptibility assessments. A robust statistical assessment of factors affecting rapid infiltration is needed to identify the relative importance of a complete listing of landscape attributes. Such a statistical assessment could, for example, be conducted using the timing of water table responses to precipitation and snowmelt events, which could then be compared with landscape attributes to explain the statistical correspondence. Straight-forward statistical measures of the timing of water-table responses and precipitation, such as the Pearson and Spearman correlation coefficients (Schuenemeyer and Drew, 2011), however, are unlikely to be appropriate without first considering seasonal effects of vegetation and evapotranspiration (ET). For example, those periods experiencing high ET may show only slight water table responses to high-intensity precipitation events, whereas the same precipitation intensity under low ET conditions may yield rapid infiltration resulting in significant water table responses. Various methods have been developed for investigating seasonal responses in time series data (Sang, 2013; Box and others, 2015). A statistically robust analysis of landscape attributes that affect rapid infiltration to the water table is beyond the scope of this investigation.
In addition to depth to water table, depth to bedrock, and the percentage of sand in soil, we also consider the percentage of agricultural land use as an additional attribute when defining susceptibility to rapid infiltration and contamination. Although there may be other urban, suburban, industrial, commercial, and mixed-use land conditions that may lead to the occurrence of contaminants or pathogens at the land surface, agricultural areas are widely recognized as nonpoint sources of contaminants that can affect the underlying groundwater due to seasonal applications of amendments on the land surface (Puckett, 1994). Additionally, rural agricultural areas are also characterized by septic tanks and leach fields for onsite treatment of wastewater. Under conditions of rapid infiltration following precipitation events, retention and transformation of contaminants and pathogens leaching from septic systems may not occur prior to reaching the water table.
The index values applied to the landscape attributes and land-use conditions used in this investigation are listed in table 1 and examined in more detail in the sections below. Index values for depth to water and depth to bedrock were assigned to highlight aquifer settings close to land surface. The index values for percentage of sand in soils were evenly distributed over the range of this attribute, whereas index values for percentage of agricultural land use were skewed to place greater emphasis on agricultural land use greater than 40 percent.
The index values are applied on maps of the CONUS using raster data at a 1-kilometer (km) spatial resolution. When formulating the index of susceptibility to rapid infiltration and contamination stemming from agricultural sources in fractured-rock aquifers, the landscape and land-use attributes are assigned only to those areas of the CONUS that are highlighted in figure 3.
Table 1.
Index values assigned to landscape and land-use attributes used in compiling maps of susceptibility to rapid recharge and contamination from agricultural sources in the conterminous United States.[≥, greater than or equal to; <, less than]
| Landscape or land-use attribute | Source | Attribute units | Index value assigned to attribute range | ||||
|---|---|---|---|---|---|---|---|
| 1 | 2 | 3 | 4 | 5 | |||
| Attribute range | |||||||
| Depth to water table | Zell and Sanford, 2020b | meters | ≥25 | ≥10–25 | ≥5–10 | ≥2–5 | <2 |
| Depth to bedrock | Shangguan and others, 2017 | meters | ≥50 | ≥30–50 | ≥20–30 | ≥10–20 | <10 |
| Percentage of sand soils | Wolock, 1997 | percent | <20 | ≥20–40 | ≥40–60 | ≥60–80 | ≥80 |
| Percentage of agricultural land use | Homer and others, 2020 | percent | <10 | ≥10–20 | ≥20–40 | ≥40–80 | ≥80 |
Depth to Water Table
Information on depth to the water table in the CONUS is applied from Zell and Sanford (2020b). The spatial distribution of depth to water table is a modeled outcome from groundwater flow models constructed for surficial groundwater systems of the CONUS as discussed in Zell and Sanford (2020a). In this investigation, index values for depth to water table were derived from the CONUS-extent raster for the long-term average depth to water table in the surficial aquifer (Output_CONUS_trans_dtw.zip) available from Zell and Sanford (2020b). The original raster having 250-meter (m) by 250-m resolution was aggregated to 1-km by 1-km resolution by averaging the 16 cells that fell within the larger 1-square kilometer (km2) cell. The range of the depth to the water table associated with index values is listed in table 1 and displayed in figure 4; smaller values of depth to water table are assigned larger index values to indicate the potential for shorter residence times of water infiltrating through the unsaturated zone before reaching the water table, and thus, a greater potential for rapid recharge following precipitation events. To derive a susceptibility index for rapid recharge in shallow fractured-rock aquifers, the data shown in figure 4 are used only when they coincide with the highlighted area shown in figure 3.
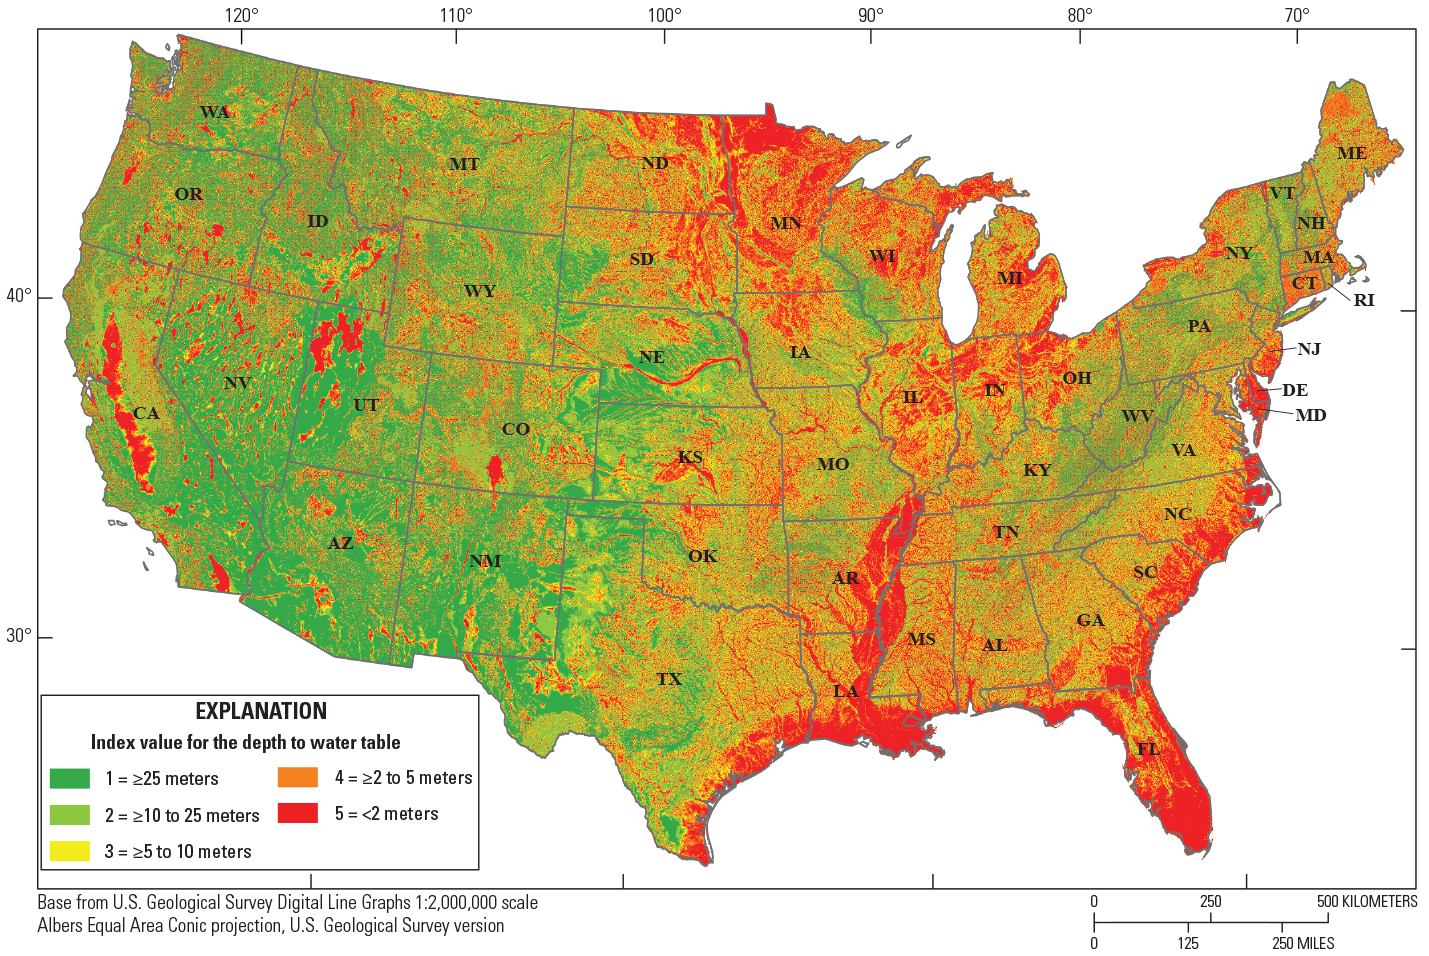
Map of the conterminous United States showing index values (between 1 and 5) assigned to the depth to water table from Zell and Sanford (2020b).
Depth to Bedrock
Depth to bedrock is also considered a proxy for the residence time of water infiltrating through the unsaturated zone, where there is greater potential for rapid infiltration to the water table with smaller values of the depth to bedrock. Depth to bedrock in the CONUS is applied from a global interpretation of depth to bedrock developed by Shangguan and others (2017) using data from soil profiles, borehole drilling logs, and proxy information such as topographic characteristics and remotely sensed location of bedrock outcrops, as well as information on bedrock depths reported in the literature. The spatial prediction model of depth to bedrock was developed using random forest algorithms and compared against sequestered data to establish the robustness of the regression.
Index values for depth to bedrock applied in this investigation were generated using the dataset in GeoTIFF format (BDTICM_M_1km_ll) for the absolute depth to bedrock (30-second resolution version, ~1 km) available at http://globalchange.bnu.edu.cn/research/dtb.jsp#download (Shangguan and others, 2017). The range of depth to bedrock values associated with index values is listed in table 1 and displayed in figure 5.
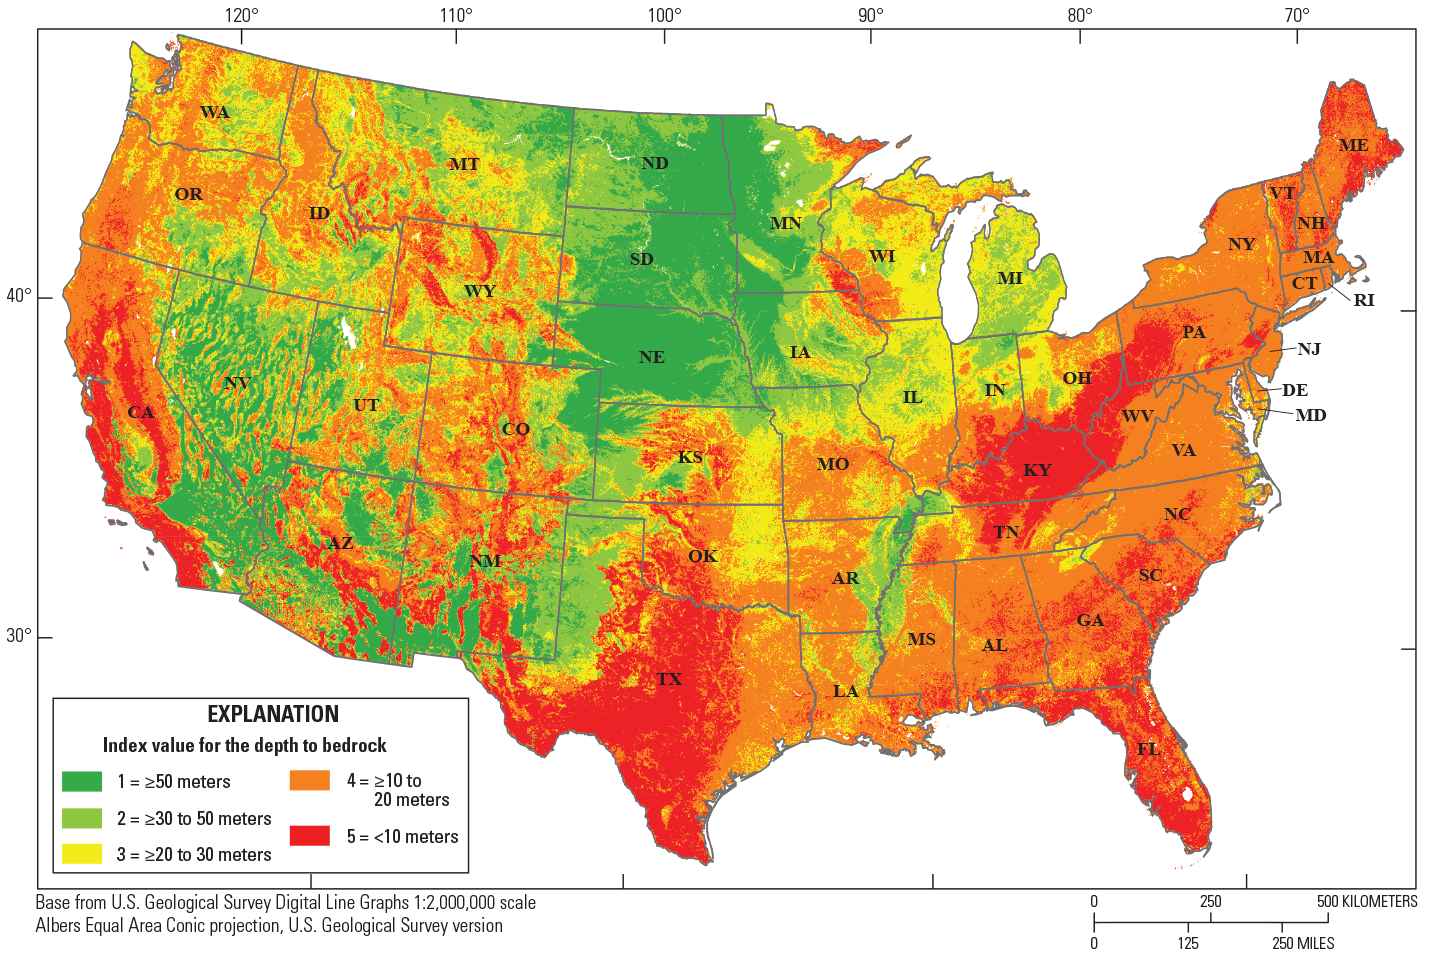
Map of the conterminous United States showing index values (between 1 and 5) assigned to the depth to bedrock from Shangguan and others (2017).
Percentage of Sand in Soil
The percentage of sand in soil for the CONUS is applied from Wolock (1997). The percentage of sand in soil is used here as an indicator of other soil properties, such as the soil permeability, that have physical meaning in characterizing the infiltration capacity of the soil. Wolock (1997) used information available from the State Soil Geographic (STATSGO) Data Base described in U.S. Department of Agriculture (1994) when developing 1-km resolution for various soil characteristics for the CONUS. The range of percentage of sand in soil values associated with index values is listed in table 1 and displayed in figure 6.
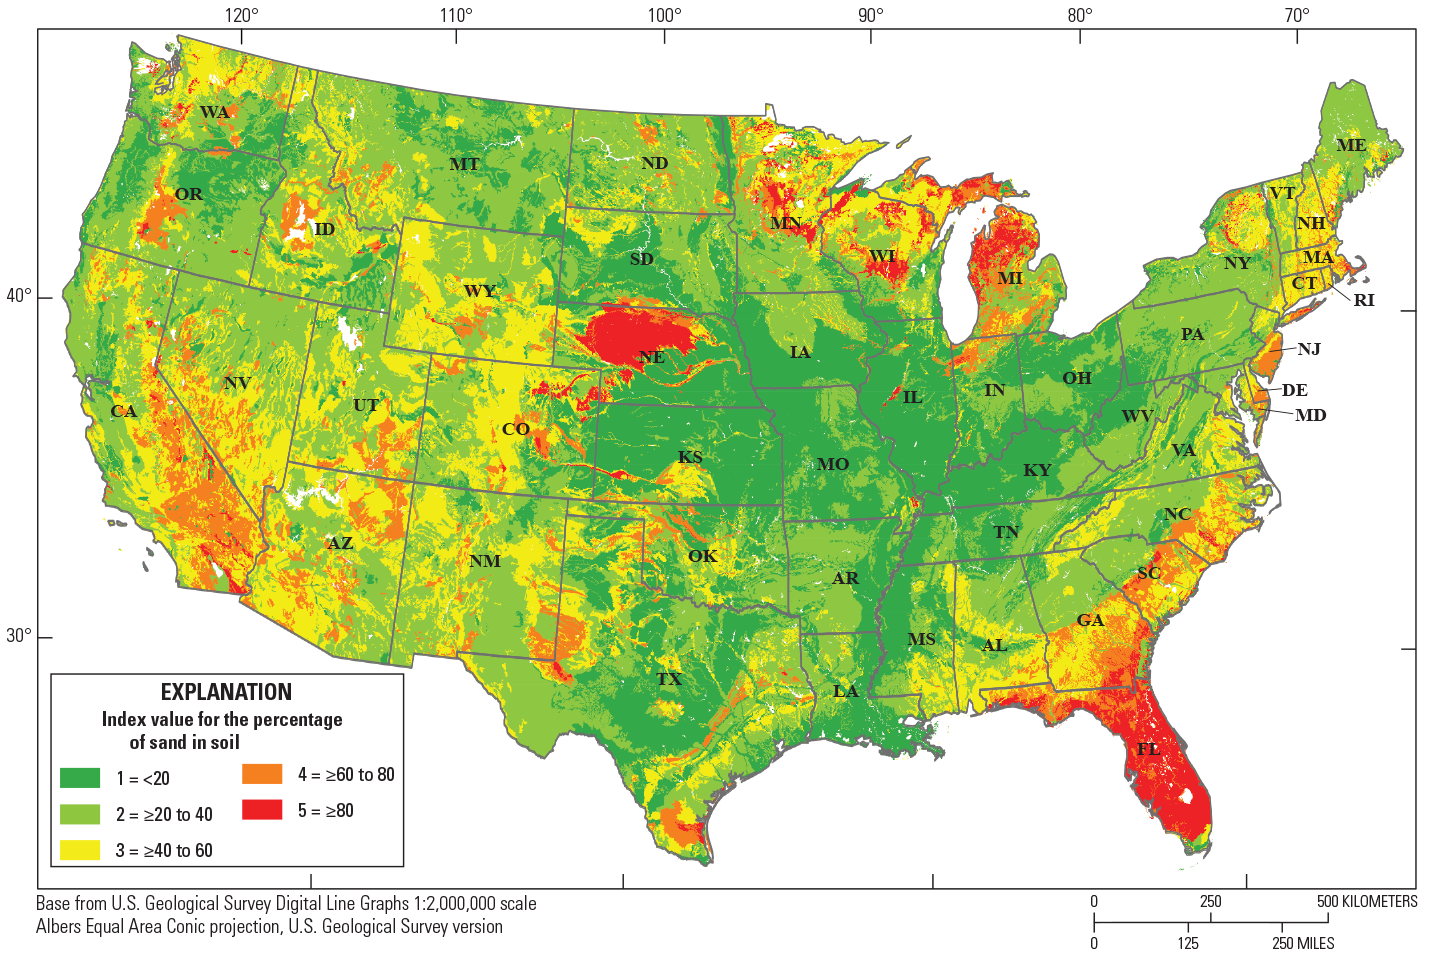
Map of the conterminous United States showing index values (between 1 and 5) assigned to the percentage of sand in soil from Wolock (1997).
Percentage of Agricultural Land Use
The percentage of agricultural land use for the CONUS is applied from Homer and others (2020), who investigated land-use changes between 2001 and 2016 using the National Land Cover Database (NLCD). For this investigation, we used information available from the NLCD associated with 2016 for agricultural land classifications 81—Hay/Pasture and 82—Cultivated Crops. The native resolution of the NLCD raster is 30 m by 30 m. This information was first resampled to 40 m by 40 m cells using the “Nearest” technique, which performs a nearest neighbor assignment so that the maximum spatial error will be one-half the cell size. The 40-m by 40-m raster was then aggregated to 1-km by 1-km cells by summing the number of 40-m by 40-m cells for agricultural land (Hay/Pasture and Cultivated Crops) and then dividing by the total number of 40-m by 40-m cells (625) in the 1-km2 block to obtain the percentage of agricultural land use. The range of the percentage of agricultural land use values associated with index values is listed in table 1 and displayed in figure 7.
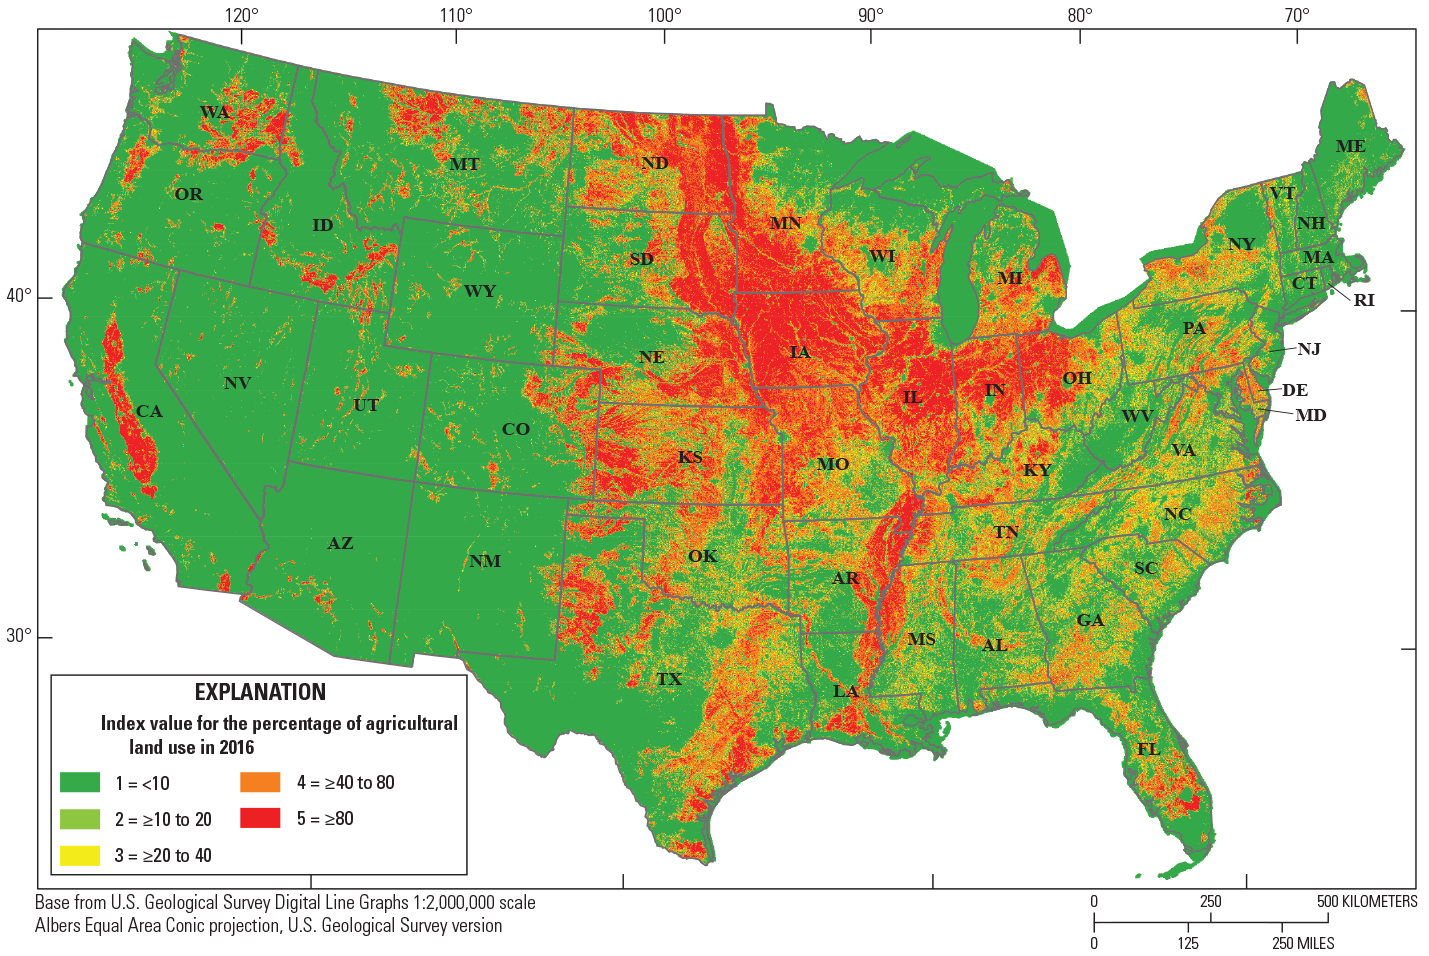
Map of the conterminous United States showing index values (between 1 and 5) assigned to percentage of agricultural land use as described in Homer and others (2020).
Maps of Susceptibility to Rapid Infiltration and Contamination From Agricultural Sources
Maps of susceptibility to rapid infiltration and contamination from agricultural sources were prepared by summing at each location the index values for depth to water table, depth to bedrock, percentage of sand in soil, and percentage of agricultural land use. The resultant map was then clipped using the highlighted area shown in figure 3 to produce the map in figure 8, where the summed index values range from 4 to 20. Larger values of the susceptibility index shown in figure 8 have landscape characteristics and land-use conditions that are more susceptible to rapid infiltration and contamination from agricultural sources. Here we focus on susceptibility in agricultural areas, but there may be other point and distributed sources of contamination in the map areas shown in figure 8 that may also lead to elevated concerns regarding contamination in shallow fractured rock stemming from rapid infiltration. Additionally, mapped areas in figure 8 do not address or specify sources of water for the population in those areas. The population may be served by surface-water sources or municipal supply wells where water treatments are applied prior to the delivery of water.
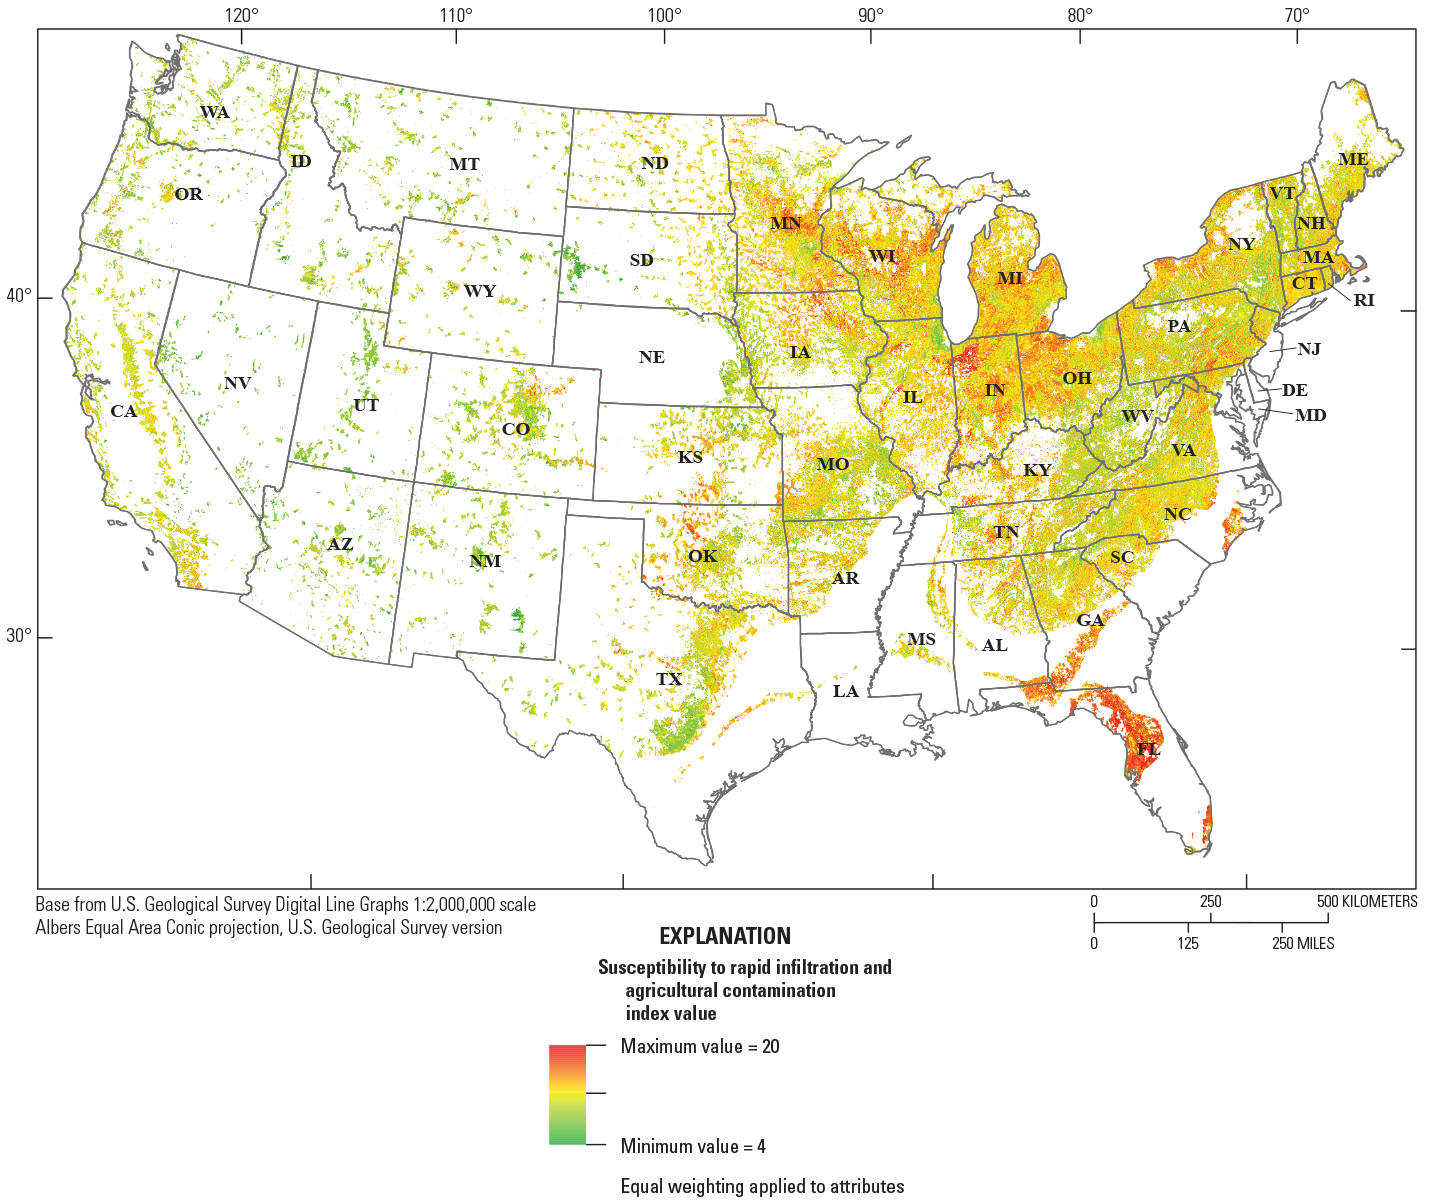
Map of the conterminous United States (CONUS) showing index values for susceptibility to rapid infiltration and contamination from agricultural sources using equal weights applied to all landscape and land-use attributes. Index values range from 4 to 20 and are applied only to areas of the CONUS underlain by fractured rock and identified as areas of significant groundwater usage as highlighted in figure 3. Larger index value indicates higher susceptibility.
The areas of the CONUS showing the highest susceptibility to rapid infiltration and contamination are most prevalent in the eastern half and upper Midwest of the United States associated with the (1) Floridan aquifer system in west-central Florida and southern Alabama and Georgia; (2) early Mesozoic basins in the mid-Atlantic States and along the east coast of the United States; and (3) aquifers underlying glaciated areas of the upper Midwest and northeastern United States, including the New York carbonate and sandstone aquifers, the Cambrian and Ordovician aquifers in parts of Wisconsin and Minnesota, and the Silurian and Devonian aquifers in parts of Wisconsin, Michigan, Illinois, Indiana, and Ohio (see USGS, 2003). Areas of high susceptibility to rapid infiltration and contamination are also defined in SHRs defined by Belitz and others (2019) in the Outer and Inner Michigan Basins.
There are isolated areas in the western half of the United States showing high susceptibility to rapid infiltration and contamination in Colorado, Oklahoma, Texas, Arkansas, and southwestern Missouri. These isolated areas fail to indicate larger aquifer units that are potentially susceptible to rapid infiltration and contamination. The location of these isolated areas of high susceptibility would need to be evaluated for rapid recharge based on local conditions. Some of the isolated areas of high susceptibility in Oklahoma, Texas, Arkansas, and Missouri correspond to mapped areas of karst features in carbonate aquifers (see Weary and Doctor, 2014). Karst features are also widely recognized and mapped in the carbonate aquifers of the upper Midwest and northeastern United States (Weary and Doctor, 2014; Kappel and others, 2020). Karst processes that result in closed depressions on the land surface (Doctor and others, 2020; Kappel and others, 2020) could also lead to rapid infiltration following precipitation events. A national map of closed depressions is discussed by Doctor and others (2020) and the data resources are available from Jones and others (2021). Incorporating topographic features such as closed depressions into susceptibility mapping could further identify and refine areas where more detailed investigations of susceptibility are warranted.
Equal weighting was applied to each of the index properties to arrive at the susceptibility index shown in figure 8. In the current context and approach of defining susceptibility, this weighting is arbitrary and may not reflect the susceptibility to rapid infiltration causing contamination. We can attempt to highlight the importance of selected attributes when creating a susceptibility index by providing more weight to specific attributes. For example, investigations have shown the significance of the thickness of unconsolidated materials when detecting viruses in public supply wells in fractured rock (Arihood and Cohen, 2006; Allen and others, 2017). Doubling the weight applied to the depth to bedrock and the depth to the water table yields the map shown in figure 9, where the maximum and minimum susceptibility indices are 30 and 6, respectively.
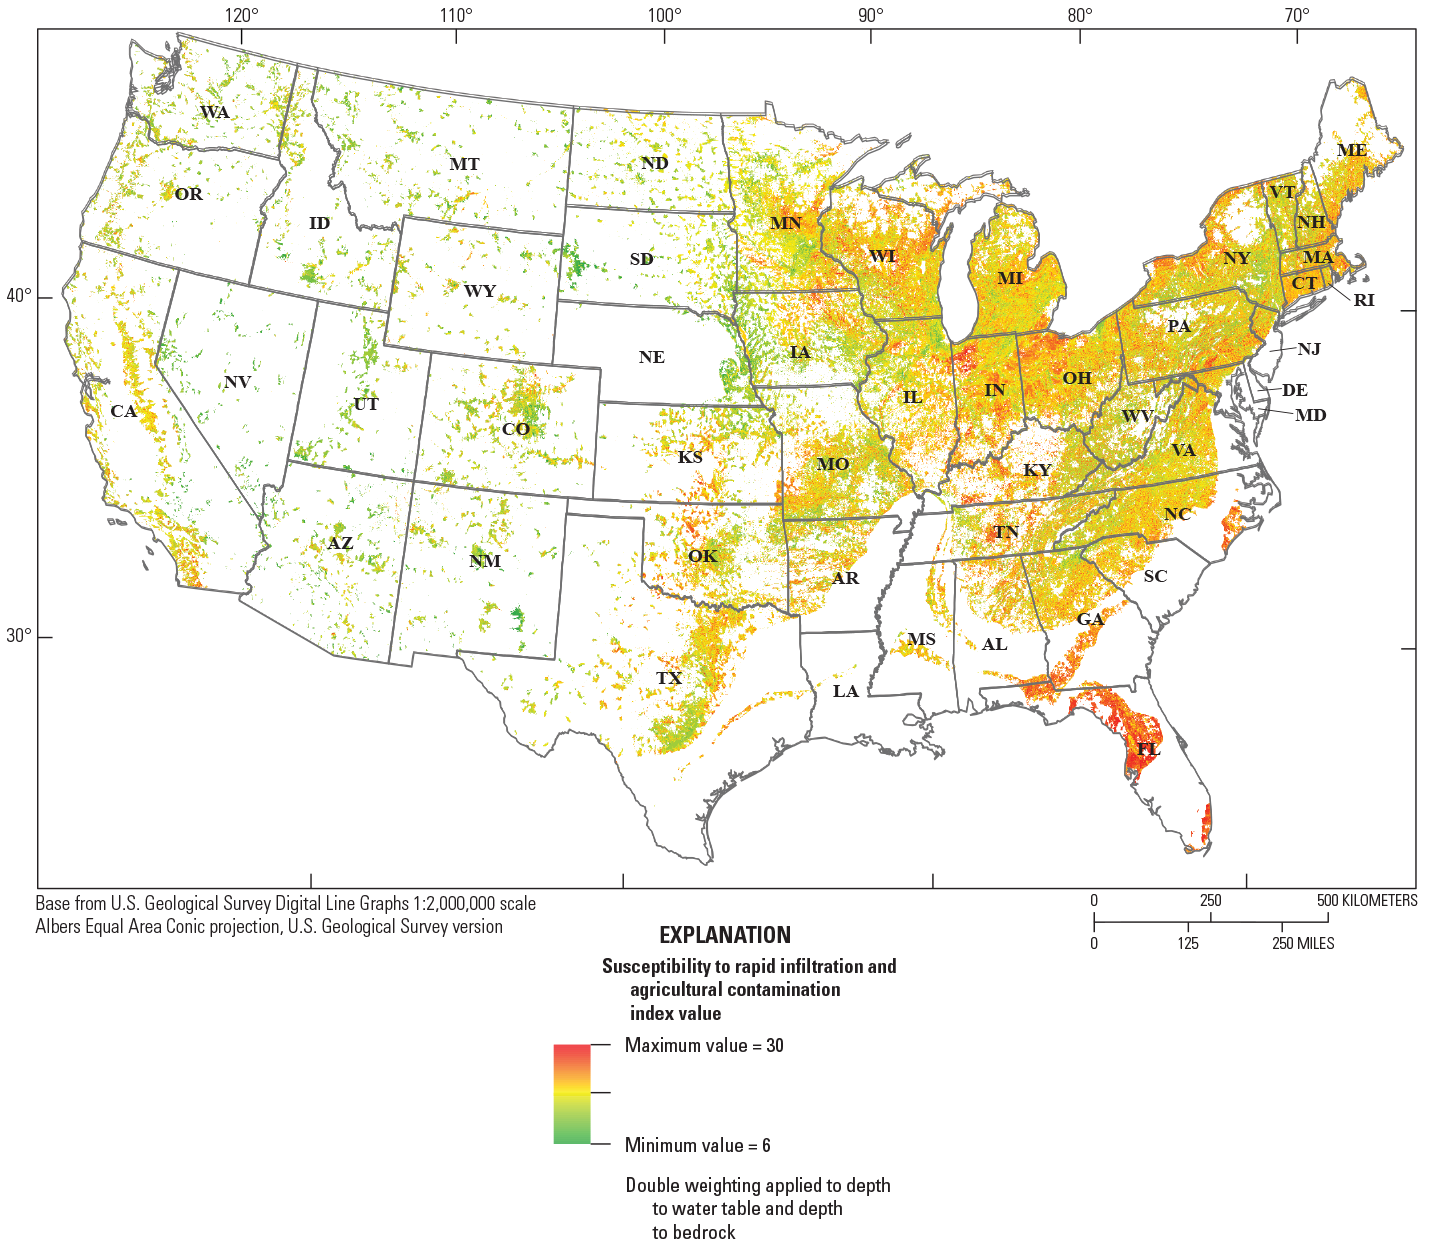
Map of the conterminous United States (CONUS) showing index values for susceptibility to rapid infiltration and contamination, where depth to the water table and depth to the bedrock are assigned double the weight of the other landscape and land-use attributes. Index values range between 6 and 30 and the index values are applied only to areas of the CONUS underlain by fractured rock and identified as areas of significant groundwater usage as highlighted in figure 3. Larger index value indicates higher susceptibility.
The general areas of highest susceptibility shown in figure 8 are also present in the aquifer areas associated with highest susceptibility shown in figure 9, although in figure 9 there is greater weight applied to index values for depth to water table and depth to bedrock. The areas of highest susceptibility in figure 9, however, are not as spatially extensive in comparison to results shown in figure 8. For example, glaciated regions of the northern United States (Minnesota, Wisconsin, Michigan, Illinois, and Ohio) with the highest susceptibility in figure 9 appear as isolated regions, rather than spatially extensive zones on the landscape. The regions of highest susceptibility shown in figure 8 should continue to be of interest when assessing groundwater vulnerability to transient contamination events; however, given the additional weight applied to the depth to water table and the depth to bedrock, the susceptibility index shown in figure 9 would be a logical starting point for initial investigations of areas where groundwater is most susceptible to rapid infiltration and contamination following precipitation events and spring snowmelt.
Transient Contamination Events and Contaminant Longevity
Particulate materials and microorganisms introduced to the groundwater following infiltration from extreme precipitation will most likely result in contamination periods of limited duration; particulate materials will be subject to filtration and settling (Becker and others, 2004, 2005; Harvey and others, 2008) and microorganisms will experience die-off with longer residence times in the subsurface (John and Rose, 2005). In contrast, following precipitation events, the introduction of surface contaminants that can dissolve into groundwater can lead to elevated contaminant concentrations in the groundwater of fractured-rock aquifers over periods of time that far exceed the duration of the precipitation event.
Longevity of Contamination in Fractured-Rock Aquifers
Fractured-rock aquifers are characterized by two distinct types of void openings or porosities: the void openings associated with fractures and the void openings associated with the intrinsic or primary porosity of the rock (Shapiro, 1987). The fracture void space is often referred to as the secondary porosity, which occurs from deformation and weathering processes after the initial formation of the rock. Fractures are generally characterized as void openings with a dimension along the fracture axis that is large in comparison to the aperture. This facilitates less resistance to fluid movement and greater permeability in comparison to unconsolidated granular porous media, which are characterized by individual void openings with similar length, width, and height dimensions (Freeze and Cherry, 1979).
The intrinsic or primary porosity of the rock, which is also referred to as the rock matrix porosity, is a characteristic of the initial formation of the rock and subsequent diagenetic processes. The dimensions of individual void openings in the rock matrix of most types of sedimentary and crystalline rock are on the order of microns (10-6 meters) (Shapiro and others, 2017), and when coupled with the complex interconnectivity of these void openings results in the rock matrix having little permeability in comparison to that of fractures. Consequently, the rock matrix contributes little to volumetric groundwater flow; however, the void space of the rock matrix acts as a fluid reservoir into which dissolved constituents can diffuse from groundwater moving in the adjacent fractures. Diffusion of dissolved constituents from fractures to the rock matrix can attenuate the concentration of contaminants in the groundwater of fractures moving downgradient; however, once the concentration of the dissolved constituent in the fracture falls below the concentration in the rock matrix, the dissolved constituents will diffuse back into the fractures and move with the flowing groundwater to downgradient locations. Diffusion out of the rock matrix into fractures greatly extends the residence time of constituents in groundwater and may adversely affect groundwater quality at downgradient locations for extended periods of time (National Research Council, 1996; National Academies of Sciences, Engineering, and Medicine, 2015). This phenomenon is well recognized at sites of groundwater contamination, where even under conditions of continuous pumping to remove contaminated groundwater, elevated concentrations of contaminants diffuse out of the rock matrix for decades after the events that led to the initial introduction of contaminants into the subsurface (Shapiro and others, 2018; Tiedeman and others, 2018).
Circumstances following extreme precipitation events where there is rapid infiltration of surface contaminants into the groundwater of shallow fractured-rock aquifers can lead to conditions where dissolved constituents initially diffuse into the rock matrix, followed by back-diffusion into permeable fractures. The pulse of water carrying surface contaminants with recently infiltrating water will initially lead to elevated concentrations in the fractures of the underlying aquifer. Once the infiltration from the precipitation event has ended, flowing groundwater from upgradient locations will flush fractures with groundwater having lower concentrations of the dissolved constituents, which will result in the back-diffusion of constituents out of the rock matrix and into the permeable fractures that move groundwater to downgradient locations and groundwater abstraction points, such as public-supply and private-domestic wells and surface water drainages.
Although the duration of extreme precipitation events may only extend over several hours or days, the process of diffusion into the rock matrix over this short duration can still lead to extended periods where constituents diffuse back into permeable fractures, adversely affecting water quality at downgradient locations. This is demonstrated using a simulation of the concentration of a dissolved constituent monitored downgradient from an assumed infiltration location into a fracture (Shapiro and others, 2007). In the simulation, a pulse of a dissolved constituent is introduced into the groundwater over 1 day. Breakthrough curves for different scenarios of chemical transport in fractures are displayed in figure 10 at 50 m downgradient from the pulse injection location. In this simulation, the average velocity of the groundwater is assumed to be 1 meter per day (m/d).
Figure 10 shows results for the transport of a dissolved constituent with advection and dispersion in fractures (without matrix diffusion), and for two scenarios of chemical transport in fractures with diffusion into and out of the rock matrix; the scenarios for matrix diffusion consider two different diffusion coefficients. Figure 10 shows breakthrough curves of the concentration of the dissolved constituent at 50 m downgradient from the infiltration location. The breakthrough curves are plotted as the concentration of the dissolved constituent, C, relative to the maximum injection concentration, C0, on a logarithmic vertical axis. The horizontal axis on figure 10 is the elapsed time since the infiltration of the constituent in the fractures, which is also plotted on a logarithmic scale.
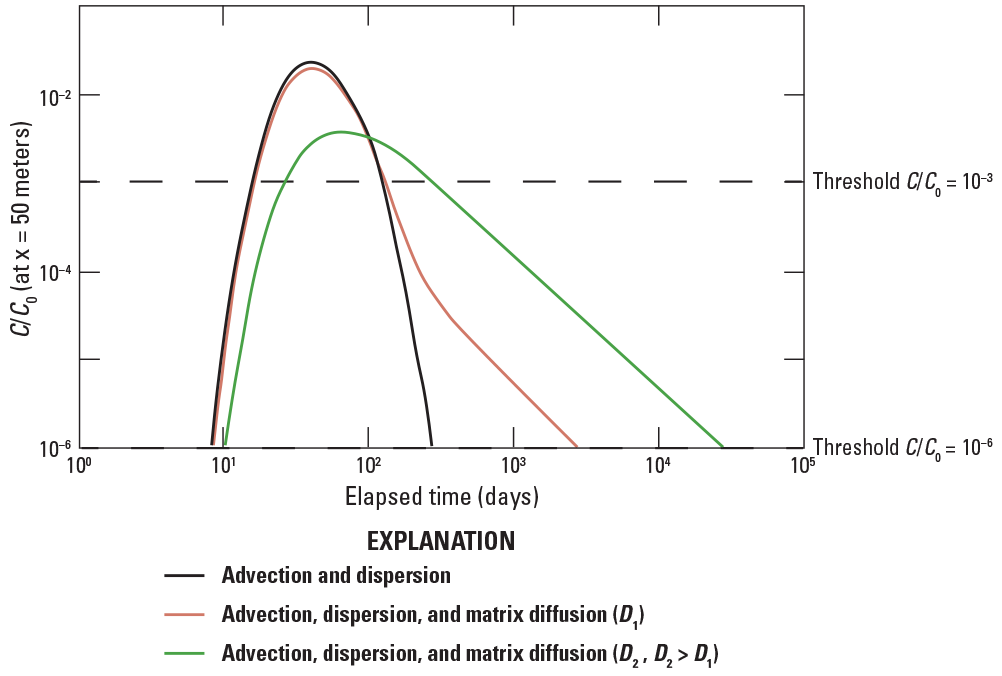
Hypothetical breakthrough curves at 50 meters downgradient from a point of a pulse injection over 1 day into a fractured aquifer followed by flushing the aquifer with contaminant-free water. Results are shown for advection and dispersion (with no diffusion into the rock matrix) and two scenarios for advection, dispersion, and matrix diffusion, where the coefficient of diffusion D2 > D1 (D2 is an order of magnitude greater than D1). The average groundwater velocity is assumed to be 1 meter per day. Modified from Shapiro and others (2007). [C/C0, relative concentration; x, distance downgradient from pulse injection location; D1, D2, coefficients of diffusion in the rock matrix; >, greater than]
For the scenario of advection and dispersion in fractures (without matrix diffusion), most of the dissolved constituent arrives at the monitoring location (50 m downgradient) after approximately 50 days of elapsed time by advection with the average groundwater velocity (1 m/d). The breakthrough curve shows small amounts of the dissolved constituent arriving prior to and after the peak concentration due to dispersion (Bear, 1979), which accounts for variability in the fluid velocity. For this scenario, the relative concentration (C/C0) at the monitoring location falls below a threshold value of C/C0 = 10-3 after approximately 120 days of elapsed time. Here, the threshold value of C/C0 is arbitrarily defined but could represent a Maximum Contaminant Level (MCL) or a Maximum Contaminant Level Goal (MCLG) (EPA, 2021) relative to the initial concentration, C0. A threshold relative concentration greater than or less than 10-3 could also be identified, depending on the contaminant of concern and the initial concentration of the contaminant, C0, introduced into the groundwater at the infiltration location. For some organic contaminants, such as trichloroethylene, a threshold relative concentration of C/C0 = 10-6 may be appropriate relative to the concentration of the contaminant at its solubility in groundwater. The elapsed time for C/C0 to fall below the threshold relative concentration of C/C0 = 10-6 is approximately 200 days following the 1-day pulse introduction of the contaminant in the groundwater.
The chemical transport scenarios shown in figure 10 that consider diffusion into and out of the rock matrix show elongate breakthrough tails in comparison to the transport scenario that considers advection and dispersion only. These elongate tails are a result of the back diffusion of the dissolved constituent into permeable fractures after the peak concentration in the fracture passes a given location and the concentration in the fracture is less than the concentration in the adjacent rock matrix. The two matrix diffusion scenarios shown in figure 10 consider different magnitudes of the diffusion coefficient, designated as D1 and D2, where in figure 10, D2 > D1 (D2 is an order of magnitude greater than D1). The magnitude of the diffusion coefficient depends on the free-water diffusion coefficient of the dissolved constituent, the tortuosity of the intrinsic porosity of the rock matrix, and the porosity of the rock matrix (Shapiro, 2001; Shapiro and others, 2007). Larger values of the rock matrix porosity will result in larger values of the diffusion coefficient. For igneous and metamorphic rocks, the matrix porosity has been reported to range between 1 and 3 percent of the rock volume (Wood and others, 1996; Ohlsson and Neretnieks, 1997). In comparison, lithification and diagenetic processes associated with the formation of many sedimentary rocks results in larger matrix porosities than many types of igneous and metamorphic rock. The intrinsic porosity of various carbonate rocks and sedimentary rock can exceed 10 percent (Shapiro and others, 2017). Therefore, it is not unreasonable to expect order of magnitude differences in the diffusion coefficients applied in analyses of chemical transport among different rock types
For the breakthrough curve associated with D1 shown in figure 10, the small diffusion coefficient results in only a small reduction of the peak concentration at the monitoring location (50 m downgradient from the infiltration location) in comparison to the scenario that considered only advection and dispersion. The reduction in the peak concentration is associated with the contaminant mass that diffuses into the rock matrix and then later diffuses back into the permeable fractures. The back diffusion results in the elongated breakthrough tail. For this scenario, there is no perceptible extension of the duration of the contaminant concentration above the threshold C/C0 = 10-3 in comparison to the advection and dispersion scenario. However, considering a threshold relative concentration of 10-6, the duration of the concentration above this threshold value is an order of magnitude greater than that associated with the advection-dispersion scenario. The elapsed time of the concentration above C/C0 = 10-6 is approximately 2,000 days.
For the transport scenario using the larger diffusion coefficient, D2, more of the contaminant mass diffuses into the rock matrix, which significantly attenuates the peak concentration at the monitoring location and shifts its arrival later in time in comparison to the advection-dispersion scenario. The larger amount of mass that diffuses into the rock matrix results in a more elongated breakthrough tail than that associated for the transport scenario using D1. In this scenario, the duration that the concentration is above the threshold relative concentration C/C0 = 10-3 is approximately 500 days, and the duration above the relative concentration threshold C/C0 = 10-6 is approximately 20,000 days (~55 years!).
The duration above the threshold value (either C/C0 = 10-3 or C/C0 = 10-6) is an important criterion in evaluating contaminant longevity, as this represents the duration above which the groundwater may be regarded as unsafe for human consumption. The transport scenarios shown in figure 10 are simulated for the infiltration of a contaminant source into the groundwater only over a 1-day period. If there are multiple precipitation events which result in the contaminant being introduced into the groundwater at multiple occasions, or precipitation events of longer duration, the superposition of multiple contaminant pulses would need to be considered in evaluating the duration of the contaminant concentration above a given threshold value. At sites, such as industrial facilities, where point sources of groundwater contamination have been undetected for years, the duration of contaminant concentrations above a threshold value can extend for multiple decades, even with ongoing active remediation treatments applied (Lacombe, 2011).
Areas Susceptible to Contaminant Longevity in Fractured Rock
The discussion above regarding the potential for contaminant longevity in fractured-rock aquifers highlights the unique attributes of fractured rock aquifers and the role of diffusive chemical exchange between permeable fractures and the intrinsic porosity of the rock matrix. Those aquifers that are characterized as sedimentary or carbonate rock are likely to have larger matrix porosities than igneous and metamorphic rocks, and therefore, a greater capacity for diffusive exchange between fractures and the rock matrix. A larger diffusive exchange between fractures and the rock matrix can lead to extended durations where contaminant concentrations are above threshold concentrations associated with safe drinking-water requirements.
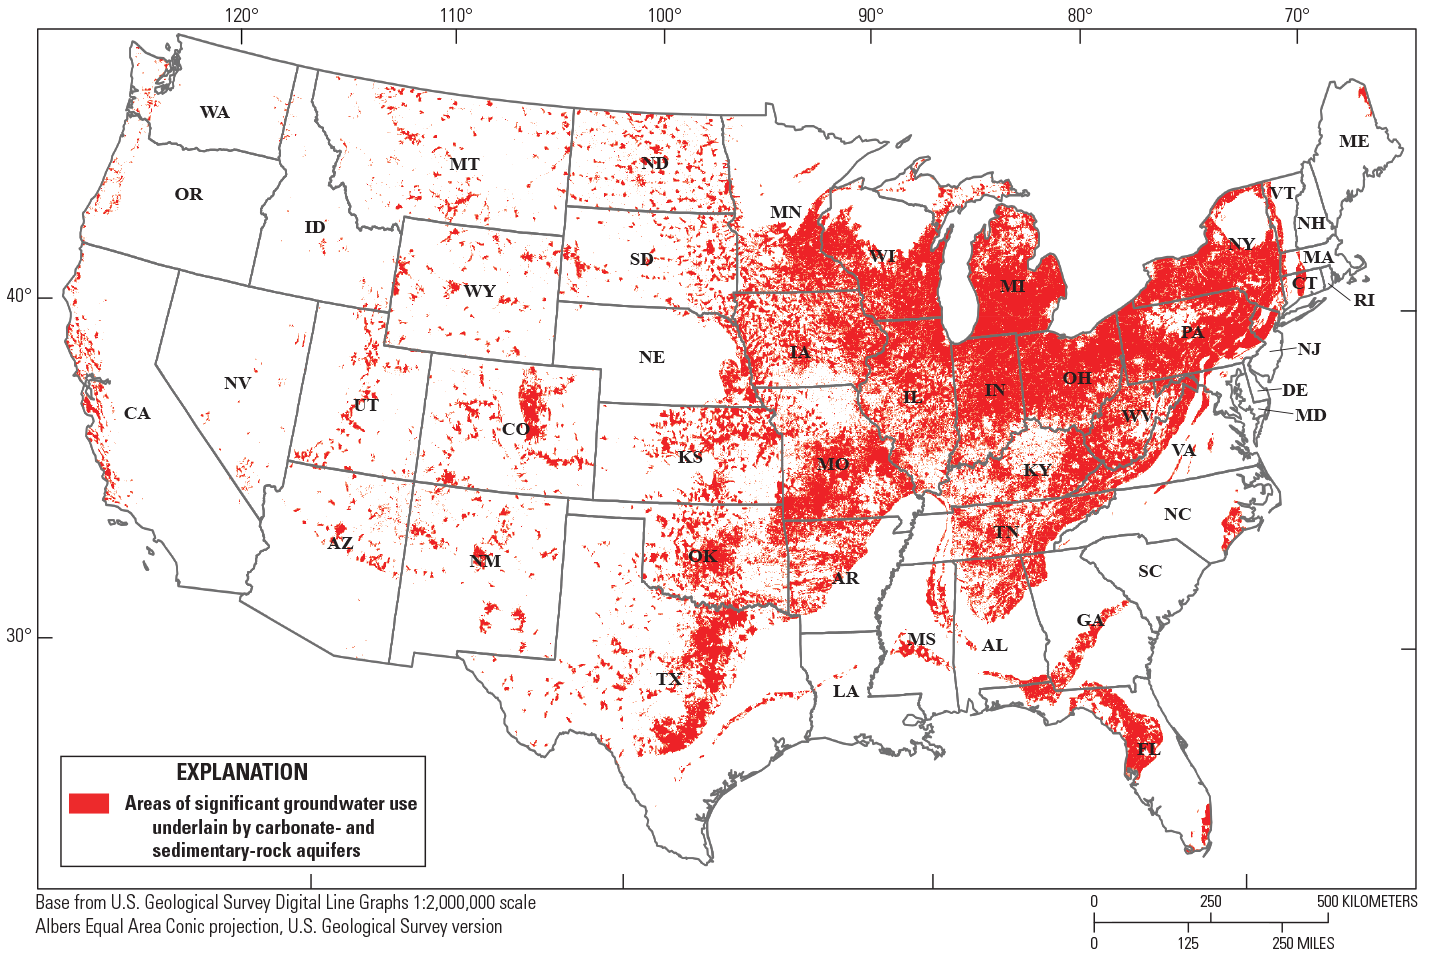
Figure 11 shows the area of the CONUS where PAs and SHRs are identified as either sedimentary or carbonate rocks. The highlighted area in this figure represents approximately 51 percent of the CONUS. In comparison, the areas of the CONUS underlain by fractured rock (of any type) constitutes 73 percent of the CONUS (see fig. 2). Carbonate- and sedimentary-rock aquifers constitute a large areal percentage of fractured-rock formations in the CONUS in which groundwater is available for use. The population served by public supply wells in PAs and SHRs categorized as carbonate and sedimentary rocks can be derived from information available in Johnson and others (2022).
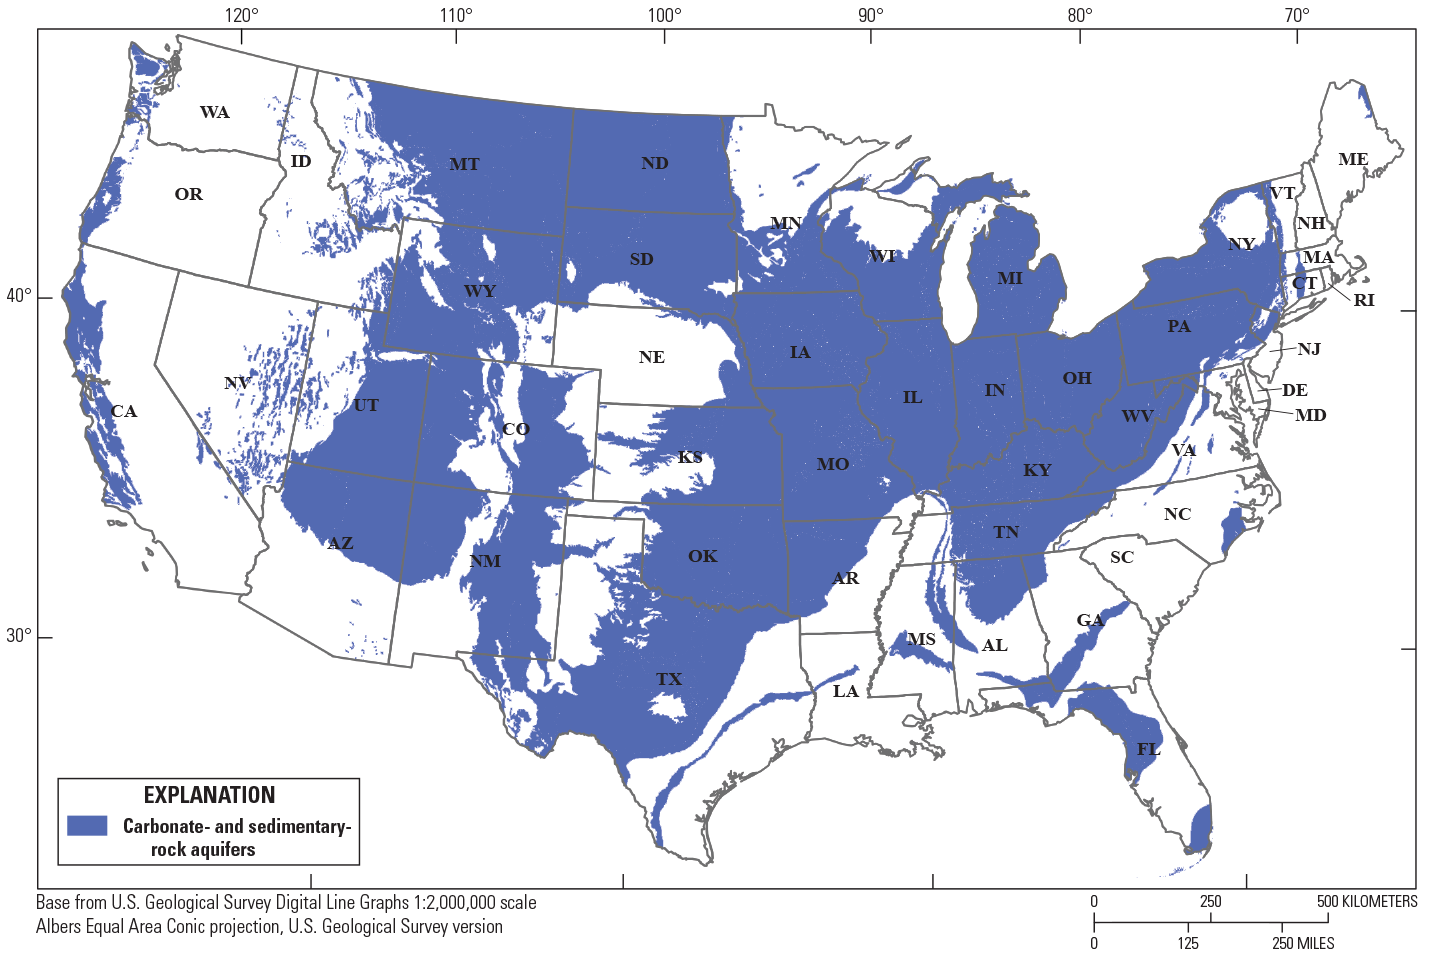
Map of the conterminous United States showing carbonate- and sedimentary-rock aquifers identified from principal aquifers (U.S. Geological Survey, 2003) and secondary hydrogeologic regions (Belitz and others, 2019).
Areas in the CONUS designated as carbonate- and sedimentary-rock aquifers shown in figure 11 that are associated with areas of significant groundwater use as shown in figure 3, are highlighted in figure 12. Figure 12 represents those areas of the CONUS underlain by carbonate or sedimentary rocks where there is significant groundwater usage. The highlighted area shown in figure 12 is approximately 19 percent of the CONUS; in comparison, the highlighted area of the CONUS showing significant groundwater use underlain by fractured rock in figure 3 is 27 percent.
Areas of the conterminous United States with significant groundwater use associated with carbonate- and sedimentary-rock aquifers.
As we noted in earlier discussions, our methods of identifying significant groundwater use do not distinguish groundwater withdrawals as a function of hydrogeologic units at different depths. In areas where fractured-rock aquifers are overlain by thick unconsolidated sediments, groundwater withdrawals may be associated with those unconsolidated sediments, especially in the glaciated regions of the northern United States (Erickson and others, 2019; Johnson and others, 2022). Consequently, the areas attributed to significant groundwater use from carbonate- and sedimentary-rock aquifers in figure 12 would need to be further inspected when conducting investigations of potential contaminant longevity.
Similar to the approach applied previously in defining areas most susceptible to rapid infiltration and contamination, the area of the CONUS highlighted in figure 12 can be used with landscape and land-use attributes to survey potential areas that may be most susceptible to contaminant longevity stemming from rapid infiltration following extreme precipitation events. In conducting such a survey, however, it would be beneficial to identify specific target contaminants, their threshold concentrations, and their occurrence in land-use classifications. These results could then be useful for identifying areas of the CONUS needing more detailed investigations of contaminant longevity in the groundwater of fractured-rock aquifers that are important sources of domestic water supply.
Summary and Conclusions
Characteristics of fractured-rock aquifers permit rapid movement of groundwater from areas of infiltration to locations where groundwater is abstracted from public-supply or private-domestic wells. Consequently, contaminants introduced into fractured-rock aquifers may not be subject to the filtration and attenuation processes that are usually associated with unconsolidated aquifer materials. Groundwater moving through unconsolidated porous media are subject to longer residence times that afford more contact with aquifer materials in comparison to transport through fractures.
Concerns regarding contamination in the groundwater of fractured-rock aquifers are acute in landscape areas where there is rapid infiltration to the groundwater table following extreme precipitation events or spring snowmelt. Infiltrating water that rapidly reaches the water table has the capacity to carry pathogens and contaminants from the land surface, and rapid infiltration through the unsaturated zone to the water table may not provide sufficient capacity to attenuate or transform contaminants in the infiltrating water. Such conditions have been responsible for instances where pathogens have been detected in the groundwater of underlying fractured-rock aquifers. Some of these cases have resulted in severe intestinal attacks on those exposed to the groundwater (Muldoon and others, 2018; Murphy and others, 2020), and in some cases, deaths have been reported (Hrudey and others, 2003). The locations of these reported events from sources of groundwater in the bedrock underlying the glaciated areas of the northern United States and southern Canada are consistent with the areas of the high susceptibility to rapid infiltration and contamination identified in this investigation.
Instances of rapid infiltration to the water table in fractured-rock aquifers following precipitation or spring snowmelt may lead to intermittent contamination events and the temporary degradation in groundwater quality. Existing approaches that assess groundwater vulnerability over large landscape areas, including index and statistical methods (National Research Council, 1993; Focazio and others, 2002), are unlikely to capture the occurrence of intermittent contamination events, as these methods synthesize information that do not account for current and time-varying meteorological or land-use conditions. New methods of assessing groundwater vulnerability that synthesize current and time-varying meteorological and land-use conditions are needed to evaluate susceptibility to contamination for real-time decision support on groundwater usage or the application of treatments prior to use. Approaches to conducting time-varying groundwater vulnerability assessment could include (1) real-time monitoring of chemical and biological indicators in groundwater in target areas, (2) the application of process-based chemical and pathogen transport models, and (3) the use of time-varying groundwater recharge as a surrogate to identify periods of susceptibility to rapid infiltration following precipitation or snowmelt events.
The application of new methods that assess time-varying groundwater vulnerability may be targeted to those landscape areas that are likely to be susceptible to rapid infiltration following precipitation or snowmelt and where groundwater is a principal source of water supply to the population. A survey of principal aquifers and secondary hydrogeologic regions that are characterized as fractured-rock aquifers constitute approximately 73 percent of the conterminous United States (CONUS) (fig. 2); however, only 27 percent of the CONUS is underlain by fractured-rock aquifers that coincide with areas of significant groundwater usage from public-supply wells or private domestic wells (fig. 3). The population associated with these areas of the CONUS exceeds 150 million people. Although the entire population in these areas are not supplied solely by groundwater, the significance of groundwater from fractured-rock aquifers to a large percentage of the population is apparent.
To further narrow and identify areas of the CONUS that are potentially susceptible to rapid infiltration into fractured-rock aquifers, indices are assigned to landscape attributes and land-use conditions. Depth to the water table, depth to bedrock, and the percentage of sand in soil are selected as the primary factors that influence rapid infiltration. We recognize that there may be a longer list of landscape attributes that could also affect rapid infiltration, for example, various topographic characteristics and soil moisture conditions, and the importance of these attributes could vary from one region to the next, as well as being seasonally dependent. A more thorough investigation of landscape attributes that affect rapid infiltration to underlying fractured-rock aquifers would require the application of advanced regression techniques and time-series methods analyzing groundwater responses to meteorological conditions.
In addition to the landscape attributes noted above, we consider percentage of agricultural use as another factor when determining an index of susceptibility to rapid infiltration that may also result in contamination. A combination of amendments added to agricultural lands and the presence of livestock can often result in the occurrence of pathogens and various chemical constituents at the land surface that at high enough concentrations may be a concern for human health. There are likely to be other land-use attributes that we have not considered in this investigation that may also yield a susceptibility to contamination. Some of these factors may include the density of private septic facilities, various types of industrial and commercial facilities, and sites that store or process various types of chemical or hazardous wastes.
The combination of the indices from the landscape attributes and land-use conditions are summed to identify an index of susceptibility for rapid infiltration and contamination. The larger values of this index indicate those areas that are likely to be most susceptible to rapid infiltration and contamination from agricultural sources. The areas of highest susceptibility include areas of fractured-rock aquifers underlying glacial sediments in the upper Midwest and northeastern United States, aquifers associated with the early Mesozoic basins located in the northeastern and mid-Atlantic United States, and bands of carbonate aquifers in the southeastern United States. There are also isolated areas in the western half of the United States showing high susceptibility to rapid infiltration and contamination. The isolated areas in Oklahoma, Texas, Arkansas, and southwestern Missouri correspond to karst regions of carbonate aquifers. More detailed investigations of meteorological conditions and landscape characteristics in these areas are warranted for the occurrence of transient contamination events stemming from rapid infiltration.
The rapid infiltration of particulate contaminants and microorganisms from land surface to the groundwater table following extreme precipitation events or spring snowmelt may lead to contamination events of a limited duration, as particulate materials will be subject to filtering and settling with greater elapsed time, and microorganisms will experience die-off. Contaminants that rapidly infiltrate from the land surface to the water table and dissolve into groundwater, however, may result in groundwater contamination events of a longer duration. After being introduced into the fractures of the aquifer, dissolved constituents can diffuse from fractures into the intrinsic porosity of the rock matrix and then later diffuse back into fractures when concentration gradients are conducive. The back-diffusion of dissolved constituents can lead to long residence times of contaminants in the permeable fractures. The concentration of the dissolved constituent introduced into the groundwater and the magnitude of the diffusion coefficient will dictate the duration of the contaminant concentration above a threshold value associated with drinking-water standards for contaminants of concern.
Larger diffusion coefficients are associated with a larger porosity of the rock matrix. Carbonate- and sedimentary-rock formations usually have matrix porosities that are larger than that associated with igneous and metamorphic rocks. The large matrix porosity for carbonate- and sedimentary-rock aquifers has the capacity to retain more of the dissolved constituent through diffusion, which then can diffuse back into permeable fractures and migrate downgradient.
Large areas (approximately 51 percent) of the CONUS are characterized by carbonate- and sedimentary-rock aquifers. Approximately 19 percent of the CONUS is associated with these rock types while also being designated as an area of significant groundwater usage. In these areas of the CONUS, assessing both rapid infiltration and contaminant longevity would be beneficial in evaluating susceptibility to groundwater contamination.
References Cited
Allen, A.S., Borchardt, M.A., Kieke, B.A., Jr., Dunfield, K.E., and Parker, B.L., 2017, Virus occurrence in private and public wells in a fractured dolostone aquifer in Canada: Hydrogeology Journal, v. 25, no. 4, p. 1117–1136, accessed September 1, 2022, at https://doi.org/10.1007/s10040-017-1557-5.
Aller, L., Bennett, T., Lehr, J.H., and Petty, R.J., 1985, DRASTIC—A standardized system for evaluating ground water pollution potential using hydrogeologic settings: U.S. Environmental Protection Agency, Robert S. Kerr Environmental Research Laboratory, Office of Research and Development, EPA/600/2–85/018, 163 p.
Arihood, L.D., and Cohen, D.A., 2006, Methods used to assess the susceptibility to contamination of transient, non-community public ground-water supplies in Indiana: U.S. Geological Survey Scientific Investigations Report 2005–5059, p. 1–39, accessed September 1, 2022, at https://doi.org/10.3133/sir20055059.
Becker, M.W., Collins, S.A., Metge, D.W., Harvey, R.W., and Shapiro, A.M., 2004, Effect of cell physicochemical characteristics and motility on bacterial transport in groundwater: Journal of Contaminant Hydrology, v. 69, nos. 3–4, p. 195–213, accessed September 1, 2022, at https://doi.org/10.1016/j.jconhyd.2003.08.001.
Becker, M.W., Metge, D.W., Collins, S.A., Shapiro, A.M., and Harvey, R.W., 2005, Bacterial transport experiments in fractured crystalline bedrock: Groundwater, v. 41, no. 5, p. 682–689, accessed September 1, 2022, at https://doi.org/10.1111/j.1745-6584.2003.tb02406.x.
Belitz, K., Watson, E., Johnson, T.D., and Sharpe, J.B., 2018, Data release for secondary hydrogeologic regions of the conterminous United States (ver. 2.0, June 2022): U.S. Geological Survey data release, accessed September 1, 2022, at https://doi.org/10.5066/F7F76BSS.
Belitz, K., Watson, E., Johnson, T.D., and Sharpe, J., 2019, Secondary hydrogeologic regions of the conterminous United States: Groundwater, v. 57, no. 3, p. 367–377, accessed September 1, 2022, at https://doi.org/10.1111/gwat.12806.
Czymmek, K., Geohring, L., Lendrum, J., Wright, P., Albrecht, G., Brower, B., and Ketterings, Q., 2011, Manure management guidelines for limestone bedrock/karst areas of Genesee County, New York—Practices for risk reduction: Ithaca, N.Y., Cornell University Animal Science Publication Series No. 240, p. 1–9, accessed September 1, 2022, at http://nmsp.cals.cornell.edu/publications/files/Karst_2_15_2011.pdf.
Doctor, D.H., Jones, J., Wood, N., Falgout, J., and Rapstine, N.I., 2020, Progress toward a preliminary karst depression density map for the conterminous United States, in Proceedings of the Sixteenth Sinkhole Conference: Sinkhole Conference 2020, National Cave and Karst Research Institute Symposium 8, p. 315–326, accessed September 1, 2022, at https://doi.org/10.5038/9781733375313.1003.
Erickson, M.L., Yager, R.M., Kauffman, L.J., and Wilson, J.T., 2019, Drinking water quality in the glacial aquifer system, northern USA: Science of the Total Environment, v. 694, 14 p., accessed September 1, 2022, at https://doi.org/10.1016/j.scitotenv.2019.133735.
Falcone, J.A., 2016, U.S. block-level population density rasters for 1990, 2000, and 2010: U.S. Geological Survey data release, accessed September 1, 2022, at https://doi.org/10.5066/F74J0C6M.
Focazio, M.J., Reilly, T.E., Rupert, M.G., and Helsel, D.R., 2002, Assessing ground-water vulnerability to contamination—Providing scientifically defensible information for decision makers: U.S. Geological Survey Circular 1224, 33 p., accessed September 1, 2022, at https://doi.org/10.3133/cir1224.
Gburek, W.J., and Folmar, G.J., 1999, A groundwater recharge field study—Site characterization and initial results: Hydrological Processes, v. 13, no. 17, p. 2813–2831, accessed September 1, 2022, at https://doi.org/10.1002/(SICI)1099-1085(19991215)13:17<2813::AID-HYP901>3.0.CO;2-6.
Gleeson, T., Novakowski, K., and Kyser, T.K., 2009, Extremely rapid and localized recharge to a fractured rock aquifer: Journal of Hydrology, v. 376, nos. 3–4, p. 496–509, accessed September 1, 2022, at https://doi.org/10.1016/j.jhydrol.2009.07.056.
Harvey, R.W., Metge, D.W., Shapiro, A.M., Renken, R.A., Osborn, C.L., Ryan, J.N., Cunningham, K.J., and Landkamer, L., 2008, Pathogen and chemical transport in the karst limestone of the Biscayne aquifer—3. Use of microspheres to estimate the transport potential of Cryptosporidium parvum oocysts: Water Resources Research, v. 44, no. 8, 12 p., accessed September 1, 2022, at https://doi.org/10.1029/2007WR006060.
Holtschlag, D.J., and Luukkonen, C.L., 1997, Vulnerability of ground water to atrazine leaching in Kent County, Michigan: U.S. Geological Survey Water-Resources Investigations Report 96–4198, accessed September 1, 2022, at https://doi.org/10.3133/wri964198.
Homer, C., Dewitz, J., Jin, S., Xian, G., Costello, C., Danielson, P., Gass, L., Funk, M., Wickham, J., Stehman, S., Auch, R., and Riitters, K., 2020, Conterminous United States land cover change patterns 2001–2016 from the 2016 National Land Cover Database: ISPRS Journal of Photogrammetry and Remote Sensing, v. 162, p. 184–199, accessed September 1, 2022, at https://doi.org/10.1016/j.isprsjprs.2020.02.019.
Hrudey, S.E., Payment, P., Huck, P.M., Gillham, R.W., and Hrudey, E.J., 2003, A fatal waterborne disease epidemic in Walkerton, Ontario—Comparison with other waterborne outbreaks in the developed world: Water Science and Technology, v. 47, no. 3, p. 7–14, accessed September 1, 2022, at https://doi.org/10.2166/wst.2003.0146.
John, D.E., and Rose, J.B., 2005, Review of factors affecting microbial survival in groundwater: Environmental Science & Technology, v. 39, no. 19, p. 7345–7356, accessed September 1, 2022, at https://doi.org/10.1021/es047995w.
Johnson, T.D. and Belitz, K., 2019, Domestic well locations and populations served in the contiguous U.S.—Datasets for decadal years 2000 and 2010: U.S. Geological Survey data release, accessed September 1, 2022, at https://doi.org/10.5066/P9FSLU3B.
Johnson, T.D., Belitz, K., Kauffman, L.J., Watson, E., and Wilson, J.T., 2022, Populations using public-supply groundwater in the conterminous U.S. 2010; Identifying the wells, hydrogeologic regions, and hydrogeologic mapping units: Science of the Total Environment, v. 806, 15 p., accessed September 1, 2022, at https://doi.org/10.1016/j.scitotenv.2021.150618.
Jones, J.M., Doctor, D.H., Wood, N.J., Falgout, J.T., and Rapstine, N.I., 2021, Closed depression density in karst regions of the conterminous United States—Features and grid data: U.S. Geological Survey data release, accessed September 1, 2022, at https://doi.org/10.5066/P9EV2I12.
Kappel, W.M., Reddy, J.E., and Root, J.C., 2020, Statewide assessment of karst aquifers in New York with an inventory of closed-depression and focused-recharge features: U.S. Geological Survey Scientific Investigations Report 2020–5030, 74 p., accessed September 1, 2022, at https://doi.org/10.3133/sir20205030.
Lacombe, P.J., 2011, Mass of chlorinated volatile organic compounds removed by Pump-and-Treat, Naval Air Warfare Center, West Trenton, New Jersey, 1996–2010: U.S. Geological Survey Scientific Investigations Report 2011–5003, 48 p., accessed September 1, 2022, at https://doi.org/10.3133/sir20115003.
Liu, J., Kleinman, P.J.A., Aronsson, H., Flaten, D., McDowell, R.W., Bechmann, M., Beegle, D.B., Robinson, T.P., Bryant, R.B., Liu, H., Sharpley, A.N., and Veith, T.L., 2018, A review of regulations and guidelines related to winter manure application: Ambio, v. 47, no. 6, p. 657–670, accessed September 1, 2022, at https://doi.org/10.1007/s13280-018-1012-4.
Masterson, J.P., and Walter, D.A., 2000, Delineation of groundwater recharge areas, western Cape Cod, Massachusetts: U.S. Geological Survey Water-Resources Investigations Report 2000–4000, 1 p., accessed September 1, 2022, at https://doi.org/10.3133/wri004000.
Miles, O.W., and Novakowski, K.S., 2016, Large water-table response to rainfall in a shallow bedrock aquifer having minimal overburden cover: Journal of Hydrology, v. 541, Part B, p. 1316–1328, accessed September 1, 2022, at https://doi.org/10.1016/j.jhydrol.2016.08.034.
Muldoon, M.A., Borchardt, M.A., Spencer, S.K., Hunt, R.J., and Owens, D., 2018, Using enteric pathogens to assess sources of fecal contamination in the Silurian dolomite aquifer—Preliminary results, in White, W., Herman, J., Herman, E., and Rutigliano, M., eds., Karst groundwater contamination and public health: Cham, Switzerland, Springer, p. 209–213, accessed September 1, 2022, at https://doi.org/10.1007/978-3-319-51070-5_23.
Murphy, H.M., McGinnis, S., Blunt, R., Stokdyk, J., Wu, J., Cagle, A., Denno, D.M., Spencer, S., Firnstahl, A., and Borchardt, M.A., 2020, Septic systems and rainfall influence human fecal marker and indicator organism occurrence in private wells in southeastern Pennsylvania: Environmental Science & Technology, v. 54, no. 6, p. 3159–3168, accessed September 1, 2022, at https://doi.org/10.1021/acs.est.9b05405.
National Academies of Sciences, Engineering, and Medicine, 2015, Characterization, modeling, monitoring, and remediation of fractured rock: Washington, D.C., The National Academies Press, 176 p., accessed September 1, 2022, at https://doi.org/10.17226/21742.
National Research Council, 1993, Ground water vulnerability assessment—Predicting relative contamination potential under conditions of uncertainty: Washington, D.C., The National Academies Press, 224 p., accessed September 1, 2022, at https://doi.org/10.17226/2050.
National Research Council, 1996, Rock fractures and fluid flow—Contemporary understanding and applications: Washington, D.C., The National Academies Press, 568 p., accessed September 1, 2022, at https://doi.org/10.17226/2309.
Newman, J., and McGroarty, P., 2019, Farms, more productive than ever, are poisoning drinking water in rural America: The Wall Street Journal, New York, Dow Jones & Company, January 18, 2019, accessed July 25, 2022, at https://www.wsj.com/articles/farms-more-productive-than-ever-are-poisoning-drinking-water-in-rural-america-11547826031.
Nolan, B.T., Hitt, K.J., and Ruddy, B.C., 2002, Probability of nitrate contamination of recently recharged groundwaters in the conterminous United States: Environmental Science & Technology, v. 36, no. 10, p. 2138–2145, accessed September 1, 2022, at https://doi.org/10.1021/es0113854.
Norris, S.E., and Fidler, R.E., 1969, Hydrogeology of the Scioto River Valley near Piketon, south-central Ohio: U.S. Geological Survey Water Supply Paper 1872, 70 p., 4 pl., accessed September 1, 2022, at https://doi.org/10.3133/wsp1872.
Ohlsson, Y., and Neretnieks, I., 1997, Diffusion data in granite recommended values: Swedish Nuclear Fuel and Waste Management Company (SKB) Technical Report 97–20, 15 p., accessed September 1, 2022, at https://www.skb.com/publication/13611/TR97-20webb.pdf.
Owens, D.W., Hunt, R.J., Firnstahl, A.D., Muldoon, M.A., and Borchardt, M.A., 2019, Automated time series measurement of microbial concentrations in groundwater-derived water supplies: Groundwater, v. 57, no. 2, p. 329–336, accessed September 1, 2022, at https://doi.org/10.1111/gwat.12822.
Puckett, L.J., 1994, Nonpoint and point sources of nitrogen in major watersheds of the United States: U.S. Geological Survey Water-Resources Investigations Report 94–4001, 9 p., accessed September 1, 2022, at https://doi.org/10.3133/wri944001.
Rupert, M.G., 1999, Improvements to the DRASTIC ground-water vulnerability mapping method: U.S. Geological Survey Fact Sheet 066–9, 6 p., accessed September 1, 2022, at https://doi.org/10.3133/fs06699.
Sang, Y.-F., 2013, A review on the applications of wavelet transform in hydrology time series analysis: Atmospheric Research, v. 122, p. 8–15, accessed September 1, 2022, at https://doi.org/10.1016/j.atmosres.2012.11.003.
Seyoum, W.M., and Eckstein, Y., 2014, Hydraulic relationships between buried valley sediments of the glacial drift and adjacent bedrock formations in northeastern Ohio, USA: Hydrogeology Journal, v. 22, no. 5, p. 1193–1206, accessed September 1, 2022, at https://doi.org/10.1007/s10040-014-1128-y.
Shangguan, W., Hengl, T., Mendes de Jesus, J., Yuan, H., and Dai, Y., 2017, Mapping the global depth to bedrock for land surface modeling: Journal of Advances in Modeling Earth Systems, v. 9, no. 1, p. 65–88, accessed September 1, 2022, at https://doi.org/10.1002/2016MS000686.
Shapiro, A.M., 1987, Transport equations for fractured porous media, in Bear, J., and Corapcioglu, M.Y., eds., Advances in transport phenomena in porous media: Dordrecht, Springer, p. 405–471, accessed September 1, 2022, at https://doi.org/10.1007/978-94-009-3625-6_10.
Shapiro, A.M., 2001, Effective matrix diffusion in kilometer-scale transport in fractured crystalline rock: Water Resources Research, v. 37, no. 3, p. 507–522, accessed September 1, 2022, at https://doi.org/10.1029/2000WR900301.
Shapiro, A.M., and Day-Lewis, F.D., 2021, Estimating and forecasting time-varying groundwater recharge in fractured rock—A state-space formulation with preferential and diffuse flow to the water table: Water Resources Research, v. 57, no. 9, e2020WR029110, accessed September 1, 2022, at https://doi.org/10.1029/2020WR029110.
Shapiro, A.M., Day-Lewis, F.D., Kappel, W.M., and Williams, J.H., 2022, Incorporating snowmelt into daily estimates of recharge using a state-space model of infiltration: Groundwater, Early View article posted May 7, 2022, 26 p., accessed September 1, 2022, at https://doi.org/10.1111/gwat.13206.
Shapiro, A.M., Evans, C.E., and Hayes, E.C., 2017, Porosity and pore size distribution in a sedimentary rock—Implications for the distribution of chlorinated solvents: Journal of Contaminant Hydrology, v. 203, p. 70–84, accessed September 1, 2022, at https://doi.org/10.1016/j.jconhyd.2017.06.006.
Shapiro, A.M., Hsieh, P.A., Burton, W.C., and Walsh, G.J., 2007, Integrated multi-scale characterization of ground-water flow and chemical transport in fractured crystalline rock at the Mirror Lake site, New Hampshire, in Hyndman, D.W., Day-Lewis, F.D., and Singha, K., eds., Subsurface Hydrology—Data integration for properties and processes: Washington, D.C., American Geophysical Union, Geophysical Monograph Series, v. 171, p. 201–225, accessed September 1, 2022, at https://doi.org/10.1029/171GM15.
Shapiro, A.M., Tiedeman, C.R., Imbrigiotta, T.E., Goode, D.J., Hsieh, P.A., Lacombe, P.J., DeFlaun, M.F., Drew, S.R., and Curtis, G.P., 2018, Bioremediation in fractured rock—2. Mobilization of chloroethene compounds from the rock matrix: Groundwater, v. 56, no. 2, p. 317–336, accessed September 1, 2022, at https://doi.org/10.1111/gwat.12586.
Squillace, P.J., and Moran, M.J., 2000, Estimating the likelihood of MTBE occurrence in drinking water supplied by ground-water sources in the Northeast and Mid-Atlantic regions of the United States: U.S. Geological Survey Open-File Report 2000–343, 10 p., accessed September 1, 2022, at https://doi.org/10.3133/ofr00343.
Tiedeman, C.R., and Shapiro, A.M., 2022, Contributing areas to domestic wells in dipping sedimentary rocks under extreme recharge events: Groundwater, v. 60, no. 4, p. 460–476, accessed September 1, 2022, at https://doi.org/10.1111/gwat.13169.
Tiedeman, C.R., Shapiro, A.M., Hsieh, P.A., Imbrigiotta, T.E., Goode, D.J., Lacombe, P.J., DeFlaun, M.F., Drew, S.R., Johnson, C.D., Williams, J.H., and Curtis, G.P., 2018, Bioremediation in fractured rock—1. Modeling to inform design, monitoring, and expectations: Groundwater, v. 56, no. 2, p. 300–316, accessed September 1, 2022, at https://doi.org/10.1111/gwat.12585.
U.S. Department of Agriculture, 1994, State Soil Geographic (STATSGO) Data Base, Data use information: U.S. Department of Agriculture Miscellaneous Publication Number 1492, Fort Worth, Tex., 35 p., accessed September 1, 2022, at http://www.fsl.orst.edu/pnwerc/wrb/metadata/soils/statsgo.pdf.
U.S. Department of Agriculture, 2017, Watershed Boundary Dataset downloads: U.S. Department of Agriculture, National Resources Conservation Service, accessed September 1, 2022, at https://nrcs.app.box.com/v/huc.
U.S. Environmental Protection Agency [EPA], 1997, State source water assessment and protection programs guidance—Final guidance: U.S. Environmental Protection Agency, EPA816-R-97-009, 127 p., accessed September 1, 2022, at https://semspub.epa.gov/work/HQ/124655.pdf.
U.S. Environmental Protection Agency [EPA], 2021, National Primary Drinking Water Regulations: U.S. Environmental Protection Agency web page, accessed September 1, 2022, at https://www.epa.gov/ground-water-and-drinking-water/national-primary-drinking-water-regulations.
U.S. Geological Survey [USGS], 2003, Principal aquifers of the United States: U.S. Geological Survey web page, accessed September 1, 2022, at https://www.usgs.gov/mission-areas/water-resources/science/principal-aquifers-united-states?qt-science_center_objects=0#qt-science_center_objects.
U.S. Geological Survey [USGS], 2020, Public supply wells [of the United States]: U.S. Geological Survey web page, accessed September 1, 2022, at https://www.usgs.gov/mission-areas/water-resources/science/public-supply-wells?qt-science_center_objects=0#qt-science_center_objects.
Weary, D.J., and Doctor, D.H., 2014, Karst in the United States—A digital map compilation and database: U.S. Geological Survey Open-File Report 2014–1156, 27 p., accessed September 1, 2022, at https://doi.org/10.3133/ofr20141156.
Wolock, D.M., 1997, STATSGO soil characteristics for the conterminous United States: U.S. Geological Survey Open-File Report 97–656, accessed September 1, 2022, at https://water.usgs.gov/GIS/metadata/usgswrd/XML/muid.xml.
Wood, W.W., Shapiro, A.M., Hsieh, P.A., and Councell, T.B., 1996, Observational, experimental and inferred evidence for solute diffusion in fractured granite aquifers—Examples from the Mirror Lake watershed, Grafton County, New Hampshire, in Morganwalp, D.W., and Aronson, D.A., eds., U.S. Geological Survey Toxic Substances Hydrology Program—Proceedings of the technical meeting, Colorado Springs, Colorado, September 20–24, 1993: U.S. Geological Survey Water-Resources Investigations Report 94–4015, p. 167–170, accessed September 1, 2022, at https://doi.org/10.3133/wri944015.
Zell, W.O., and Sanford, W.E., 2020a, Calibrated simulation of the long-term average surficial groundwater system and derived spatial distributions of its characteristics for the contiguous United States: Water Resources Research, v. 56, no. 8, e2019WR026724, accessed September 1, 2022, at https://doi.org/10.1029/2019WR026724.
Zell, W.O., and Sanford, W.E., 2020b, MODFLOW 6 models used to simulate the long-term average surficial groundwater system for the contiguous United States: U.S. Geological Survey data release, accessed September 1, 2022, at https://water.usgs.gov/GIS/metadata/usgswrd/XML/zell2020_wrr.xml.
Conversion Factors
U.S. customary units to International System of Units
Abbreviations
CONUS
conterminous United States
HUC
Hydrologic Unit Code
km
kilometer
MCL
Maximum Contaminant Level
MCLG
Maximum Contaminant Level Goal
m
meter
m/d
meter per day
NLCD
National Land Cover Database
NRC
National Research Council
PA
principal aquifer
SHR
secondary hydrogeologic region
STATSGO
State Soil Geographic Data Base
USDA
U.S. Department of Agriculture
USEPA
U.S. Environmental Protection Agency
USGS
U.S. Geological Survey
Suggested Citation
Shapiro, A.M., and Falcone, J.A., 2022, Mapping areas of groundwater susceptible to transient contamination events from rapid infiltration into shallow fractured-rock aquifers in agricultural regions of the conterminous United States: U.S. Geological Survey Open-File Report 2022–1093, 25 p., https://doi.org/10.3133/ofr20221093.
ISSN: 2331-1258 (online)
Study Area
| Publication type | Report |
|---|---|
| Publication Subtype | USGS Numbered Series |
| Title | Mapping areas of groundwater susceptible to transient contamination events from rapid infiltration into shallow fractured-rock aquifers in agricultural regions of the conterminous United States |
| Series title | Open-File Report |
| Series number | 2022-1093 |
| DOI | 10.3133/ofr20221093 |
| Year Published | 2022 |
| Language | English |
| Publisher | U.S. Geological Survey |
| Publisher location | Reston, VA |
| Contributing office(s) | WMA - Earth System Processes Division |
| Description | v, 25 p. |
| Country | United States |
| Other Geospatial | Conterminous United States |
| Online Only (Y/N) | Y |
| Additional Online Files (Y/N) | N |
| Google Analytic Metrics | Metrics page |