

Evaluation of Fish Behavior at the Entrances to a Selective Water Withdrawal Structure in Lake Billy Chinook, Oregon, 2021
Links
- Document: Report (36.1 MB pdf) , HTML , XML
- Download citation as: RIS | Dublin Core
Acknowledgments
This study was completed with assistance from many people and organizations. Portland General Electric staff at Lake Billy Chinook and Round Butte Dam, especially Gonzalo Mendez, Wesley McDaniel, Emmanuel Davila-Santiago, Jennifer Burns, Phoebe Hill, Micah Bennett and Renny Schmidt were instrumental in coordinating our activities, installing equipment, monitoring the imaging sonar at the surface water withdrawal structure, and reviewing this report. Our administrative and science colleagues at the Columbia River Research Laboratory substantially contributed to this study. This report was improved by reviews of Nolan Banish and Lisa Wetzel, consistent with USGS Fundamental Science Practices. Data are not currently available from Portland General Electric. Contact Portland General Electric for further information.
Abstract
Imaging sonar was used to assess the behavior, abundance, and timing of fish at the entrances to the Selective Water Withdrawal (SWW) intake structure located in the forebay of Round Butte Dam, Oregon during the spring of 2021. The purposes of the SWW are (1) to direct surface currents in the forebay to attract and collect downriver migrating juvenile salmonid smolts (Chinook salmon [Oncorhynchus tshawytscha], sockeye salmon [O. nerka], and steelhead [O. mykiss]) from Lake Billy Chinook and (2) to enable operators of the SWW to withdraw water from surface and benthic elevations in the reservoir to manage downriver water temperatures. Part of the evaluation, to determine how well the structure performs at collecting juvenile salmonids, needs (A) to regularly assess how fish are approaching the entrance, and (B) to determine if operational flows could be optimized to increase the attraction of smolts present in the forebay of Lake Billy Chinook. The primary goals of this study were (1) to assess the abundance and behaviors of smolt-size fish observed near the SWW and (2) to provide data of the effect of two-night generation operation timing conditions on movements and behaviors of fish near the entrance to the SWW structure. The purpose of this assessment is to improve downstream passage solutions.
Two imaging sonar units were deployed during the spring 2021 smolt out-migration period. One unit monitored fish movements near the south entrance and one unit monitored movements near the north entrance of the SWW. Both smolt and bull trout (Salvelinus confluentus)-size fish were regularly observed near the entrances with greater abundances observed during night, corresponding with greater discharge through the SWW than during the day when discharge was reduced. Differences in fish abundance were observed between the night generation operation timing conditions, with increased fish counts observed when elevated discharge was extended to 6:00 a.m., rather than when discharges have been traditionally reduced in the early morning at 4:00 a.m. Fish of all size groups were primarily observed near the center of the SWW, and greater abundances of fish were observed at the south entrance. Increased counts of bull trout-size fish coincided with the increased abundances of smolt-size fish. Overall, the results indicate that (A) smolt-size fish were more abundant near the entrance of the SWW during periods of increased discharge, (B) bull trout-size fish were present at the SWW, and (C) fish were more numerous at the SWW when night generation operation timing was extended later into the morning hours rather than the traditional operation timing flow reduction.
Introduction
Portland General Electric Company (PGE) and the Confederated Tribes of the Warm Springs Reservation of Oregon (CTWSRO) own and operate the Pelton Round Butte Hydroelectric Project (Project) in central Oregon, which includes a series of three dams in the Deschutes River Canyon (fig. 1). The primary purpose of the Project is hydroelectric power generation, but it also provides flood-risk management and water for instream flows for wildlife and opportunities for recreation. Round Butte Dam is the largest hydroelectric dam in the state of Oregon; it is on the Deschutes River in central Oregon, approximately 16 kilometers southwest of Madras. The dam, completed in 1964, impounds Lake Billy Chinook just downstream from the tributary confluences of the Metolius, Deschutes, and Crooked Rivers. A juvenile bypass system intended for routing anadromous Chinook salmon (Oncorhynchus tshawytscha), sockeye salmon (O. nerka), and steelhead (O. mykiss) smolts around the dam operated after dam construction; however, low attraction flow and confounding forebay surface currents resulted in minimal collection, and fish passage operations stopped in 1966 (Korn and others, 1967; Baker-Jud, 2006). To restore fish passage of juvenile salmonids, PGE and CTWSRO determined that a surface water collection facility was required as a part of a water quality improvement and comprehensive fish passage plan mandated by the Federal Energy Regulatory Commission for Project relicensing (Portland General Electric Company 2004; Federal Energy Regulatory Commission, 2005). The use of these collection devices is preferable because they offer a pre-passage alternative to common spillway and turbine routes, which have been associated with elevated mortality rates (Sweeney and others, 2007; Keefer and others, 2013). Previous studies in other reservoirs have found that surface collection and bypass can be a viable method to improve survival of outmigrating smolts (Sweeney and others, 2007; Adams and others, 2014).
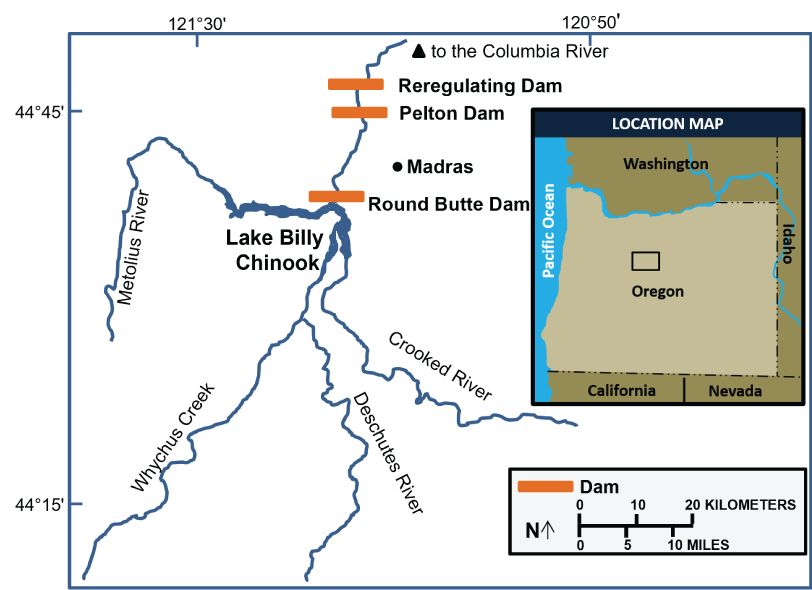
Map image of Deschutes River showing Round Butte Dam and Lake Billy Chinook, Oregon.
In 2009, a Selective Water Withdrawal (SWW) facility installed in the forebay of Lake Billy Chinook alongside Round Butte Dam began operation. The purpose of the SWW is twofold. First, the SWW directs surface currents in the forebay toward the intake structure and attracts downriver migrating juvenile salmonid smolts (hereafter referred to as smolts) including Chinook salmon, sockeye salmon, and steelhead into the SWW entrances where they may be collected for subsequent transport around the Project. Second, the SWW allows operators to withdraw reservoir water from surface and benthic elevations from the Lake Billy Chinook forebay to manage water temperatures in the Deschutes River downriver of Round Butte Dam.
A 2020 imaging sonar study conducted at the SWW reported that many fish were present near the entrance to the SWW when daily project operations generally initiated a decrease in flow through the SWW, potentially reducing fish collection (Smith and others, 2022). For this current study, operation changes were instituted in 2021 to examine the effect of two flow timing conditions on movements and behaviors of fish near the entrance to the SWW. For the duration of this study, the SWW was operated with two discharge intervals, changing approximately every two weeks: (1) a Traditional condition, seven hours at a target of 4,500 cubic feet per second (ft3/s) from 9:00 p.m. to 4:00 a.m., and (2) a Delayed condition, seven hours at a target of 4,500 ft3/s from 11:00 p.m. to 6:00 a.m.
This study used data recorded from imaging sonar to summarize the presence and behavior of juvenile salmonids and predator presence at the SWW during the spring of 2021. Information about fish arrival timing, abundance, movement, and behavior at the SWW during operating flow conditions can inform operation decisions about downstream passage alternatives. This information should enable a better characterization of the response of smolts in relation to biological and environmental factors such as fish size, discharge, and the presence of piscivorous fish such as bull trout (Salvelinus confluentus). Imaging sonar is capable of recording near-video quality sonar images in various habitats and environmental conditions (Tiffan and others, 2005; Doehring and others, 2011; Able and others, 2014). An advantage of using imaging sonar for behavioral observations of aquatic species is that the images are constructed from data collected from target ensonification and not from methods requiring visual observation. Therefore, data collection can occur in turbid conditions (Liedtke and others, 2013) without altering fish behavior or can be used at night without a supplemental light source to investigate diurnal effects, which are important behavioral factors for migrating salmonids (Dunbar, 2008; Pavlov and others, 2009). Data collected with the imaging sonar provides information on fish size, movement direction, habitat use, and fish travel speed.
The study was designed to provide information for the following objectives:
Methods
Study Area
Round Butte Dam is a 134-meter (m) high and 402-m wide, rockfill embankment dam. At the base of the dam is a powerhouse containing three Francis turbine units capable of generating a total of 324 megawatts (fig. 2). During normal operations, all water passing the dam goes through the powerhouse intake, located approximately 200-m upstream of the dam. An emergency spillway with a single radial gate is located to the west of the dam but is not used during normal dam operations. The 1,619-hectare (ha) Lake Billy Chinook has a storage capacity of 65,991 hectare-meters (ha-m), but a useable storage capacity of 33,797 ha-m. The forebay elevation typically fluctuates ±1 m during normal weather and project operations.
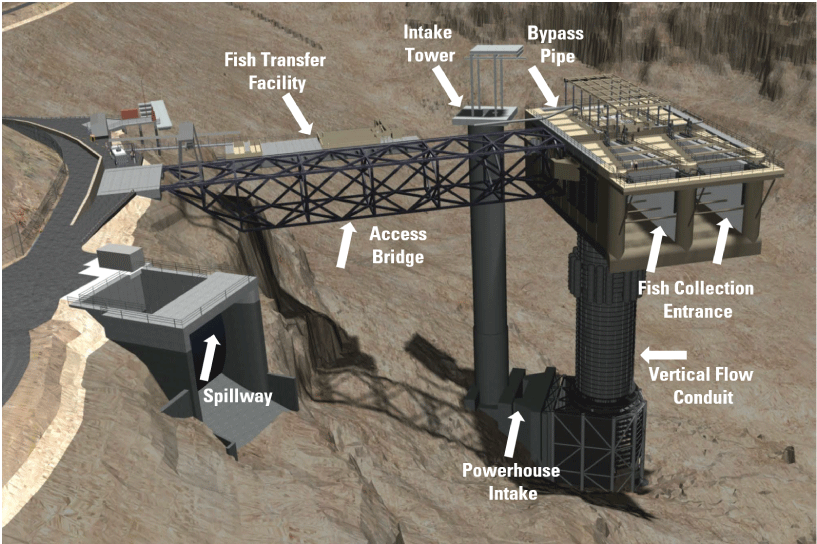
The above-water fish collection structure of the SWW (fig. 3) is approximately 27 × 46 × 18 m in size and has water drawn from the surface of the reservoir, that is directed to the power intake via a vertical flow conduit with a maximum inflow of 6,992 ft3/s. Discharge herein is presented in cubic feet per second (ft3/s), according to the local reporting conventions of both the U.S. Geological Survey (USGS) and PGE. In total, the SWW structure is 83 m in height. Fish enter either collector flume (9.6 m wide × 12.2 m deep), move past dewatering screens, and then pass directly into a pipe that delivers them into the fish transfer facility located alongside the SWW. At the fish transfer facility, fish are sorted and identified before being trucked and released into the Deschutes River downriver of the Project. The SWW collector is placed near the north shore of the reservoir and over the turbine intake. In 2021, from March 15 to June 15, the SWW followed a nighttime generation operation protocol whereby the Project attempted to maintain a nightly minimum flow of 4,500 ft3/s to increase attraction flow during periods of active smolt migration. For the duration of the study, the SWW was scheduled to operate with two discharge intervals changing approximately every two weeks: (1) Traditional condition, seven hours at a target of 4,500 ft3/s from 9:00 p.m. to 4:00 a.m., and (2) Delayed condition, seven hours at a target of 4,500 ft3/s during 11:00 p.m. to 6:00 a.m. Additional information on SWW operations and performance may be found in Smith and others (2022), Pyper and others (2017), and Portland General Electric Company and The Confederated Tribes of the Warm Springs Reservation of Oregon (2015, 2018).
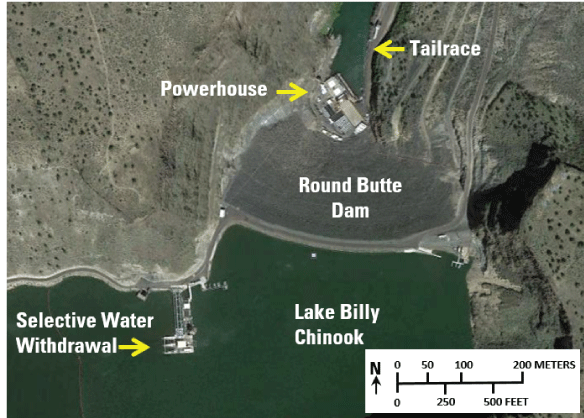
Selective Water Withdrawal structure at Round Butte Dam, Oregon. Photograph by Landsat, U.S. Geological Survey, April 25, 2019.
Selective Water Withdrawal tower and surface collector at Round Butte Dam, Lake Billy Chinook, Oregon. Image courtesy of Portland General Electric; used with permission.
Dam Operations and Environmental Conditions
Project discharge, forebay elevation, and water temperature data were summarized to document the environmental conditions that fish experienced from March 20 to June 21, 2021. Hourly data were collected and provided by PGE. Water temperature data were collected at a water quality monitoring station located in the forebay, and turbidity measurements were collected from the tailrace. Tributary inflow data were collected at the U.S. Geological Survey streamgages on the Deschutes and Crooked rivers near Culver, Oregon, (U.S. Geological Survey, 2021a, b), and the Metolius River near Grandview, Oregon (U.S. Geological Survey, 2021c). Data were summarized using hourly observations, but mean daily values were used to increase plot clarity.
Imaging Sonar Deployment and Data Processing
Adaptive resolution imaging sonar systems were used to collect data of fish movements immediately upstream of the SWW entrances. The sonars were operated at 1.8 MHz, with an operating range of 2–12 m. The sonars were attached to a pole-mounted platform located between the collector entrances and lowered to a depth of 3.5 m (fig. 4).
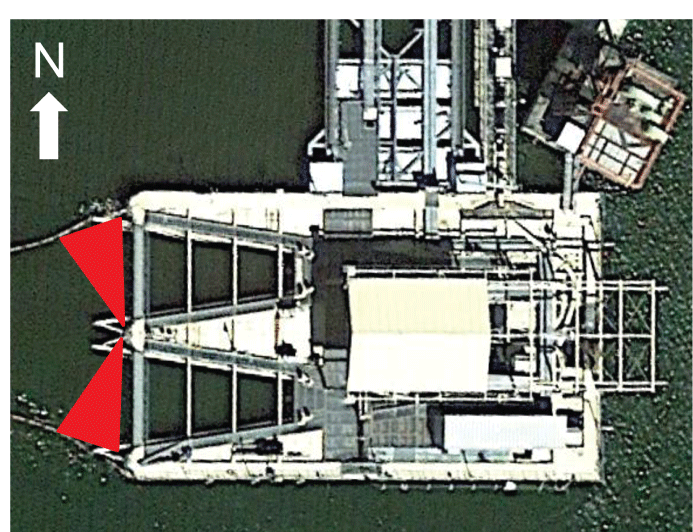
Lake Billy Chinook Selective Water Withdrawal surface collector and approximate coverage areas of the adaptive resolution imaging sonar units (red triangles) in the forebay at Round Butte Dam, Oregon, 2021. Photograph by Landsat, U.S. Geological Survey, April 25, 2019.
The imaging sonars collected data continuously at the SWW between March 20 and June 21, 2021 to coincide with the peak outmigration timing of salmonid smolts. Data collection was interrupted only when the SWW was non-operational because of maintenance or when equipment malfunctioned. All data collected were stored to hard drives for archival and subsequent processing. Over the duration of the study, 94 dates with complete 24-hour sampling periods were included in the analysis.
The image recognition and tracking programs used for identifying fish targets at the entrances used four types of software to prepare and process the collected acoustic signals. Initially, ARISFish software (Sound Metrics, 2018) removed acoustic noise from the collected files. Then, files were parsed to time sequential images using MATLAB software (The Math Works, 2019). Next, computer vision software, OpenCV (2020) was used to locate fish target positions in the sequential images. Finally, target tracking algorithms developed in Python software (Python Core Team, 2020) were applied to the located targets to determine individual fish behavioral and morphometric data.
Imaging sonar technology cannot distinguish individual fish that have entered and exited the field of view multiple times; therefore, the following analysis assumes that each fish track, not the fish, were independent observations. Additionally, it is not possible to definitively identify the species of fish observed; however, if discrete group sizes were present and identifiable through other methods (in other words, collection), informed inferences of species can be made. Despite these limitations, imaging sonar can be used to collect data that would otherwise be unattainable.
Summary statistics of fish targets derived from signal processing (mean length, direction, speed, and location in beams) were imported into SAS software (SAS Institute, 2012), for subsequent proofing and to merge imaging sonar data with the environmental data. Data were proofed to eliminate non-valid records or records that did not provide measurable morphometric or behavioral data. Target datasets were then exported for additional statistical analysis using R software (R Core Team, 2014).
Fish Size and Count
Fish targets were grouped into three size classes to distinguish between Chinook and sockeye smolt-size fish (95–190 millimeters [mm]), kokanee (lacustrine sockeye salmon O. nerka, 190–300 mm), steelhead smolt-size fish (190–300 mm), and adult bull trout (>350 mm). Kokanee, which are “landlocked,” non-migrating sockeye salmon, are returned to Lake Billy Chinook, rather than collected and passed downstream of the Project. Observations of kokanee were included in analysis with the smolts hereafter. In addition to fish size, run-timing allowed the approximate species differentiation between kokanee and steelhead with approximately 10 percent overlap in the two species occurring before and after April 24, 2021, as determined by observations of fish collected at SWW collection facility (Gonzalo Mendez, PGE, written commun., June 16, 2021). Fish 190–300 mm observed before April 24 were classified as kokanee, whereas fish of the same size class observed after April 24 were classified as steelhead. Fish 300–350 mm were not included in the analyses because of the overlap between large kokanee, large steelhead, and small bull trout, though observations were rare. In addition to bull trout, adult rainbow trout (O. mykiss), brown trout (Salmo trutta), and smallmouth bass (Micropterus dolomieu) are other known predators of salmonid smolts present in the reservoir that could be observed with the imaging sonar; however, these are seldom captured at the SWW. Additionally, although salmonid fry (<95 mm) were occasionally observed, those observations were not included in this analysis because of the inability to assign species classification.
Direction of Fish Travel
To summarize the directions of fish traveling near the entrances to the SWW under the Traditional and Delayed night generation operation timing conditions, we implemented circular statistics to calculate modes and measures of variability (Mardia and Jupp, 2000) using the circular package for R software (R Core Team, 2014). Tests for randomness were performed to determine if the sample population presented either uniform (random) or directed travel paths. If the data were found to conform to a Von Mises distribution (Zar, 1999; Pewsey and others, 2013), the Rayleigh z test was performed. Data that were multi-modal or did not follow a Von Mises distribution were subjected to the Rao’s spacing test (Batschelet, 1981). If the p value was significant (at the α=0.05 level), then it was assumed that the direction of fish travel was non-random.
The influence of discharge rates on the general direction of travel (toward or away from the SWW) of smolt size groups was analyzed. Discharge rates were binned in 1,000 ft3/s increments and were based on discharge values recorded at the time of fish observation. A chi-square goodness-of-fit test was performed to determine if the directions of travel were statistically different across discharge rates (Zar, 1999; Agresti, 1996). To determine a measure of effect size for tests of association for nominal variables, a variant of the Cramér's V for goodness-of-fit tests was calculated (Mangiafico, 2016). Cramér's V will vary from 0 to 1, where a value of 0 indicates no variation in category proportions (no effect) and a value of 1 indicates pronounced variation within category proportions (strong effect). Statistical analyses were done using R software (R Core Team, 2014) with package rcompanion for Cramér's V. A significance level of α=0.05 was used for all tests.
Track Characteristics
Fish-track characteristics were quantified using the travel speed variable obtained from individual fish tracks. Travel speed was calculated as the average travel velocity of each individual target. An analysis of variance (ANOVA) was used to determine the significance of the differences for fish sizes for observations at both the north and south entrances. If significant differences were found using ANOVA, an F-test by fish-size groups and Tukey’s Honestly Significant Difference (HSD) test (Sokal and Rohlf, 1969) were used to locate the pairwise differences in concentrations between groups. Additionally, two-sample t-tests were used to determine if there were differences in swimming velocity for each fish-size class observed between the two entrances. Statistical analyses were done using R software (R Core Team, 2014), with a significance level α=0.05.
Evaluating the Fish Track Density near the SWW Entrances
The collected point samples for each individual fish track were used to create two-dimensional density plots of unique fish track locations for the volume sampled. Individual data points were centered using a smooth kernel function at each observation point and then summed to get a density estimate using the MASS package for R software (R Core Team, 2014). The magnitude of the point count is defined as the count of unique observations of each individual fish location at each observation point. Datasets for each fish size group were used for plotting point location data.
Results
Dam Operations and Environmental Conditions
A combination of upper basin reservoir water storage for irrigation and lower than average rainfall and snowmelt resulted in reduced instream flows during March and early April than were normally experienced during the typical spring seasonal pattern on the Deschutes, Crooked, and Metolius Rivers (fig. 5). However, by about late-April, instream flows returned to near-median levels for the remainder of the observation period. The median hourly SWW discharge was 2,392.9 ft3/s (range 42.9–6,101.4 ft3/s; fig. 6; table 1). The spillway was not opened during the study, and all water passed through the SWW, with a peak daily discharge of 3,956.0 ft3/s occurring on April 28, 2021. The reservoir elevation was maintained at a constant daily elevation of nearly 1,944.6 feet above National Geodetic Vertical Datum of 1929 for the entirety of the study, with a 1.6-foot fluctuation (table 1). Water temperature generally increased through the study period, peaking at 19.0 degrees Celsius on June 4, 2021, whereas the lowest water temperature of 7.9 degree Celsius occurred on April 13, 2021 (table 1; fig. 6). The SWW was non-operational because of mechanical failure between March 24 and April 5. Fish observed during this period were not included in the general analysis; however, abundances and distributions are reported.
The target nighttime generation operation protocol discharge of >4,500 ft3/s was not constantly achieved for the entirety of the study because reduced reservoir inflow and the requirement of the Project to maintain a constant reservoir elevation. However, SWW discharges between 4,000 and 4,500 ft3/s were generally attained during the nighttime planned operation discharge. Although the SWW was scheduled to operate with two discharge intervals (Traditional and Delayed) changing approximately every two weeks, insufficient tributary inflow resulted in inconsistent operation timing. The resulting reduced-discharge operations caused imbalanced discharge intervals of 29 days of Traditional and 53 days of Delayed night generation operation timing.
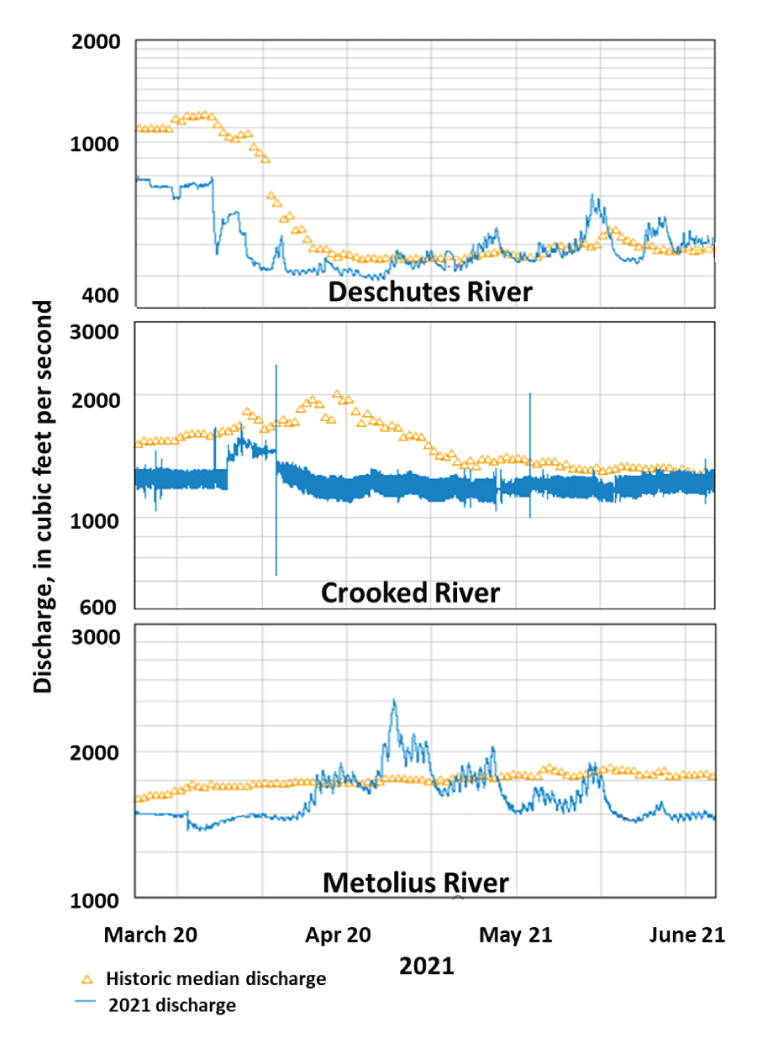
Discharges of Deschutes, Crooked, and Metolius Rivers from U.S. Geological Survey hydrological sites near Lake Billy Chinook, Oregon, March 20–June 21, 2021. Discharges (y-axes) are depicted in traditional non-linear intervals for visualizing detail in both high and low flow conditions. Graphs produced from data in U.S. Geological Survey (2021a, b, c).
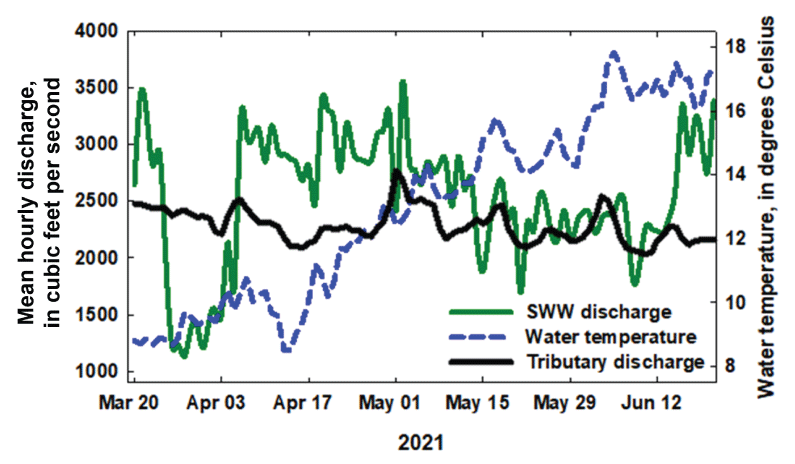
Selective Water Withdrawal (SWW) discharge, water temperature, and tributary discharge at Lake Billy Chinook, Oregon, March 20–June 21, 2021.
Table 1.
Summary statistics of hourly dam operations and environmental conditions at Round Butte Dam, Oregon, March 20–June 21, 2021.[Abbreviations: SD, standard deviation; ft3/s, cubic foot per second]
Fish Abundance
Data from the imaging sonars indicate that abundances of both smolt and bull trout-size fish near the entrances of the SWW varied while the migration season progressed (fig. 7). Abundance of fish observed on both imaging sonars generally were lowest during late-March and early-April, then trended upward to a peak abundance of 4,708 fish on May 10, before decreasing to a low of 240 fish on June 6. Fish observations were largely dominated by smolt-size fish; however, the daily abundance trends of adult bull trout-size fish were low (range 5–103 daily) and generally corresponded with that of the smolt-size fish.
In total, 120,564 fish observations were recorded, with nearly twice the number of fish observed at the south entrance (n=77,749) than at the north entrance (n=42,815; table 2). The Chinook and sockeye smolt-size fish group (95–190 mm) was the predominant size class observed, constituting 67 percent of the total observations. The steelhead and kokanee fish-size groups represented 22 and 9 percent of observations, respectively, whereas the adult bull trout-size group constituted 3 percent of total observations.
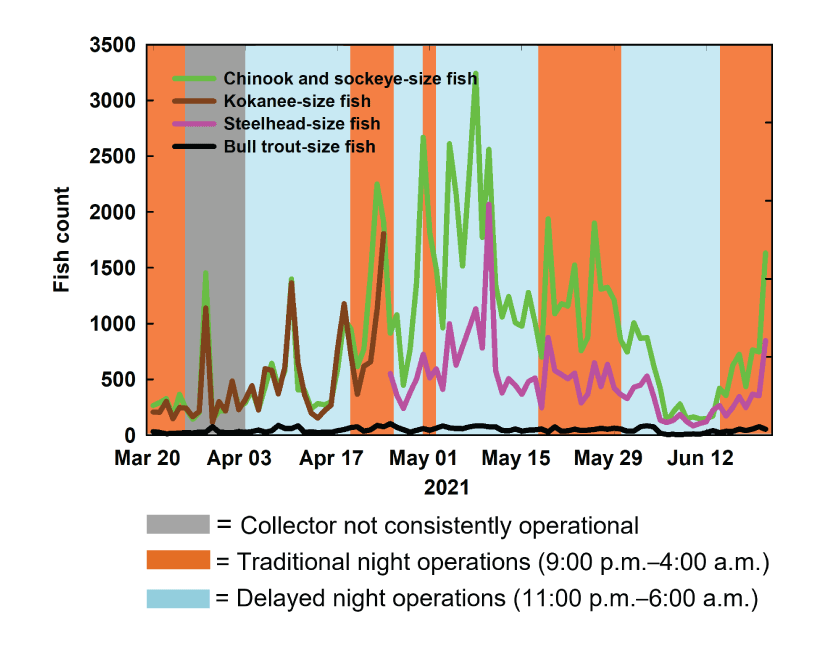
Graph showing daily count (on the date of detection) of smolt and bull trout-size fish at the collector entrances using the adaptive resolution imaging sonar at the Selective Water Withdrawal collector at Lake Billy Chinook, Oregon, 2021.
Table 2.
Count and size of smolt and bull trout-size fish at the location of detection at the collector entrances observed using the adaptive resolution sonars at the Selective Water Withdrawal collector at Lake Billy Chinook, Oregon, 2021.[Sample size is the number of fish observation events with the imaging sonars, not necessarily the number of individual fish, because a given fish could be observed more than once. Abbreviations: mm, millimeter; N, sample size; SD, standard deviation; >, greater than]
Direction of Travel
The predominant directions of travel for observed fish differed by entrance but were generally similar between the night generation operation timing conditions and the fish-size groups (table 3). All fish size groups observed with the imaging sonar units at both the north and south entrances had travel paths that were generally circular (figs. 8–11), with significant (Rao P<0.05) primary directions of travel that were directed toward the center of the SWW under both the Traditional (from 9:00 p.m. to 4:00 a.m.) and Delayed (from 11:00 p.m. to 6:00 a.m.) night generation operation timing conditions. The primary directions of travel of the steelhead, Chinook, and sockeye smolt-size fish groups were more directed toward the north entrance during the Traditional night generation operation timing condition, but more directed toward the south entrance during the Delayed night generation operation timing condition; however, rose plots had generally similar directional headings among groups (figs. 8, 9). The primary directions of travel of the kokanee-size fish groups were more directed toward the north entrance during the Delayed night generation operation timing condition, and more directed toward the south entrance during the Traditional night generation operation timing condition, with similar rose plot headings (fig. 10). Directions of bull trout-size fish observed at the north entrance were generally circular, whereas fish observed at the south entrance had primary directions of travel directed toward the center of the collector (fig. 11). Low concentration parameter (κ) values (range 0.38–0.95) for all criteria reflect a reduced concentration of the distribution toward a mean direction.
Table 3.
Mean travel directions and concentration parameter for smolt and bull trout-size fish observed using the adaptive resolution imaging sonar at the entrance of the Selective Water Withdrawal (SWW) collector at Lake Billy Chinook, Oregon, 2021.[Heading of the imaging sonar is normalized to 0 degrees, with a value of 270 degrees signifying a heading directly toward the SWW. Sample size is the number of fish observation events with the imaging sonar, not necessarily the number of individual fish, because a given fish could be observed more than once. Abbreviations: mm, millimeter; N, sample size; μ, mean travel direction (in degrees) of the fish; SE, standard error; κ, concentration parameter; >, greater than]
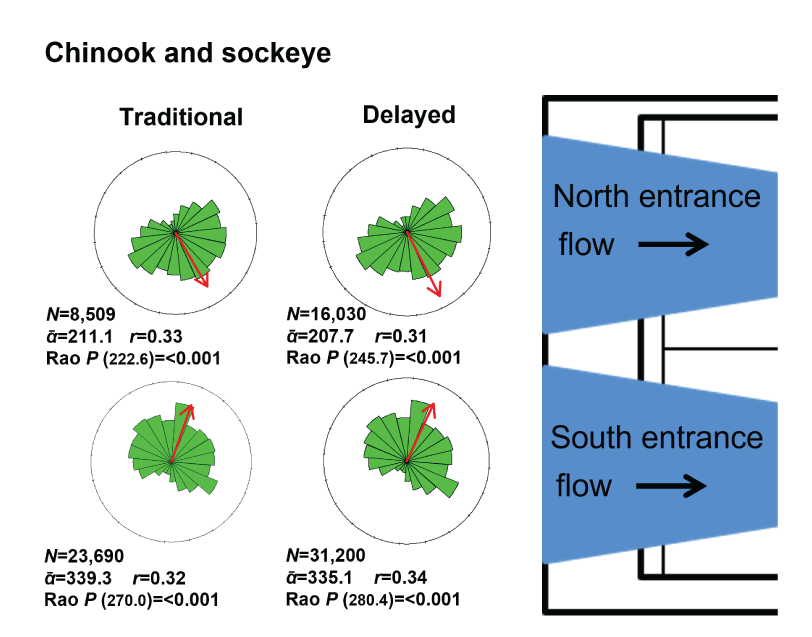
Mean travel directions (in degrees) for Chinook and sockeye smolt-size fish detected under Traditional and Delayed timing scenarios using the adaptive resolution imaging sonar at the entrance of the Selective Water Withdrawal collector at Lake Billy Chinook, Oregon, 2021. Heading of the imaging sonar is normalized to 0 degrees (top), with a value of 270 degrees signifying a heading directly toward the Selective Water Withdrawal collector. Sample sizes represent the number of fish (N) observed. Mean vectors (ᾱ) are described by arrows. Rao P indicates significance level according to the Rao spacing test statistic (in parenthesis). ft3/s, cubic feet per second; <, less than.
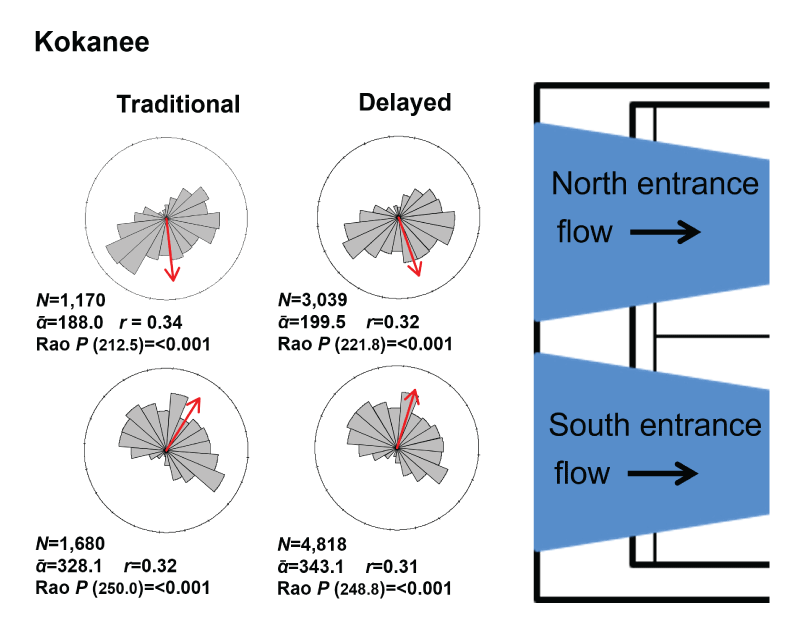
Mean travel directions (in degrees) for kokanee-size fish detected under Traditional and Delayed timing scenarios using the adaptive resolution imaging sonar at the entrance of the Selective Water Withdrawal collector at Lake Billy Chinook, Oregon, 2021. Heading of the imaging sonar is normalized to 0 degrees (top), with a value of 270 degrees signifying a heading directly toward the Selective Water Withdrawal collector. Sample sizes represent the number of fish (N) observed. Mean vectors (ᾱ) are described by arrows. Rao P indicates significance level according to the Rao spacing test statistic (in parenthesis). ft3/s, cubic feet per second; <, less than.
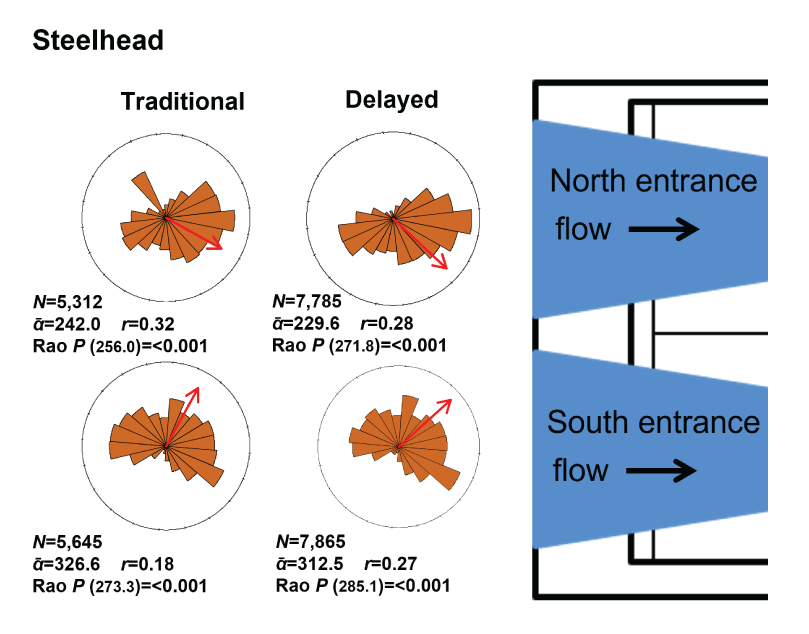
Mean travel directions (in degrees) for steelhead smolt-size fish detected under Traditional and Delayed timing scenarios using the adaptive resolution imaging sonar at the entrance of the Selective Water Withdrawal collector at Lake Billy Chinook, Oregon, 2021. Heading of the imaging sonar is normalized to 0 degrees (top), with a value of 270 degrees signifying a heading directly toward the Selective Water Withdrawal collector. Sample sizes represent the number of fish (N) observed. Mean vectors (ᾱ) are described by arrows. Rao P indicates significance level according to the Rao spacing test statistic (in parenthesis). ft3/s, cubic feet per second; <, less than.
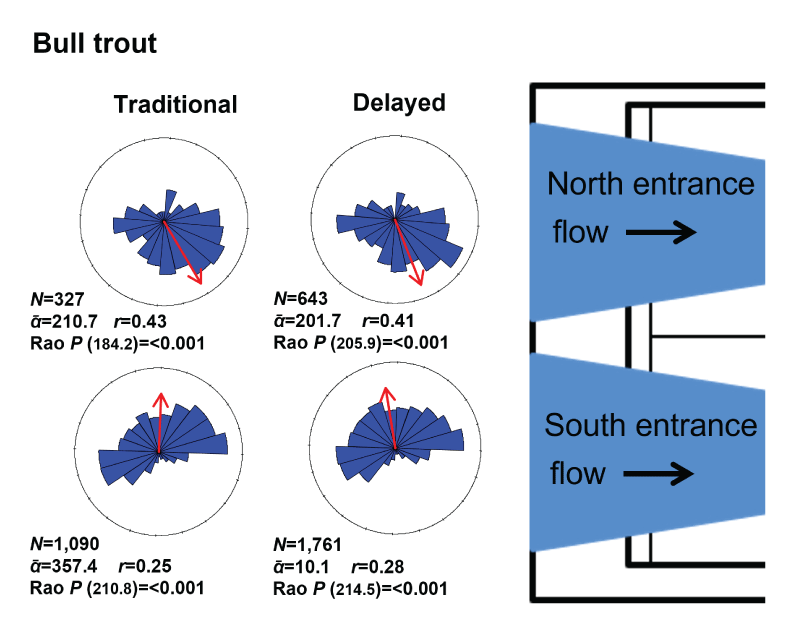
Mean travel directions (in degrees) for bull trout-size fish detected under Traditional and Delayed timing scenarios using the adaptive resolution imaging sonar at the entrance of the Selective Water Withdrawal collector at Lake Billy Chinook, Oregon, 2021. Heading of the imaging sonar is normalized to 0 degrees (top), with a value of 270 degrees signifying a heading directly toward the Selective Water Withdrawal collector. Sample sizes represent the number of fish (N) observed. Mean vectors (ᾱ) are described by arrows. Rao P indicates significance level according to the Rao spacing test statistic (in parenthesis). ft3/s, cubic feet per second; <, less than.
The general direction of travel of the three smolt-size fish groups near the entrance to the SWW depended on fish group, entrance, and sometimes discharge (fig. 12). Near the north entrance, the general directions of travel (either toward or away) of the Chinook and sockeye smolt-size fish group were generally toward the entrance when discharge through the SWW was less than 2,000 ft3/s with no strong effect indicated by Cramér’s V (table 4). However, when discharge was increased to greater than 2,000 ft3/s, the general direction of travel became near 50 percent, either toward or away from the entrance, but with a weak effect indicated by Cramér’s V. The directions for kokanee-size fish were like the Chinook and sockeye smolt-size fish group, with directions generally toward the entrance when discharge through the SWW was less than 2,000, and the general direction of travel became near 50 percent, either toward or away from the entrance when discharge was greater than 2,000 ft3/s, with low Cramér’s V scores indicating weak effects for travel direction (table 4). For steelhead smolt-size fish, the general directions of travel at all discharge rates were toward the entrance, with moderate effect values (Cramér’s V>0.34) at all discharge rates greater than 1,000 ft3/s (table 4).
Near the south entrance, the percentage of the Chinook and sockeye smolt-size group directed toward the south entrance was 42 to 54 percent with the highest rates observed at discharges between 2,000 and 3,000 ft3/s; however, all effects were weak as indicated by Cramér’s V (table 4). The direction of travel for the kokanee-size group was toward the south entrance at discharges less than 3,000 ft3/s, and away from the entrance at discharges greater than 3,000 ft3/s, with weak effects as indicated by Cramér’s V scores (table 4). The steelhead smolt-size group was directed toward the entrance at discharges greater than 2,000 ft3/s; however, Cramér’s V scores were low and indicate weak effects (table 4).
Table 4.
General direction of travel for smolt-size fish observed at binned flow increments using the adaptive resolution imaging sonar at the entrances of the Selective Water Withdrawal collector at Lake Billy Chinook, Oregon, 2021.[Direction is either toward or away from the collector. Sample size is the number of fish observation events with the imaging sonar, not necessarily the number of individual fish, because a given fish could be observed more than once. Abbreviations and symbols: mm, millimeter; ft3/s, cubic foot per second; N, sample size; %, percentage; χ2, Chi-square test; <, less than; >, greater than]
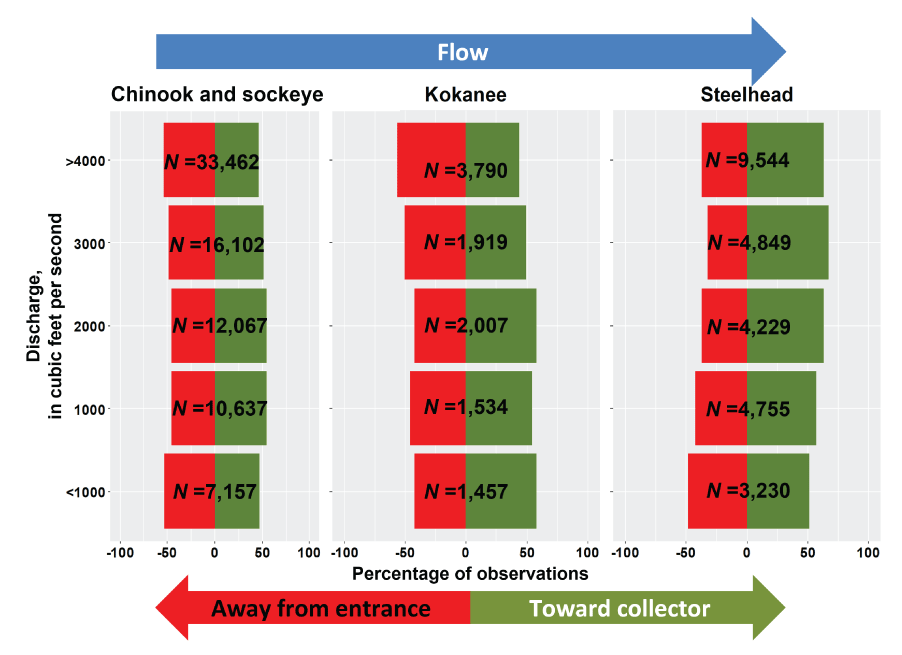
Directional travel for smolt-size fish observed at the collector entrances under different discharge levels using the adaptive resolution imaging sonars at the Selective Water Withdrawal collector at Lake Billy Chinook, Oregon, 2021. Sample sizes represent the number of smolt-size fish (N) observed.
Fish Swimming Velocity
The speed at which fish traveled at the entrances of the SWW generally differed between the fish-size classes but were similar between the two entrances, except for bull trout-size fish (table 5; fig. 13). For example, at the north entrance, the mean swimming velocity of Chinook and sockeye smolt-size fish was 0.32 meters per second (m/s; interquartile range [IQR]=0.29), 0.34 m/s (IQR=0.30) for kokanee-size fish, 0.33 m/s (IQR=0.31) for steelhead-size fish, and 0.31 m/s (IQR=0.29) for bull trout-size fish. These differences in fish swimming speed were significant between fish sizes (ANOVA; F3, 142,811=20.27, P<0.001) with mean swimming speeds varying irrespective of size groups. Results of the post hoc Tukey HSD test indicate that the swimming speeds of the Chinook and sockeye smolt-size group and the bull trout-size group were not significantly distinguishable from each other (P=0.28), nor was the steelhead smolt-size group and the kokanee size group and (P=0.12); whereas the remaining groups had significantly different swimming speeds from each other (P<0.001).
At the south entrance, the mean swimming velocity of fish were generally similar to the speeds of fish observed at the north entrance, with Chinook and sockeye smolt-size fish velocities at 0.33 m/s (IQR=0.30), 0.33 m/s (IQR=0.29) for kokanee-size fish, 0.36 m/s (IQR=0.32) for steelhead smolt-size fish, and 0.40 m/s (IQR=0.36) for bull trout-size fish. These differences in fish swimming speed also were significant between fish sizes (ANOVA; F3, 77,741=170.60, P<0.001). Results of the post hoc Tukey HSD test indicate that the swimming speeds of the Chinook and sockeye smolt-size group and the kokanee-size group were not significantly distinguishable from each other (P=0.32), whereas all other fish size groups had significantly different swimming speeds (P<0.01).
When observations of fish were compared between the north and south entrances, swimming velocities were statistically different for each of the fish-size groups (at the α=0.05 level) but were unlikely to be biologically significantly different for the smolt-size fish groups. For Chinook and sockeye smolt-size fish, mean swimming velocities were 0.01 m/s different between the two entrances but were significantly different (t; 79,423=6.19, P<0.001). Mean swimming velocities for kokanee-size fish were 0.01 m/s different between the two entrances and were significantly different (t; 10,705=3.44, P<0.001). Swimming velocities for steelhead-size fish were slightly faster at the south entrance (0.36 m/s) than at the north entrance (0.33 m/s) and were significantly different (t; 26,605=9.77, P<0.001). Bull trout-size fish had the greatest range in mean swimming velocities with a speed of 0.40 m/s at the south entrance, and 0.31 m/s at the north entrance, and were significantly different (t; 3,819=10.65, P<0.001).
Table 5.
Summary statistics for the swimming velocity of fish observed using the adaptive resolution imaging sonars at the entrances at the Selective Water Withdrawal collector at Lake Billy Chinook, Oregon, 2021.[All numbers in the table, except in the fish group, are in meters per second. Sample size is the number of fish observation events with the imaging sonars, not necessarily the number of individual fish, because a given fish could be observed more than once. Abbreviations and symbol: N, sample size; m/s, meter per second; SD, standard deviation; IQR, interquartile range; <, less than]
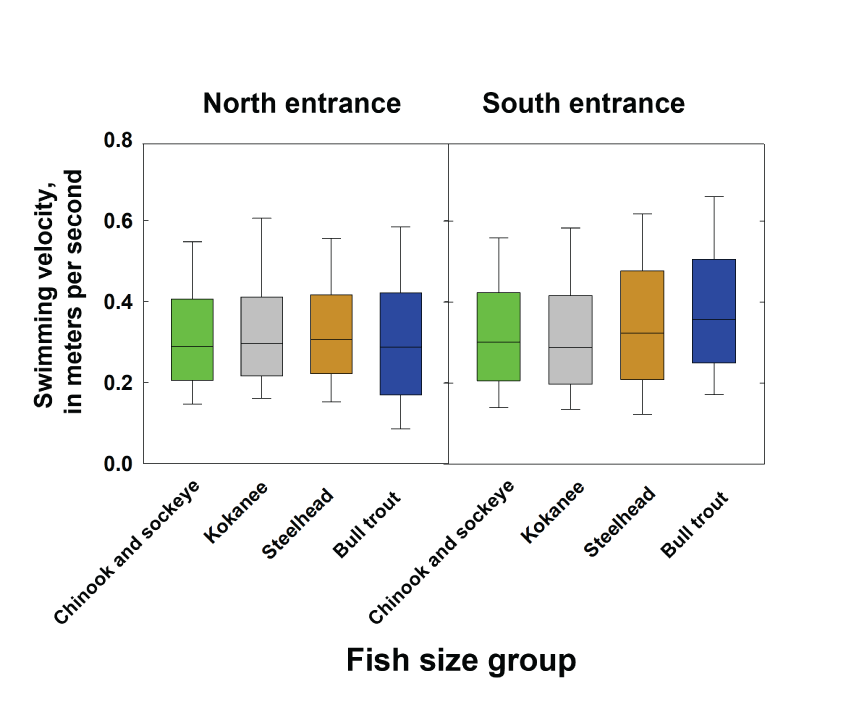
Swimming velocity of fish observed using the adaptive resolution imaging sonars at the north and south entrances at the Selective Water Withdrawal collector at Lake Billy Chinook, Oregon, 2021. Boxes range from the 25th to the 75th percentiles, with lines indicating the medians and whiskers representing 10th and 90th percentiles.
Timing of Detection
The counts of fish observed with the imaging sonars at the SWW entrances differed by night generation operation timing and discharge. During the Traditional night generation operation timing (from 9:00 p.m. to 4:00 a.m.), counts of fish from the Chinook and sockeye smolt, steelhead, and bull trout-size fish groups were lowest during the daytime periods when discharge rates were reduced (fig. 14). Counts of kokanee-size fish were highest at 4:00 p.m. immediately preceding the increase in discharge. After about 6:00 p.m., counts of steelhead and Chinook and sockeye smolt-size fish groups began increasing about two hours after the initial increase in discharge and increased through the night. After the decrease in flow at about 3:00 a.m., smolt-size fish counts began declining, before declining sharply at 5:00 a.m. Bull trout-size fish were most abundant at 5:00 a.m. Counts of fish from all size groups were lowest at 8:00 a.m.
During the Delayed night generation operation timing (from 11:0 p.m. to 6:00 a.m.), trends of counts for fish were generally like those observed during Traditional night generation operation timing (fig. 15). Chinook and sockeye smolt, and bull trout-size fish groups were lowest during the daytime periods when discharge rates were reduced. Counts of the steelhead and the Chinook and sockeye smolt-size fish groups increased through the night, with maximum observations occurring at 5:00 a.m., before rapidly decreasing to reduced observations during periods of daytime and low discharge rates. Counts of kokanee-size fish were highest at 2:00 p.m., immediately preceding the increase in discharge, and remained relatively stable through the night, before declining at 6:00 a.m. Bull trout-size fish were most abundant at 5:00 a.m., during the period when smolt-size fish were most abundant. Counts of fish from all size groups were lowest at 8:00 a.m. The effects of daylight on fish counts during the Delayed night generation operation timing became more evident while the outmigration season progressed (fig. 16). Detections of smolt-size fish were greatest at 5:00 a.m., before declining rapidly an hour later during March and April, when sunrise occurred later in the morning. And, during May and June, counts of fish declined rapidly at 5:00 a.m. because daylight began earlier in the morning.
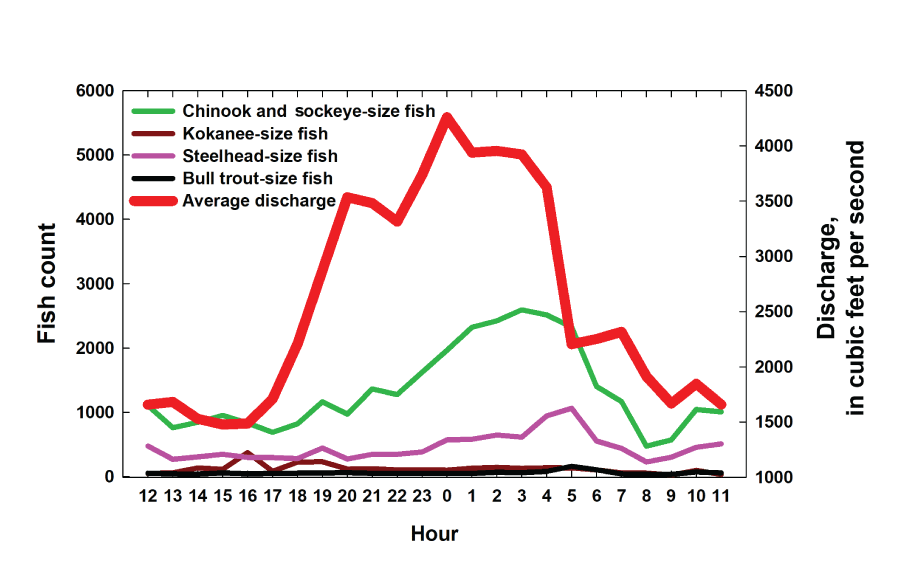
Counts of fish-size groups by hour of detection during the Traditional night generation operation timing (from 9:00 p.m. to 4:00 a.m.) at the collector entrances using the adaptive resolution imaging sonar at the Selective Water Withdrawal collector at Lake Billy Chinook, Oregon, 2021.
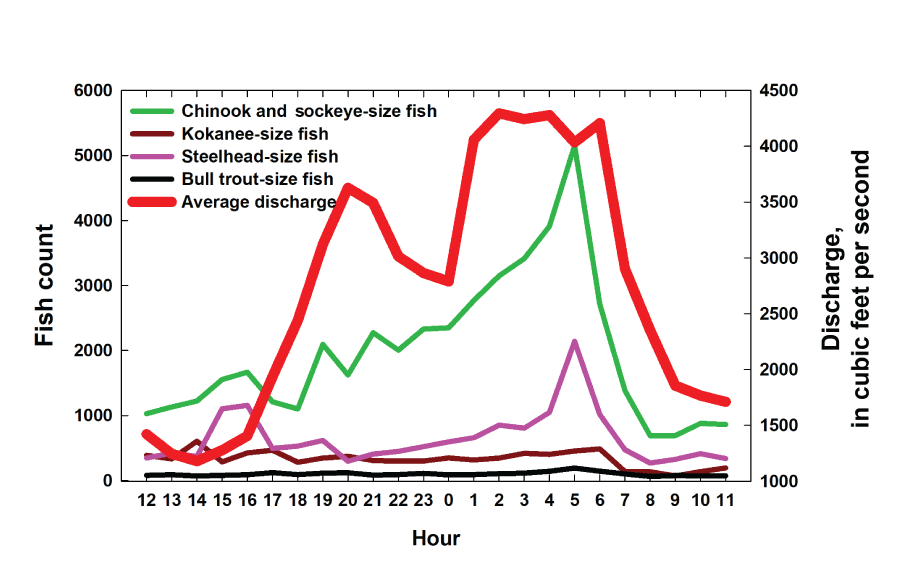
Counts of fish-size groups by hour of detection during the Delayed night generation operation timing (from 11:00 p.m. to 6:00 a.m.) at the collector entrances using the adaptive resolution imaging sonar at the Selective Water Withdrawal collector at Lake Billy Chinook, Oregon, 2021.
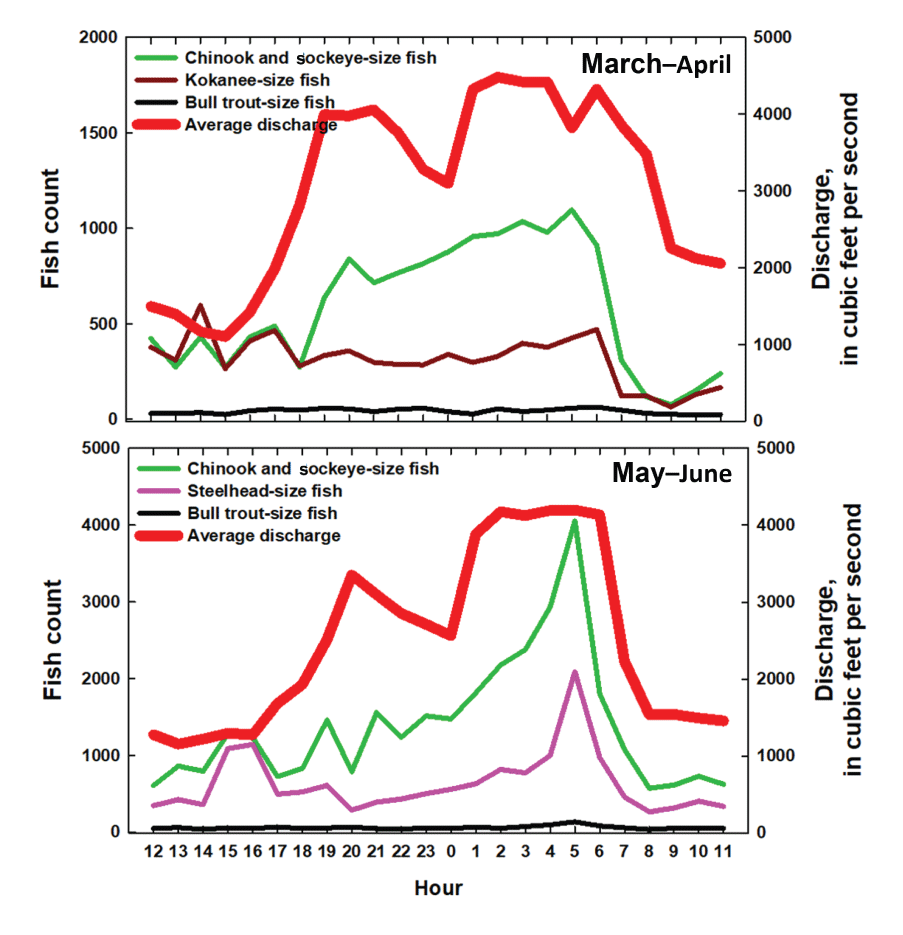
Bi-monthly counts of fish-size groups by hour of detection during the Delayed night generation operation timing (from 11:00 p.m. to 6:00 a.m.) at the collector entrances using the adaptive resolution imaging sonar at the Selective Water Withdrawal collector at Lake Billy Chinook, Oregon, 2021.
Fish Track Density
The spatial distributions of fish positions near the entrances of the SWW suggest some differences in distribution depending on the fish size group. The fish location point density data include greater than 2.8 million location points from 120,564 individual tracks that were recorded by the imaging sonars. Point density data indicate that positions for Chinook and sockeye smolt-size fish observed on the north sonar were primarily near the area between the SWW entrances, with lesser concentrations of positions on the outsides of the SWW structure (fig. 17). However, positions for Chinook and sockeye smolt-size fish observed on the south sonar were nearly spread across the entirety of the south entrance. Positions for kokanee and steelhead smolt-size groups were similar at the north and south entrances with both fish groups primarily observed near the area between the SWW entrances, with fewer detections on the far north and far south ends of the SWW (figs. 18, 19). The bull trout-size group was primarily observed near the area between the SWW entrances, like detections of the kokanee and steelhead smolt-size groups (fig. 20).
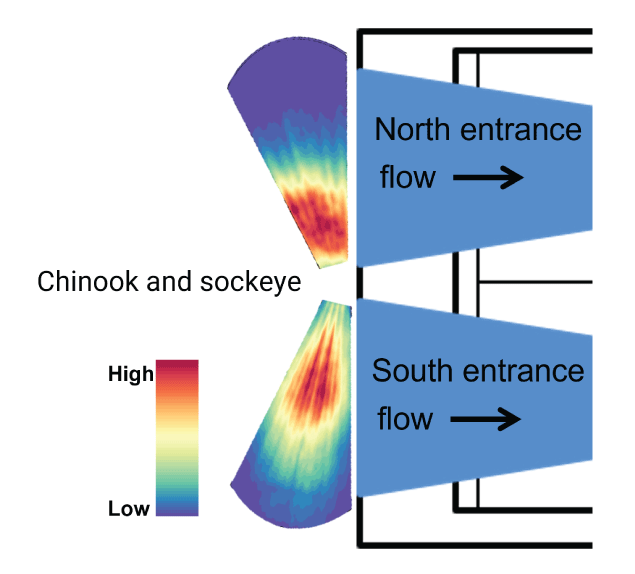
Location point density plot showing chinook and sockeye smolt-size fish detected at the collector entrances using the adaptive resolution imaging sonar at the Selective Water Withdrawal collector at Lake Billy Chinook, Oregon, 2021.
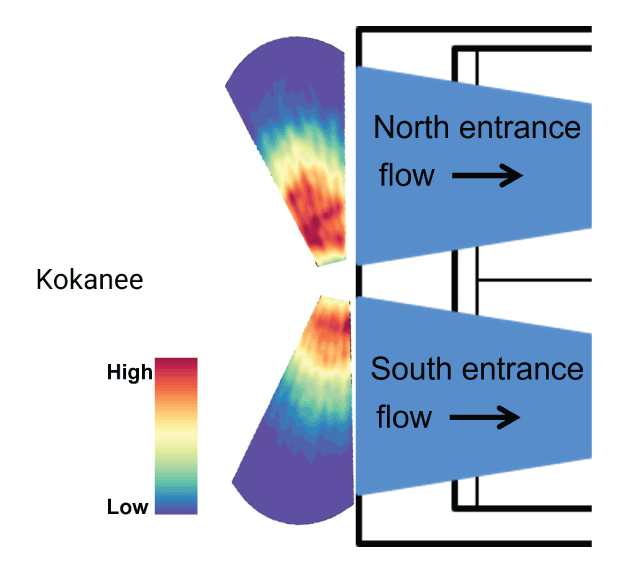
Location point density plot showing kokanee-size fish detected at the collector entrances using the adaptive resolution imaging sonar at the Selective Water Withdrawal collector at Lake Billy Chinook, Oregon, 2021.
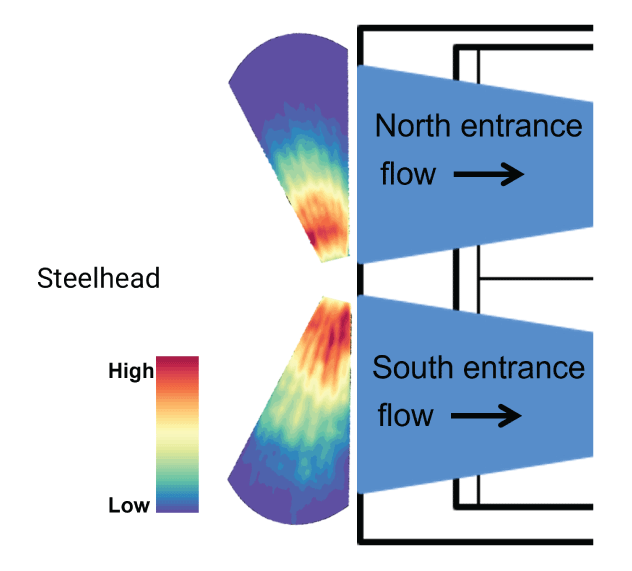
Location point density plot showing steelhead-size fish detected at the collector entrances using the adaptive resolution imaging sonar at the Selective Water Withdrawal collector at Lake Billy Chinook, Oregon, 2021.
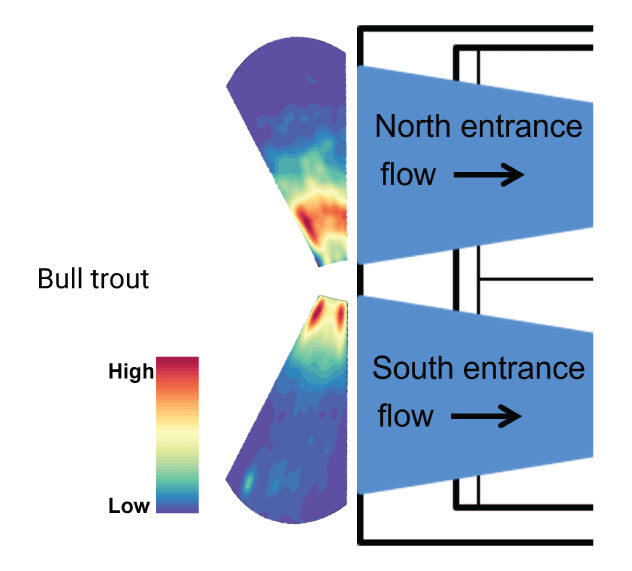
Location point density plot showing bull trout-size fish detected at the collector entrances using the adaptive resolution imaging sonar at the Selective Water Withdrawal collector at Lake Billy Chinook, Oregon, 2021.
Discussion
In this study, the goals were to observe fish movements at the entrances of the SWW collector and to determine the potential effect of altered discharge timing on smolt-size fish at the SWW. We used analytical methods to provide quantitative assessments of the abundance and movements of smolt and bull trout-size fish at the SWW surface collector, which is operated to entrain and capture downriver migrating salmonids. The imaging sonar technology used in this study observed and monitored smolt and bull trout-size fish near the SWW and enabled us to characterize fish behaviors, abundance, and movements at the SWW, verifying if altering night generation operation timing influences fish behaviors and abundance.
Imaging sonar technology is well suited for evaluating the activities of fish near collection and guidance structures due to the ability to observe untagged fish in situ without affecting fish behavior. However, the limitations of imaging sonars include the lack of species specificity for fish of similar size, the possibility of counting individual fish multiple times, and a small area of observation. Additionally, the large volume of imaging sonar data collected can be burdensome to process into meaningful results, but much of this process was automated, thereby increasing the volume of data used for analysis. In this SWW collector study, we used run-timing and size metrics from fish directly collected at the SWW fish transfer facility to classify fish size groups. Using these observations, we assume that fish 95–190 mm long were either Chinook or sockeye smolts, that fish 190–300-mm long prior to May 3 were kokanee, fish that were 190–300-mm long after May 3 were steelhead smolts, and that those greater than 350-mm long were bull trout.
The SWW at Lake Billy Chinook is one of several downstream juvenile migrant collectors in use at storage and power generating dams in the Pacific Northwest (Adams and Smith, 2017). Other surface collectors are at Baker Lake and Lake Shannon on the Baker River, Washington (Puget Sound Energy); Swift Reservoir on the Lewis River, Washington (PacifiCorp); Cowlitz Falls Dam at Lake Scanewa, Washington (Tacoma Power); North Fork Dam on the Clackamas River, Oregon (Portland General Electric); and Cushman Dam No.1 on the North Fork of the Skokomish River, Washington (Tacoma Power). The inflows at these collectors vary from 250 ft3/s at Cushman to about 5,000 ft3/s at the SWW at Round Butte Dam. Additionally, the SWW does not have nets or landform positioning, which are employed at all other facilities to help guide fish to their entrances. Kock and others (2019) found that increased smolt catch rates were generally experienced at facilities using both elevated flow rates and guidance structures. The SWW collector relies on a nighttime target flow of 4,500 ft3/s to attract and collect juvenile salmonids, which is greater than five times that used at some of the other surface collector facilities. Previously, the SWW had no physical structures to provide directional guidance toward the collector entrance; however, a lead net was installed during the winter of 2022, after the conclusion of this study. The addition of the guidance net near the entrance to the SWW at Round Butte Dam, coupled with target attraction flow, might increase fish collection based on the abundance of fish observed near the entrance to the SWW and the increased rates of collection experienced at other facilities.
Data from the imaging sonar indicated that increases in the hourly number of observations of smolt-size fish near the entrances of the SWW generally coincided with elevated discharge produced during night generation operations. For the smolt-size fish group, counts were lowest during the daytime periods when discharge rates were reduced, then gradually increased at night with the corresponding increase in discharge. After a decrease in discharge in the early morning (3:00 a.m.) during the Traditional night generation operation timing condition, smolt-size fish abundance near the entrances to the SWW began to decline, then declined sharply at 5:00 a.m. During the Delayed night generation operation timing condition, smolt-size fish abundance near the entrances to the SWW increased through the night, with maximum observations occurring at 5:00 a.m., before rapidly decreasing prior to the reduction of discharge at 6:00 a.m. However, smolt collection rates at the SWW have been historically low during the day, indicating that smolt activity is elevated during nighttime hours (Pyper, 2015). The decrease in abundances of smolts observed at the entrances immediately after the rapid decrease of Traditional night generation operation timing target discharge during the nighttime hours supports the need to focus on improving the operational timing of flow reduction. However, the decrease in abundances of smolts observed at the entrances during the Delayed night generation operation timing prior to the reduction of target discharge indicates that the onset of daylight may be a driver for decreasing fish abundance near the entrances to the SWW, and increased discharge becomes ineffective. Further refinement of operations elevated discharge timing by testing smaller incremental time-steps to account for seasonal fluctuations in fish abundance may promote increased fish abundance at the SWW.
We observed some behavioral differences for fish near the entrance to the SWW. The predominant directions of travel differed by entrance but were generally similar between the Traditional and Delayed night generation operation conditions and the fish-size groups’ primary directions of travel that were directed toward the center of the SWW under both operation conditions. The swimming velocity of fish at the entrances of the SWW were similar at the two entrances but differed between some fish-size classes. While the differences were generally statistically significant, the biological significance is small, with differences in swimming velocities less than 0.1 m/s for all fish size groups. Discharge rates are generally recognized as one of the primary drivers of forebay collector performance because the range of detectable flow created for migrating salmonids is dictated by the amount of discharge (Johnson and Dauble, 2006; Kock and others, 2019). During the outmigration period observed during this study, reduced instream flows restricted the ability of the Project to consistently achieve and maintain the target 4,500 ft3/s night generation operation discharge for the entirety of the season, and likely reduced the range of detectable flow. However, abundances of fish were highest when discharges were greater than 4,000 ft3/s.
We also observed differences in the spatial use of the sonar coverage area for both smolt and bull trout-size fish near the entrances to the SWW. The kokanee, steelhead, and bull trout-size groups were primarily observed near the area between the SWW entrances with lesser concentrations of positions on the outsides of the SWW structure. The Chinook and sockeye smolt-size fish group observed on the north sonar was oriented toward the center of the collector with fewer observations on the outside halves of the collector entrances, whereas those observed on the south sonar were nearly spread across the entirety of the south entrance. These differences in spatial patterns of use suggest that Chinook and sockeye smolt-size fish may be holding in the attraction flow field at the SWW entrances prior to entering, whereas kokanee, steelhead, and bull trout-size fish may be using the lower velocity flow area located between the entrances.
Bull trout-size fish were observed at the entrances of the SWW; however, counts were generally low during all hours with the greatest abundance occurring in conjunction with that of smolt-size fish and during the morning crepuscular period, which is similar to findings by Khan and others (2012) near a similar surface-oriented fish collector. The presence of predatory fish has been observed at other fish passage structures, although the collection or passage of predator-size fish at these structures is rare (Beeman and others, 2014, 2016; Adams and others, 2015). Increased abundances of bull trout-size fish at this and other surface collectors during periods of increased smolt-size fish presence suggests that surface collectors may be used as a prey ambush location during periods of juvenile salmonid out-migration (Hill and others, 2013, McIlvaine, 2015; Beeman and others, 2016; Smith and others, 2018, 2021). The presence of bull trout-size fish near the entrances of the SWW indicates that this structure may be providing physical habitat and increased feeding opportunities for bull trout on migrating salmonid smolts, which should be considered with the installation of a guidance structure. With the recent installation of a guidance net at the SWW entrance, monitoring the presence of predator-size fish at the SWW with imaging sonar technology will be beneficial to determine the effect of an added structure on predator abundance and behavior.
The imaging sonar technology used in this study proved to be an informative tool for assessing the abundance, movements, and behaviors of smolt and bull trout-size fish at the entrance of the SWW. Observations of smolt-size fish indicate that abundance was primarily dictated by the operational flows of the SWW. Additionally, we observed that a Delayed night generation operation timing condition, that prolonged elevated discharge later into the morning, increased smolt-size fish abundance at the entrances to the SWW. These results can be used to help inform resource managers how discharge and night generation operation timing can influence abundance and behaviors of smolts at the SWW.
References Cited
Adams, N.S., and Smith, C.D., 2017, Spatial and temporal distribution of bull trout (Salvelinus confluentus)-size fish near the floating surface collector in the North Fork Reservoir, Oregon, 2016: U.S. Geological Survey Open-File Report 2017–1080, 27 p., accessed February 7, 2022, at https://doi.org/10.3133/ofr20171080.
Adams, N.S., Smith, C.D., Plumb, J.M., Hansen, G.S., and Beeman, J.W., 2015, An evaluation of fish behavior upstream of the water temperature control tower at Cougar Dam, Oregon, using acoustic cameras, 2013: U.S. Geological Survey Open-File Report 2015–1124, 62 p., accessed February 7, 2022, at https://pubs.er.usgs.gov/publication/ofr20151124.
Beeman, J.W., Evans, S.D., Haner, P.V., Hansel, H.C., Hansen, A.C., Hansen, G.S., Hatton, T.W., Sprando, J.M., Smith, C.D., and Adams, N.S., 2016, Evaluation of the biological and hydraulic performance of the portable floating fish collector at Cougar Reservoir and Dam, Oregon, 2014: U.S. Geological Survey Open-File Report 2016–1003, 127 p., accessed February 7, 2022, at https://pubs.er.usgs.gov/publication/ofr20161003.
Beeman, J.W., Hansel, H.C., Hansen, A.C., Evans, S.D., Haner, P.V., Hatton, T.W., Kofoot, E.E., Sprando, J.M., and Smith, C.D., 2014, Behavior and dam passage of juvenile Chinook salmon at Cougar Reservoir and Dam, Oregon, March 2012–February 2013: U.S. Geological Survey Open-File Report 2014–1177, 52 p., accessed February 7, 2022, at https://pubs.usgs.gov/of/2014/1177/.
Federal Energy Regulatory Commission, 2005, Order approving settlement and issuing new license (Pelton Round Butte Project) for Portland General Electric Company and the Confederated Tribes of the Warm Springs Reservation of Oregon: Washington, D.C., 111 Federal Energy Regulatory Commission 61,450, 298 p.
Hill, M., Quesada, C., Bennett, M., Timko, M., Martinez, M., Rizor, S., Wright, C., Sullivan, L., Meagher, M., and Kukes, T., 2013, Evaluation of juvenile Chinook and steelhead downstream passage behavior and resident bull trout behavior at Round Butte Dam, Madras, Oregon: Portland, Oregon, Portland General Electric Company, 51 p.
Khan, F., Johnson, G.E., Royer, I.M., Phillips, N.R., Hughes, J.S., Fischer, E.S., Ham, K.D., and Ploskey, G.R., 2012, Acoustic imaging evaluation of juvenile salmonid behavior in the immediate forebay of the water temperature control tower at Cougar Dam, 2010: Richland, Washington, Pacific Northwest National Laboratory report PNNL-20625, 50 p., accessed February 7, 2022, at https://www.pnnl.gov/main/publications/external/technical_reports/pnnl-20625.pdf.
Kock, T.J., Verretto, N.E., Ackerman, N.K., Perry, R.W., Beeman, J.W., Garello, M.D., and Fielding, S.D., 2019, Assessment of operational and structural factors influencing performance of fish collectors in forebays of high-head dams: Transactions of the American Fisheries Society, v. 148, no. 2, p. 464–479.
Korn, L., Hreha, L.H., Montagne, R.G., Mullarkey, W.G., and Wagner, E.J., 1967, The effect of small impoundments on the behavior of juvenile anadromous salmonids: Portland, Oregon, Fish Commission of Oregon, 127 p., accessed February 7, 2022, at http://ir.library.oregonstate.edu/xmlui/bitstream/handle/1957/17360/fish_comm_research_briefs_1967_13-1.pdf.
Liedtke, T.L., Kock, T.J., and Rondorf, D.W., 2013, Evaluation of the behavior and movement patterns of adult coho salmon and steelhead in the North Fork Toutle River, Washington, 2005–2009: U.S. Geological Survey Open-File Report 2013–1290, 26 p. [Also available at https://doi.org/10.3133/ofr20131290.]
Mangiafico, S.S., 2016, Summary and analysis of extension program evaluation in R, version 1.19.10: New Brunswick, New Jersey, Rutgers Cooperative Extension, 806 p., accessed February 4, 2022, at https://rcompanion.org/documents/RHandbookProgramEvaluation.pdf.
McIlvaine, P., 2015, Application review for low impact hydropower institute re-certification of the Pelton-Round Butte Project No. 2030: Topsham, Maine, Wright-Pierce, 27 p., accessed February 7, 2022, at https://lowimpacthydro.org/wp-content/uploads/2020/07/Pelton-Round-Butte-Final-Report-Sept-2015-1.pdf.
OpenCV, 2020, Open Source Computer Vision Library, version 4.4.0: Santa Clara, California, Intel Corporation, accessed November 2020, at https://opencv.org/opencv-4-4-0/.
Portland General Electric Company, 2004, Settlement agreement concerning the relicensing of the Pelton Round Butte Hydroelectric Project (FERC Project No. 2030): Portland, Oregon, Portland General Electric Company, 230 p., accessed February 7, 2022, at https://lowimpacthydro.org/wp-content/uploads/2020/07/3PRBSettlementAgreement7-16-04FINAL.pdf.
Portland General Electric Company and The Confederated Tribes of the Warm Springs Reservation of Oregon, 2015, Pelton Round Butte Project (FERC No. 2030) 2015 fish passage annual report: Portland, Oregon, Portland General Electric Company, 33 p., accessed February 7, 2022, at https://elibrary.ferc.gov/eLibrary.
Portland General Electric Company and The Confederated Tribes of the Warm Springs Reservation of Oregon, 2018, Pelton Round Butte Hydroelectric Project (FERC No. 2030) 2018 annual project operations report January 1 through December 31: Portland, Oregon, Portland General Electric Company, 832 p., accessed February 7, 2022, at https://elibrary.ferc.gov/eLibrary.
Pyper, B., Hill, M., and Quesada, C., 2017, Effects of attraction flow on downstream passage rates of PIT-tagged juvenile Chinook and steelhead at Round Butte Dam, Madras, Oregon—International Conference on Engineering and Ecohydrology for Fish Passage June 20, 2017: Amherst, Massachusetts, University of Massachusetts Amherst, 23 p., accessed February 7, 2022, at https://scholarworks.umass.edu/fishpassage_conference/2017/June20/1.
Python Core Team, 2020, Python—A dynamic, open source programming language, version 3.8.5: Wilmington, Delaware, Python Software Foundation, accessed November 2021, at https://docs.python.org/release/3.8.5/.
R Core Team, 2014, R—A language and environment for statistical computing, version 4.0.3: Vienna, R Foundation for Statistical Computing software release, accessed November 2021, at http://www.R-project.org/.
SAS Institute, 2012, SAS System for Windows, version 9.3: Cary, North Carolina, SAS Institute Inc., accessed November 2021, at https://support.sas.com/software/93/.
Smith, C.D., Plumb J.M., and Adams, N.S., 2018, Fish behavior and abundance monitoring near a floating surface collector in North Fork Reservoir, Clackamas River, Oregon, using multi-beam acoustic imaging sonar: U.S. Geological Survey Open-File Report 2018–1182, 28 p., accessed February 7, 2022, at https://doi.org/10.3133/ofr20181182.
Smith, C.D., Plumb, J.M., Adams, N.S., and Wyatt, G.J., 2021, Predator and prey events at the entrance of a surface-oriented fish collector at North Fork Dam, Oregon: Fisheries Management and Ecology, v. 28, no. 2, p. 172–182, accessed February 7, 2022, https://doi.org/10.1111/fme.12465.
Smith, C.D., Hatton, T.W., and Adams, N.S., 2022, Monitoring fish abundance and behavior, using multi-beam acoustic imaging sonar, at a Selective Water Withdrawal structure in Lake Billy Chinook, Deschutes River, Oregon, 2020: U.S. Geological Survey Open-File Report 2022–1038, 31 p., accessed July 7, 2022, at https://doi.org/10.3133/ofr20221038.
Sound Metrics, 2018, ARISfish version 2.6.3: Bellevue, Washington, Sound Metrics Corporation, accessed November 2021, at http://www.soundmetrics.com/Support.
Sweeney, C.E., Giorgi, A.E., Johnson, G.E., Hall, R., and Miller, M., 2007, Surface bypass program comprehensive review report: Richland, Washington, ENSR Corporation document number 09000-399-0409, 494 p., accessed October 18, 2022, at https://usace.contentdm.oclc.org/digital/collection/p16021coll3/id/508/rec/1.
The Math Works, 2019, MATLAB, version 2019a: Natick, Massachusetts, The Math Works Inc., accessed November 2021, at https://www.mathworks.com/products/new_products/release2019a.html.
Tiffan, K.F., Rondorf, D.W., and Skalicky, J.J., 2005, Diel spawning behavior of chum salmon in the Columbia River: Transactions of the American Fisheries Society, v. 134, no. 4, p. 892–900, accessed February 7, 2022, at https://doi.org/10.1577/T04-150.1.
U.S. Geological Survey, 2021a, USGS 14076500 Deschutes River near Culver, OR: U.S. Geological Survey, National Water Information System, accessed February 7, 2022, at https://waterdata.usgs.gov/usa/nwis/uv?site_no=14076500.
U.S. Geological Survey, 2021b, USGS 14087400 Crooked River near Culver, OR: U.S. Geological Survey, National Water Information System, accessed February 7, 2022, at https://waterdata.usgs.gov/usa/nwis/uv?site_no=14087400.
U.S. Geological Survey, 2021c, USGS 14091500 Metolius River near Grandview, OR: U.S. Geological Survey, National Water Information System, accessed February 7, 2022, at https://waterdata.usgs.gov/usa/nwis/uv?site_no=14091500.
Conversion Factors
U.S. customary units to International System of Units
International System of Units to U.S. customary units
Temperature in degrees Celsius (°C) may be converted to degrees Fahrenheit (°F) as:
°F = (1.8 × °C) + 32.
Datums
Vertical coordinate information is referenced to the National Geodetic Vertical Datum of 1929 (NGVD 29).
Elevation, as used in this report, refers to distance above the vertical datum.
For information about the research in this report, contact
Director, Western Fisheries Research Center
U.S. Geological Survey
6505 NE 65th Street
Seattle, Washington 98115-5016
https://www.usgs.gov/centers/wfrc
Manuscript approved on October 18, 2022
Publishing support provided by the U.S. Geological Survey
Science Publishing Network, Tacoma Publishing Service Center
Suggested Citation
Smith, C.D., and Hatton, T.W., 2022, Evaluation of fish behavior at the entrances to a Selective Water Withdrawal structure in Lake Billy Chinook, Oregon, 2021: U.S. Geological Survey Open-File Report 2022–1098, 28 p., https://doi.org/10.3133/ofr20221098.
ISSN: 2331-1258 (online)
Study Area
| Publication type | Report |
|---|---|
| Publication Subtype | USGS Numbered Series |
| Title | Evaluation of fish behavior at the entrances to a Selective Water Withdrawal structure in Lake Billy Chinook, Oregon, 2021 |
| Series title | Open-File Report |
| Series number | 2022-1098 |
| DOI | 10.3133/ofr20221098 |
| Year Published | 2022 |
| Language | English |
| Publisher | U.S. Geological Survey |
| Publisher location | Reston, VA |
| Contributing office(s) | Western Fisheries Research Center |
| Description | viii, 28 p. |
| Country | United States |
| State | Oregon |
| Other Geospatial | Lake Billy Chinook |
| Online Only (Y/N) | Y |
| Google Analytic Metrics | Metrics page |