

Use of High-Resolution Topobathymetry to Assess Shoreline Topography and Potential Future Development of a Slack Water Harbor near Dardanelle, Arkansas, October 2021
Links
- Document: HTML , XML
- Sheet: Report (2.76 MB pdf)
- Data Release: USGS data release —Use of high-resolution topobathymetry to assess shoreline topography and future development of a slack water harbor near Dardanelle, Arkansas, October 2021
- Download citation as: RIS | Dublin Core
Acknowledgments
The authors wish to gratefully acknowledge the cooperation of the personnel at Big River Materials to access the quarry and surrounding area to complete the surveys detailed in this map product.
The authors also wish to gratefully acknowledge the assistance of the U.S. Geological Survey National Uncrewed Systems Office for their assistance in collecting and processing the low-altitude aerial light detection and ranging data for this project. Lance Brady and Matthew Burgess were instrumental in helping collect the data for the topographic surveys detailed in this map product.
Introduction
The U.S. Army Corps of Engineers (USACE), Southwestern Division, Little Rock District Civil Works program has a mission to maintain cohesion between physical and naturally developed environments. The USACE authorized the development of an off-channel harbor (hereinafter referred to as the “proposed slack water harbor”) along the McClellan-Kerr Arkansas River Navigation System at river mile 202.6 (fig. 1), and an initial evaluation of shoreline stability and adjacent land near the proposed harbor was considered essential in establishing a baseline for potential effects and future monitoring. In October 2021, the U.S. Geological Survey (USGS), in cooperation with the USACE, completed high-resolution bathymetric (underwater elevation) and topographic surveys of the Arkansas River and a quarry at the location of the proposed slack water harbor near Dardanelle, Arkansas, using a combination of multibeam sound navigation and ranging (sonar) and high-resolution, low-altitude aerial light detection and ranging (lidar) data to provide data and analysis needed for as-built information and future monitoring of river shoreline and floodplain management and maintenance.
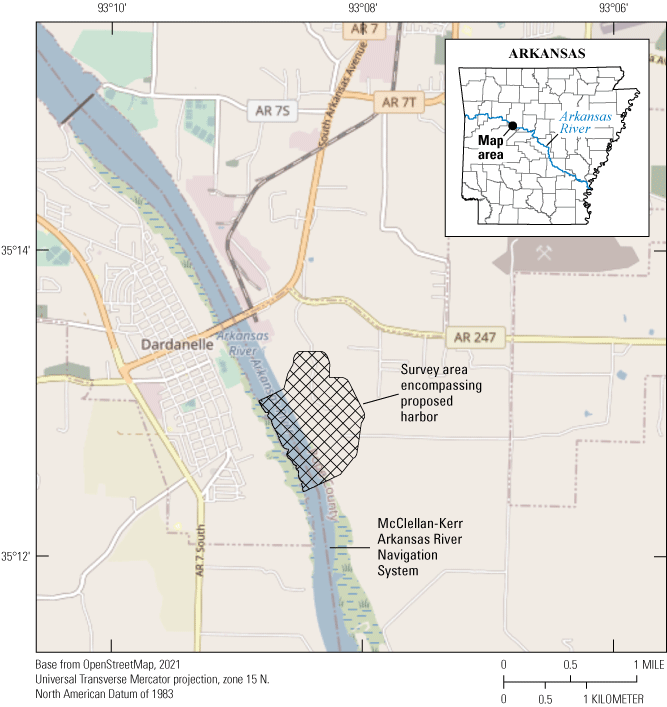
Location of the proposed slack water harbor near Dardanelle, Arkansas.
Bathymetric data were collected using a high-resolution multibeam mapping system (MBMS), which consists of a multibeam echosounder (MBES) and an inertial navigation system (INS) mounted on a marine survey vessel. Data were collected as the vessel traversed the river and quarry along overlapping survey lines distributed throughout the areas.
Topographic data were collected as a lidar point cloud (LPC) using an unmanned aircraft system (UAS) with a YellowScan Vx20–100 lidar payload, which consists of the lidar scanner and an INS. The LPC data were collected as the UAS followed two sets of parallel transect lines, oriented perpendicular to each other (nominally north to south and east to west) on separate flights. The bathymetric and UAS topographic datasets were combined with topographic data extracted from publicly available aerial lidar data collected in 2014 (U.S. Geological Survey, 2017) to create a multisource point cloud classified as “ground” (code 2) according to the American Society for Photogrammetry and Remote Sensing (ASPRS) standard lidar point classes (American Society for Photogrammetry and Remote Sensing, 2019) in the proposed harbor area and surroundings, from which topographic contours were derived.
Data-Collection Methods
Bathymetric surveys for the river reach and quarry were completed on October 5–6, 2021 (fig. 2), using similar methods to other recent bathymetric surveys on rivers (Huizinga, 2022) and lakes (Huizinga and others, 2022). Topographic surveys of the land adjacent to the river near the proposed harbor were completed on October 19–20, 2021 (fig. 2), using established methods detailed herein. Data from the bathymetric and topographic surveys were combined to create a high-resolution topobathymetric surface, from which a contour map was created.
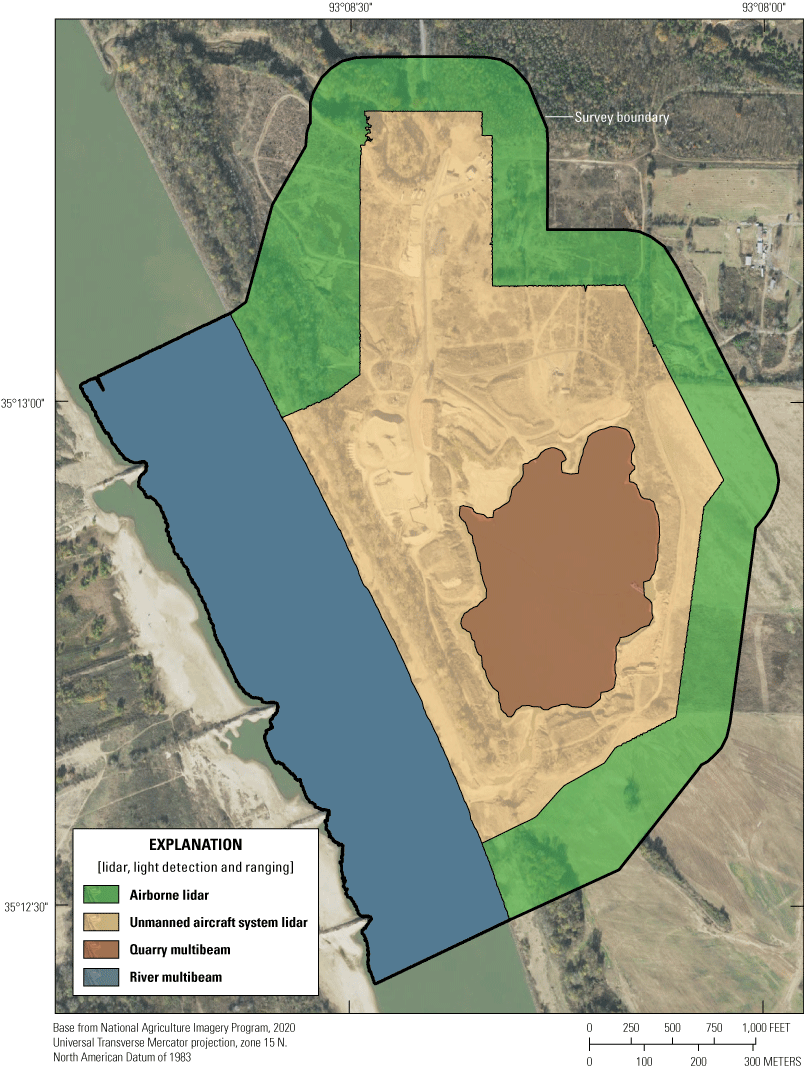
Overview of the survey area at the proposed slack water harbor near Dardanelle, Arkansas, with the types of data collected or used.
Bathymetric Data Collection and Postprocessing
Bathymetric data (water depths and positions) were acquired using sonar technology and were collected using a high-resolution MBMS mounted on a boat (figs. 3A–C). A 24-foot (ft) flat-bottom cabin boat (fig. 3B) was used for the river survey, and a smaller 16-ft jon boat (fig. 3C) was used for the quarry survey because it could be launched and retrieved from the bank of the quarry more easily. The various components of the MBMS used for this project are described in more detail in reports about studies on the Missouri and Mississippi Rivers in Missouri (for example, see Huizinga, 2010, 2022; Huizinga and others, 2010). The survey methods used to obtain the bathymetric data for the proposed harbor were similar to these river studies and recent lake studies in Missouri (Richards and others, 2019; Huizinga and others, 2022), as were the methods used to ensure data quality. A brief description of the equipment and methods follows.
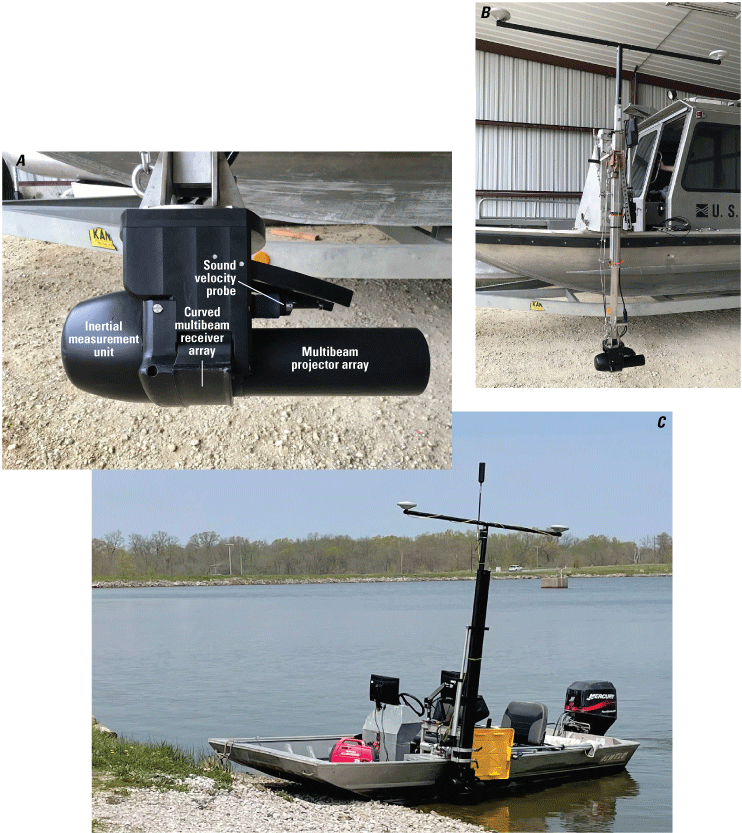
The multibeam echosounder. A, viewed from the side; B, mounted on the port side of the U.S. Geological Survey 24-foot cabin boat; C, deployed on the port side of the 16-foot jon boat.
An MBMS is an integration of several individual components: the MBES, an INS, and a data-collection and data-processing computer. The INS provides position in three-dimensional space and measures the heave, pitch, roll, and heading of the vessel (and, thereby, the MBES) to accurately position the data received by the MBES. HYPACK/HYSWEEP software (HYPACK, Inc., 2021) installed on the data-collection and processing computer was used to prepare for the bathymetric survey and to collect the survey data. The MBES used was the Norbit iWBMSh, operated at a frequency of 400 kilohertz (kHz; fig. 3A). The iWBMSh is similar in operation to the MBES systems used in other recent bathymetry studies in Missouri. Optimum data usually are collected in a swath of less than 160 degrees (80 degrees on each side of nadir, or straight down below the MBES); nevertheless, the swath can be electronically rotated to either side of nadir, enabling data acquisition along sloping banks up to a depth just below the water surface.
Most of the bathymetric survey data within the river and quarry were collected with the swath range limited to 140 degrees, 70 degrees on each side of nadir. Along the banks in the river and quarry, however, the swath range was widened to 160 degrees and was electronically tilted to port or starboard as needed to cover a wider swath of the bottom and enhance acquisition of bathymetric data in the shallow areas near the banks. The electronically tilted swath generally extended from about 5 degrees above horizontal on the bankward side of the survey vessel to 45–65 degrees past nadir below the vessel.
The bathymetric data were collected along transect lines oriented longitudinally in the Arkansas River, and along roughly parallel lines across the quarry. The transect lines were spaced to create about 10- to 25-percent overlap of the survey swaths to ideally achieve complete coverage of the river and quarry bottom and minimize sonic shadows. Data along the shoreline were collected by navigating the boat parallel to the shore while overlapping the data collected in the main body of the river or quarry.
Real-time kinematic corrections for the INS during the surveys came from cellular communication with the Arkansas Department of Transportation Global Navigation Satellite System (GNSS) real-time network for the real-time navigation and tide solution; however, all the navigation information from the bathymetric surveys was postprocessed using the POSPac Mobile Mapping Suite (MMS) software (Applanix Corporation, 2021) to mitigate any effects of degraded positional accuracy of the vessel from a poor real-time solution. POSPac MMS provides tools to identify and compensate for sensor and environmental errors and computes an optimally blended navigation solution from the GNSS and inertial measurement unit (commonly known as IMU; fig. 3A) raw data from the INS. The position solution was further enhanced by collecting static GNSS data with a GNSS base receiver set up over a reference mark near the survey area, the coordinates for which were determined using techniques detailed in Rydlund and Densmore (2012). The blended navigation solution (called a “smoothed best estimate of trajectory” [SBET] file) generated by postprocessing the navigation data was applied to the bathymetric survey data.
The speed of sound in the water typically varies with time, location, and depth. Although sound velocity data are collected at the MBES head using the sound velocity probe (fig. 3A) throughout the survey to mitigate these variations near the water surface, potential changes in the speed of sound with depth need to be measured to accurately determine the depths acquired by the MBES. Sound velocity profiles, therefore, were measured with an AML Oceanographic Base X2 sound velocity probe at various times and locations throughout the quarry to apply to the depth data during postprocessing. A sound velocity profile taken on the river confirmed a uniform sound velocity in the river consistent with the sound velocity measured at the MBES head, as expected in the well-mixed flow of the river.
After completing the surveys, the acquired depth data were processed further using HYPACK/HYSWEEP software to apply sound velocity profiles and to remove data spikes and other spurious points in the MBES swath trace often caused by fish and submerged woody debris and other vegetation. The data were georeferenced using the navigation and position solution data from the SBET file from POSPac MMS and visualized in HYPACK/HYSWEEP as a triangulated irregular network (commonly known as a TIN) surface or a point cloud. The georeferenced bathymetric datasets were filtered and reduced to a 1.64-ft (0.5-meter [m]) data resolution and provided in the ASPRS laser (LAS) format (American Society for Photogrammetry and Remote Sensing, 2019) with associated metadata files as part of the related USGS data release for this project (Huizinga and others, 2021). The LAS format is a standardized binary format for storing three-dimensional point cloud data and point attributes along with header information and variable length records specific to the data. Data points are stored as a three-dimensional data cloud as a series of x (longitude), y (latitude), and z (elevation) points. Additional processing details are provided in the metadata of the associated data release (Huizinga and others, 2021).
Bathymetric Data-Collection Quality Assurance
For the MBMS, the principal quality-assurance measures were assessed in real time during the surveys. The MBMS operator continuously assessed the quality of the data collected during the survey by making observations of across-track swaths (such as convex, concave, or skewed bed returns in flat, smooth bottoms), noting data quality flags and alarms from the MBES and the INS and inspecting comparisons between adjacent overlapping swaths. In addition to the real-time quality-assurance assessments during the survey, beam angle checks and a suite of patch tests were completed before and after the surveys during the field survey season in 2021 to ensure quality data were acquired from the MBMS. These tests generally were completed in the deeper part of a surveyed lake and over a submerged feature such as an old channel or a submerged roadway.
A beam angle check is used to determine the accuracy of the depth readings obtained by the outer beams (greater than 25 degrees from nadir) of the MBES (U.S. Army Corps of Engineers, 2013), which may change with time because of inaccurate sound velocities, physical configuration changes, and water depth. A beam angle check is completed at least once each year during the survey season. The most contemporaneous beam angle check was completed at Lake of the Ozarks near Osage Beach, Missouri, on November 18, 2021, and the results were within the recommended performance standards used by the USACE for hydrographic surveys for all the representative angles less than 70 degrees (U.S. Army Corps of Engineers, 2013), permitting the use of the central 140 degrees of the sonar swath with confidence. Points acquired outside of the central 100–110 degrees of the sonar swath generally had overlap with adjacent swaths, which increases the quality of the survey in the overlapped areas because of increased spatial point density.
Patch tests are a series of dynamic calibration tests that are used to check for subtle variations in the orientation and timing of the MBES with respect to the INS and real-world coordinates. The lever arm offsets between the MBES and the INS are measured and verified for accuracy before each project. The patch tests are used to determine timing offsets caused by latency between the MBES and the INS and angular offsets to roll, pitch, and yaw caused by the alignment of the transducer head (Huizinga, 2022). These offsets have been observed to be essentially constant for a given survey, barring an event that causes the mount to change such as striking a floating or submerged object (see Huizinga, 2022). The offsets determined in the patch test are applied when processing the data collected during a survey. The most contemporaneous patch tests were completed at Lake of the Ozarks near Osage Beach, Mo., on November 18, 2021, and angular offsets were updated in the data-collection software as appropriate. For this project, no timing offset was measured, which is consistent with latency test results for this boat and similar equipment configurations used in other surveys (Huizinga, 2010, 2022; Huizinga and others, 2010). The angular offsets were consistent with those determined for this instrument configuration from other patch tests during the 2021 survey season based on quality-assurance data collected by USGS in 2021 (Richard Huizinga, USGS, written commun., July 2022).
Similar to the previous studies of bathymetry in Missouri (Huizinga, 2010, 2022; Richards and others, 2019; Huizinga and others, 2022), uncertainty in the multibeam surveys was estimated for each survey-grid cell in the surveyed area using the Combined Uncertainty and Bathymetry Estimator (CUBE) method (Calder and Mayer, 2003) as implemented in the MBMax processing package of the HYPACK/HYSWEEP software (HYPACK, Inc., 2021). The CUBE uncertainty is a measure of the variability of the individual points in the cell used to determine the CUBE-derived elevation for the cell. Most of the CUBE uncertainty values for the bathymetric surveys of the river and quarry (more than 95 percent) were less than 0.10 ft (fig. 4), which is within the specifications for a “Special Order” survey, the most stringent survey standard of the International Hydrographic Organization (International Hydrographic Organization, 2020). The median uncertainty value of the data was about 0.03 ft. The largest uncertainty value in these surveys was about 1.6 ft; however, uncertainty values of this magnitude typically are near moderate-relief features (steep banks and submerged ridges; fig. 4). The uncertainty values also were sometimes larger in the outermost beam extents of the MBES swath in the overlap with an adjacent swath, particularly when the swath was tilted for the survey lines along the banks (fig. 4).
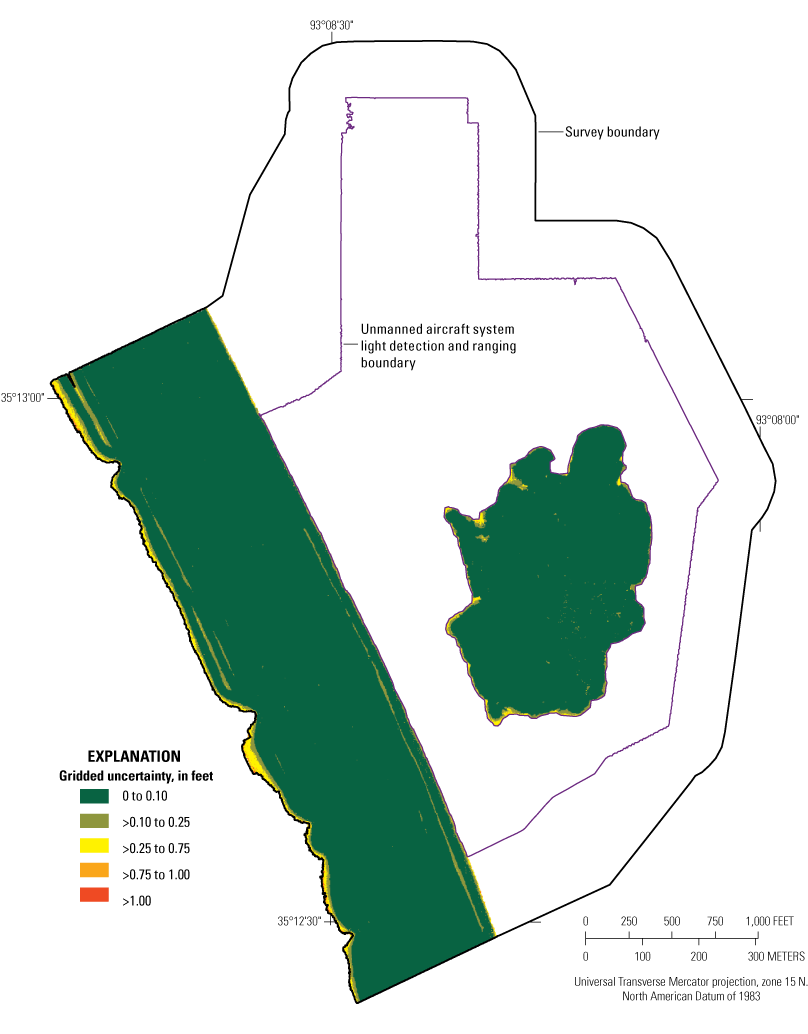
The gridded uncertainty of the bathymetric survey data at the proposed slack water harbor near Dardanelle, Arkansas, 2021.
Topographic Data Collection and Postprocessing
Topographic data (land elevations and positions) acquisition used lidar technology, and the data were collected as LPC data using a UAS with a YellowScan Vx20–100 lidar payload (fig. 5), which consists of the lidar scanner and an INS. The LPC data were collected as the UAS followed two sets of parallel transect lines, oriented perpendicular to each other (nominally north to south and east to west) on separate flights. The LPC was corrected using an SBET from a postprocessed kinematic (PPK) solution, which used a Trimble R8s base station set up over the same reference mark as was used in the quarry multibeam survey, and 10 additional ground control points (GCPs) consisting of Propeller AeroPoint smart targets which were PPK corrected to a nearby continuously operated reference station (commonly known as CORS).
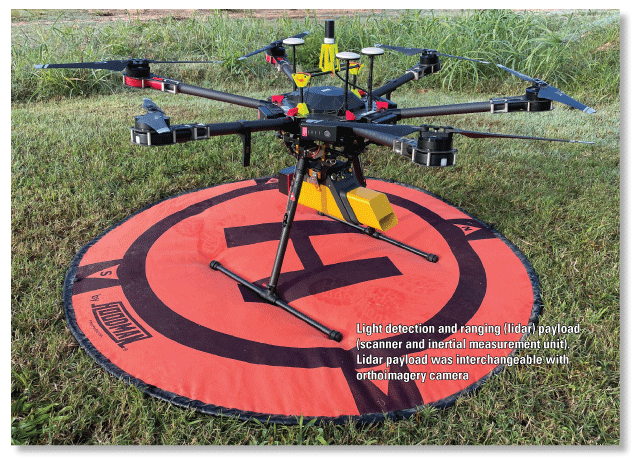
The unmanned aircraft system with light detection and ranging scanner, being prepared for flight.
The LPC data were collected with the swath range limited to 90 degrees, 45 degrees on each side of nadir, to reduce spot size elongation ambiguity in the measurements. The flight plan lines were designed to create about 50-percent overlap of the survey swaths to ensure complete coverage of the survey area and minimize optical shadows.
The points in the LPC data were classified with respect to the type of point using automatic and manual point classification tools in the Global Mapper software (Blue Marble Geographics, 2022). Points representing the last, strong return signal from the lidar scanner generally were classified as “ground” (code 2) according to the ASPRS standard lidar point classes (American Society for Photogrammetry and Remote Sensing, 2019), except when the point was identifiable as one of the other classifications based on other points around it, such as reflections from the water surface of the river or quarry, a building or other human-made object, high wires, or vegetation. Classification of nonground points was based on the intuitive expectation of the three-dimensional form of each object: a building or other human-made object has regular, straight, or angular edges; a tree or shrub looks like one in the point cloud; and the water surface is a set of points on a horizontal line above the bathymetric survey. Points above the last, strong return signal from the scanner that were not easily identifiable as one of the other types were set to the “created, never classified” (code 0) classification (American Society for Photogrammetry and Remote Sensing, 2019).
After classification of the points, the LPC data were colorized from a red-green-blue (RGB) orthoimage of the survey area collected the second survey day using a Ricoh GR camera mounted on the UAS. The georeferenced, colorized, and classified LPC data were output at maximum resolution, and the dataset is provided in the ASPRS LAS format (American Society for Photogrammetry and Remote Sensing, 2019) with associated metadata files as part of the related USGS data release for this project (Huizinga and others, 2021). Additional processing details are provided in the metadata of the associated data release (Huizinga and others, 2021).
Topographic Data-Collection Quality Assurance
Annual boresight calibration is completed on the UAS payload (similar to a patch test for the MBMS), which is a dynamic calibration test that is used to check for subtle variations in the orientation of the lidar scanner with respect to the INS and real-world coordinates. The boresight calibrations are used to estimate the angular offsets in the roll, pitch, and yaw between the lidar scanner and the INS. Furthermore, the lever arm offsets between the lidar scanner and the INS are measured and verified for accuracy before each project. The lever arms and angular offsets determined in the boresight calibration are applied during postprocessing. The lever arm and angular offset measurements were consistent with those determined for this instrument configuration from other tests during the 2021 survey season (Lance Brady, USGS National Uncrewed Systems Office, written commun., September 2021).
The horizontal accuracy assessment of the LPC included a comparison of the lidar data with the RGB orthoimage collected the second survey day. The orthoimage used Structure from Motion (commonly known as SfM) technology to create a georectified image that was corrected to 10 Propeller AeroPoint smart target GCPs with PPK-corrected locations with a Trimble R8s real-time kinematic GNSS base station. The RGB orthoimage is a second, independent dataset that was visually compared with the LPC. Visual comparison revealed generally good agreement with the locations of objects readily observable in each dataset, particularly the GCPs. The vertical accuracy assessment was completed using validation GCPs in nonvegetated areas. The average root mean square error for the nonvegetated GCPs was 0.10 ft (0.03 m). Grid spacing for this assessment was set to five times the point spacing from the GCP using a maximum number of 10 points and inverse distance weighting (Huizinga and others, 2021).
Topobathymetric Surface and Contour Map Creation
The bathymetric dataset for the river contained about 1,330,000 data points, and the dataset for the quarry contained about 518,000 data points. The topographic data from the UAS survey contained about 85,800,000 data points, and about 55,300,000 data points were classified as “ground.” Topographic data outside of the area collected by the UAS were extracted from aerial lidar data collected in 2014 and are publicly available from the USGS National Elevation Dataset (U.S. Geological Survey, 2017).
The two bathymetric datasets, the “ground” points from the UAS lidar data thinned to a 1.64-ft resolution, and the public lidar data were combined to create a multisource point cloud of the ground in the proposed harbor area and surroundings. The multisource point cloud was used to generate an Esri ASCII grid (Esri, 2022) at a 1.64-ft (0.5-m) resolution, and included manual hydroenforcement of the channel near the north end of the survey area absent in the aerial lidar data. The multisource point cloud and ASCII grid also are provided with associated metadata files as part of the related USGS data release for this project (Huizinga and others, 2021). The ASCII grid surface was contoured at 5-ft intervals using ArcMap software, and the contours were cartographically smoothed and edited to create a topobathymetric contour map (fig. 6).
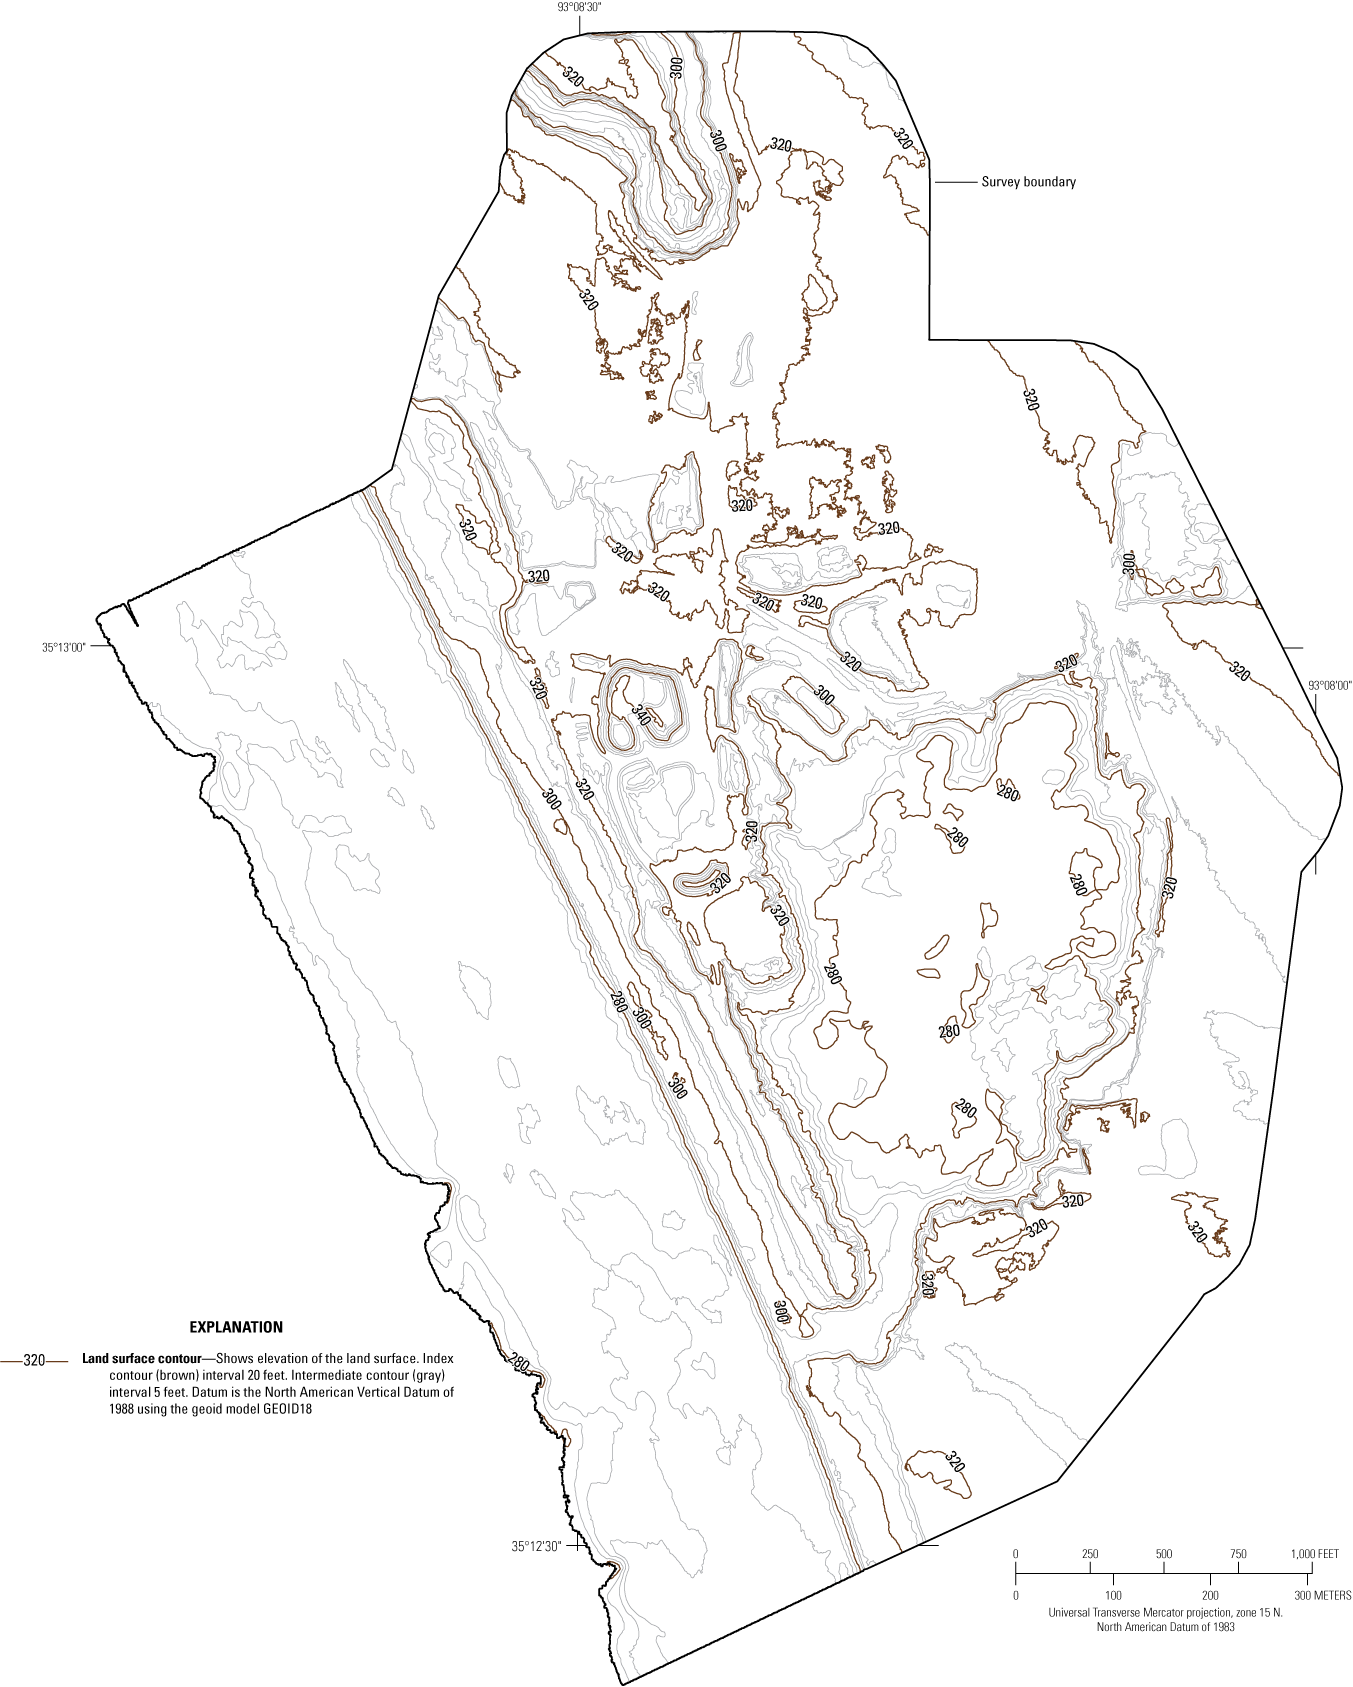
Topobathymetric contours for the area of the proposed slack water harbor near Dardanelle, Arkansas, 2021.
Topobathymetric Surface and Contour Map Quality Assurance
Accuracy of the topobathymetric surface and contours is a function of the survey data accuracy, density of the survey data, and the processing steps involved in the surface and contour creation. The process of data reduction used to obtain the 1.64-ft (0.5-m) gridded bathymetric dataset from the raw survey data likely degraded the accuracy of the gridded dataset relative to the raw data and is represented by the gridded uncertainty of the bathymetric data (fig. 4).
A mapping quality-assurance dataset was extracted from each survey area (river, quarry, and UAS survey) and used to evaluate the degree of accuracy to which the topobathymetric surface represents the elevations in the postprocessed datasets using methods described in Wilson and Richards (2006). The quality-assurance datasets consisted of data points selected at random from the 1.64-ft gridded or thinned data points in each of the individual survey datasets. Points that were selected for the mapping quality-assurance dataset were withheld from the datasets used to create the topobathymetric surface. The three-dimensional topobathymetric surface was tested against the randomly selected quality-assurance datasets to determine the vertical accuracy of the topobathymetric surface in each survey area. The topobathymetric surface tested at a vertical accuracy at the 95-percent confidence level (fig. 7) for each survey area is listed in table 1; the median absolute vertical error of each survey area also is listed in table 1. The substantially larger vertical accuracy and median absolute vertical error of the UAS survey area dataset likely are the result of the inability to thoroughly remove the ground cover vegetation in that dataset, which created more variability in the surface (fig. 7).
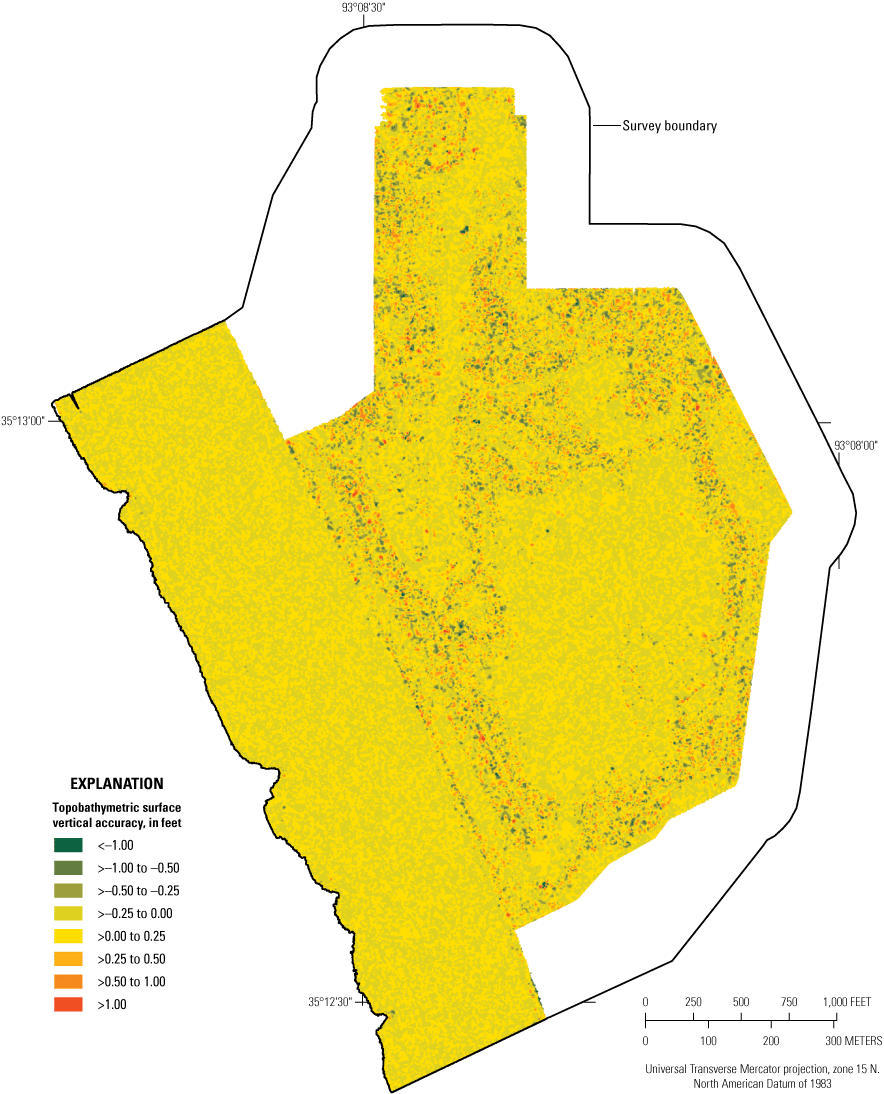
Vertical accuracy of the topobathymetric surface for the area of the proposed slack water harbor near Dardanelle, Arkansas, 2021.
Table 1.
Summary of topobathymetric surface quality-assurance results from different survey areas at the proposed slack water harbor near Dardanelle, Arkansas, 2021.The process of smoothing and cartographic editing of the topobathymetric contours to produce an aesthetic map degrades the positional and vertical accuracy of the contours; however, the contours are used primarily for visualization of the surface in an illustration, so some accuracy degradation is expected. The topobathymetric contours were tested with the mapping quality-assurance datasets used to evaluate the topobathymetric surface. A point was considered a contour elevation evaluation point if it was within a 0.1-ft horizontal distance of a given contour line. The contours tested at a vertical accuracy of 0.80 ft at the 95-percent confidence level; the median absolute vertical error of the contours was 0.12 ft.
References Cited
American Society for Photogrammetry and Remote Sensing, 2019, LAS specification 1.4—R15: Bethesda, Md., The American Society for Photogrammetry and Remote Sensing, 47 p., accessed August 2022 at https://www.asprs.org/wp-content/uploads/2019/07/LAS_1_4_r15.pdf.
Blue Marble Geographics, 2022, Global Mapper (ver. 22.1): Blue Marble Geographics software release, accessed August 29, 2022, at https://www.bluemarblegeo.com/global-mapper-download/.
Calder, B.R., and Mayer, L.A., 2003, Automatic processing of high-rate, high-density multibeam echosounder data: Geochemistry, Geophysics, Geosystems [G3], v. 4, no. 6, 22 p. [Also available at https://doi.org/10.1029/2002GC000486.]
Esri, 2022, Resources for ArcMap (ver. 10.8), accessed August 29, 2022, at https://www.esri.com/en-us/arcgis/products/arcgis-desktop/resources.
Huizinga, R.J., 2010, Bathymetric surveys at highway bridges crossing the Missouri River in Kansas City, Missouri, using a multibeam echo sounder, 2010: U.S. Geological Survey Scientific Investigations Report 2010–5207, 61 p, accessed August 29, 2022, at https://doi.org/10.3133/sir20105207.
Huizinga, R.J., 2022, Bathymetric and velocimetric surveys at highway bridges crossing the Missouri River near Kansas City, Missouri, August 2019, August 2020, and October 2020: U.S. Geological Survey Scientific Investigations Report 2021–5098, 112 p, accessed August 29, 2022, at https://doi.org/10.3133/sir20215098.
Huizinga, R.J., Elliott, C.M., and Jacobson, R.B., 2010, Bathymetric and velocimetric survey and assessment of habitat for pallid sturgeon on the Mississippi River in the vicinity of the proposed Interstate 70 Bridge at St. Louis, Missouri: U.S. Geological Survey Scientific Investigations Report 2010–5017, 28 p, accessed August 29, 2022, at https://doi.org/10.3133/sir20105017.
Huizinga, R.J., Oyler, L.D., and Rivers, B.C., 2022, Bathymetric contour maps, surface area and capacity tables, and bathymetric change maps for selected water-supply lakes in northwestern Missouri, 2019 and 2020: U.S. Geological Survey Scientific Investigations Map 3486, 12 sheets, includes 21-p. pamphlet, accessed August 29, 2022, at https://doi.org/10.3133/sim3486.
Huizinga, R.J., Richards, J.M., and Rivers, B.C., 2021, Use of high-resolution topobathymetry to assess shoreline topography and future development of a slack water harbor near Dardanelle, Arkansas, October 2021: U.S. Geological Survey data release, accessed August 29, 2022, at https://doi.org/10.5066/P9KW1D2D.
International Hydrographic Organization, 2020, IHO standards for hydrographic surveys (6th ed.): Monaco, International Hydrographic Bureau, Special publication no. 44, 41 p., accessed January 2022 at https://iho.int/uploads/user/pubs/standards/s-44/S-44_Edition_6.0.0_EN.pdf.
Richards, J.M., Huizinga, R.J., and Ellis, J.T., 2019, Bathymetric contour map, surface area and capacity table, and bathymetric change map for Sugar Creek Lake near Moberly, Missouri, 2018: U.S. Geological Survey Scientific Investigations Map 3431, 1 sheet, accessed August 29, 2022, at https://doi.org/10.3133/sim3431.
Rydlund, P.H., Jr., and Densmore, B.K., 2012, Methods of practice and guidelines for using survey-grade global navigation satellite systems (GNSS) to establish vertical datum in the United States Geological Survey: U.S. Geological Survey Techniques and Methods, book 11, chap. D1, 102 p. with appendixes. [Also available at https://doi.org/10.3133/tm11D1.]
U.S. Army Corps of Engineers, 2013, Engineering and design—Hydrographic surveying: Washington, D.C., U.S. Army Corps of Engineers, manual no. EM 1110–2–1003, 560 p., accessed January 2022 at https://www.publications.usace.army.mil/Portals/76/Publications/EngineerManuals/EM_1110-2-1003.pdf?ver=gDGVUj_0XR2sXHiIpQZv2Q%3d%3d.
U.S. Geological Survey, 2017, Lidar Point Cloud—USGS National Map 3DEP downloadable data collection: U.S. Geological Survey digital data, accessed August 29, 2022, at https://www.sciencebase.gov/catalog/item/4f70ab64e4b058caae3f8def.
Wilson, G.L., and Richards, J.M., 2006, Procedural documentation and accuracy assessment of bathymetric maps and area/capacity tables for small reservoirs: U.S. Geological Survey Scientific Investigations Report 2006–5208, 24 p. [Also available at https://doi.org/10.3133/sir20065208.]
For more information about this publication, contact:
Director, USGS Central Midwest Water Science Center
1400 Independence Road
Rolla, MO 65401
573–308–3667
For additional information, visit: https://www.usgs.gov/centers/cm-water
Publishing support provided by the
Rolla Publishing Service Center
Suggested Citation
Huizinga, R.J., Richards, J.M., and Rivers, B.C., 2022, Use of high-resolution topobathymetry to assess shoreline topography and potential future development of a slack water harbor near Dardanelle, Arkansas, October 2021: U.S. Geological Survey Scientific Investigations Map 3494, 1 sheet, https://doi.org/10.3133/sim3494.
ISSN: 2329-132X (online)
Study Area
| Publication type | Report |
|---|---|
| Publication Subtype | USGS Numbered Series |
| Title | Use of high-resolution topobathymetry to assess shoreline topography and potential future development of a slack water harbor near Dardanelle, Arkansas, October 2021 |
| Series title | Scientific Investigations Map |
| Series number | 3494 |
| DOI | 10.3133/sim3494 |
| Year Published | 2022 |
| Language | English |
| Publisher | U.S. Geological Survey |
| Publisher location | Reston, VA |
| Contributing office(s) | Missouri Water Science Center, Central Midwest Water Science Center |
| Description | Sheet: 36.00 x 39.50 inches; Data Release |
| Country | United States |
| State | Arkansas |
| County | Dardanelle |
| Other Geospatial | Slack Water Harbor |
| Online Only (Y/N) | Y |
| Google Analytic Metrics | Metrics page |