

Simulation of Potential Water Allocation Changes, Cape May County, New Jersey
Links
- Document: Report (4.35 MB pdf) , HTML , XML
- Data Release: USGS data release - SEAWAT, MODFLOW-2000, and SHARP models used to simulate potential water-allocation changes, Cape May County, New Jersey
- Download citation as: RIS | Dublin Core
Abstract
Saltwater intrusion and declining water levels have been a water-supply problem in Cape May County, New Jersey, for decades. Cape May County is surrounded by saltwater on three sides. Several communities in the county have only one aquifer from which freshwater withdrawals can be made, and that sole source is threatened by saltwater intrusion and (or) substantial declines in water levels caused by groundwater withdrawals. Growth of the year-round and summer tourism populations have caused water demand for some purveyors to approach the full-allocation withdrawal rates set by the New Jersey Department of Environmental Protection, leading these purveyors to request increases in allocations. Simulated water levels resulting from withdrawals including proposed increases in allocations by four purveyors and a shift of some withdrawals from one aquifer to another by a fifth purveyor were compared to simulated baseline water levels with withdrawals at 2012 full-allocation rates.
The Lower Township Scenario simulates proposed full-allocation withdrawals of 1,079 million gallons per year (Mgal/yr) from the Cohansey aquifer, 211 Mgal/yr (24 percent) higher than the 2012 full allocation withdrawals. Lower Township Scenario simulated water levels are between 2 and 4 feet (ft) lower than those of the shallow-aquifer-system Baseline Scenario simulation in much of Lower Township. The simulated 250-milligrams per liter (mg/L) isochlor is a maximum of 750 ft farther eastward than the simulated position in the shallow-aquifer-system Baseline Scenario, and the isochlor is simulated to be 700 ft from the northwestern-most Lower Township Municipal Utility Authority well at the airport in 2050.
The Wildwood Scenario simulates proposed full-allocation withdrawals of 388 Mgal/yr at the Wildwood Water Utility Rio Grande well field in Middle Township from the Rio Grande water-bearing zone (upper Kirkwood Formation) and 776 Mgal/yr from the Atlantic City 800-foot sand (lower Kirkwood Formation). Simulated water levels in the Atlantic City 800-foot sand near the well field are 30–55 ft lower than in the deep-aquifer-system Baseline Scenario, more than 15 ft lower south and west of Cape May Court House, and 5–10 ft lower between Cape May Court House and Woodbine and Upper Township.
The Avalon Scenario simulates proposed full-allocation withdrawals from the Atlantic City 800-foot sand in Avalon Borough of 495 Mgal/yr, which is 141 Mgal/yr (40 percent) higher than the 2012 full-allocation withdrawals. The Cape May Court House Scenario simulates proposed full-allocation withdrawals near Cape May Court House from the Atlantic City 800-foot sand of 495 Mgal/yr, which is 150 Mgal/yr (64 percent) higher than 2012 full-allocation withdrawals. The Strathmere Scenario simulates proposed full-allocation withdrawals in Strathmere from the Atlantic City 800-foot sand of 30 Mgal/yr, which is 11 Mgal/yr (58 percent) higher than 2012 full-allocation withdrawals. All three of these scenarios generally show simulated water levels to be less than 10 ft lower compared to the deep-aquifer-system Baseline Scenario.
The Combined Scenario simulates proposed full-allocation withdrawals, including increased withdrawals from the Atlantic City 800-foot sand in all four locations—the Rio Grande well field, Avalon, Cape May Court House, and Strathmere. Water levels from the Combined Scenario are 40–65 ft lower than those from the deep-aquifer-system Baseline Scenario near the Wildwood Water Utility Rio Grande well field, 15–40 ft lower south of Dennis Township, and 5–15 ft lower in much of the rest of Cape May County.
Introduction
Providing long-term sustainable water supplies in Cape May County (fig. 1) is challenging because of the limited number of viable water sources, proximity to saltwater, substantial summer demand in resort communities, and a sensitive environmental habitat. Groundwater is the sole source of potable water in Cape May County. Saltwater intrusion has led to the abandonment of tens of public- and industrial-supply wells and hundreds of domestic wells (Lacombe and Carleton, 1992), and threatens some existing production wells. Growing water demand plus conversion of some homes with shallow, private wells (with potentially poor water quality) to public supply have led purveyors to request additional allocation from the New Jersey Department of Environmental Protection (NJDEP). To determine the effects of possible increased withdrawals and a shift of withdrawals between two aquifers in Cape May County, New Jersey (fig. 1 and table 1), the U.S. Geological Survey (USGS), in cooperation with the NJDEP, conducted a study to compare six possible future groundwater withdrawal scenarios to Baseline Scenarios in an effort to balance the need for additional water with protection of the limited water resources in the county.
Table 1.
Well construction data for selected production and observation wells in Cape May County, New Jersey.[USGS, U.S. Geological Survey; Obs, observation well; Twp, Township; ft bls, feet below land surface; --, not available; WD, Water Department; MUA, Municipal Utilities Authority; CNSY, Cohansey aquifer; ESRNS, estuarine sand aquifer; KRKDL, lower Kirkwood Formation; KRKDU, upper Kirkwood Formation]
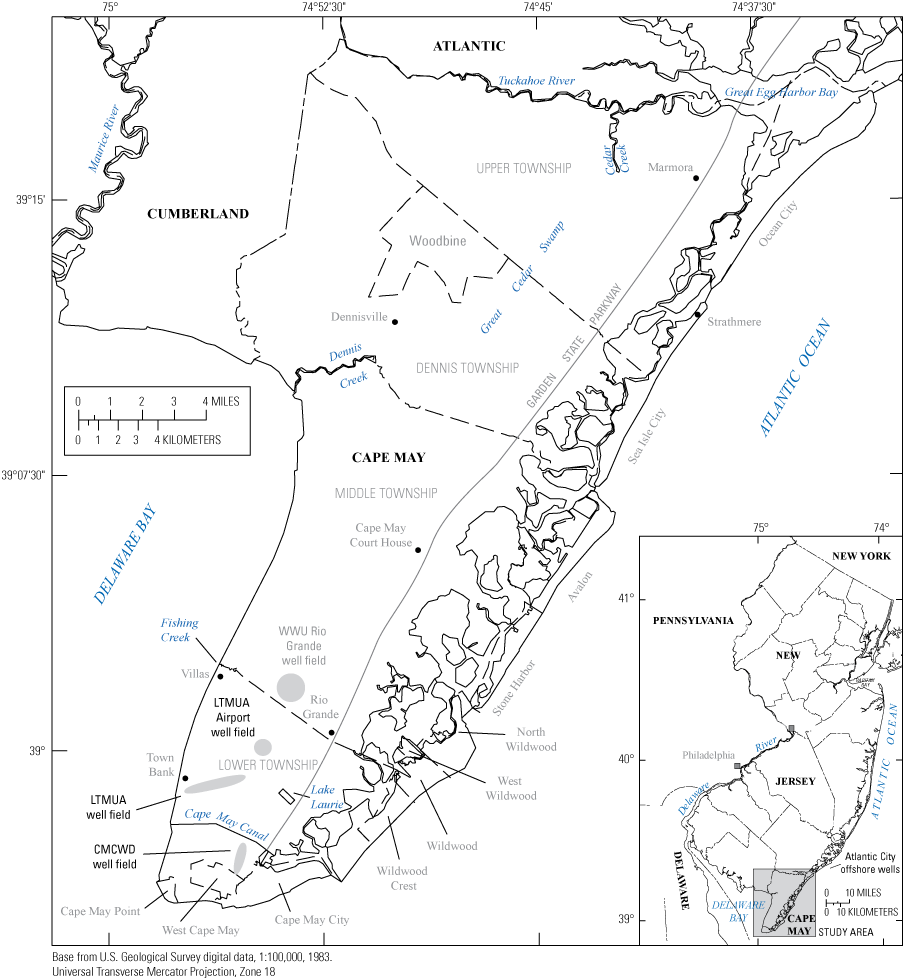
Map showing location of study area, Cape May County, New Jersey.
Water levels in the Cohansey aquifer are below sea level in the southern part of Cape May County (Lacombe and Carleton, 2002; Lacombe and others, 2009), creating a widespread potential for saltwater intrusion. Threats to a sustainable water supply in the Cohansey aquifer include saltwater intrusion from the Atlantic Ocean side of the peninsula, which has resulted in abandonment of Cohansey aquifer wells in the Wildwoods (North Wildwood, Wildwood, West Wildwood, and Wildwood Crest) and Cape May City (Lacombe and Carleton, 1992), and from the Delaware Bay side of the peninsula (fig. 2). Water levels in the Cohansey aquifer have been below sea level in southern Cape May County since before 1958 because of sustained groundwater withdrawals (Gill, 1962). In 2013, groundwater levels were more than 10 feet (ft) below sea level in wells in the Wildwood Water Utility (WWU) Rio Grande well field and south throughout all of Lower Township (U.S. Geological Survey, 2015). With continued withdrawals, water levels are unlikely to recover to above sea level in those locations for the foreseeable future and saltwater intrusion is expected to continue.
Saltwater intrusion in the Cohansey aquifer has been observed in sentinel observation wells at the Delaware Bay shoreline west of the WWU Rio Grande well field since about 1987, and chloride concentrations in some Cohansey aquifer wells in the WWU Rio Grande well field have been increasing since about 2003. Chloride concentrations in Lower Township Municipal Utility Authorities (LTMUA) wells have been generally stable from the time they were installed in the late 1950s through 2013. However, saltwater intrusion remains a concern for the LTMUA because LTMUA PW 1 (090052) is located relatively close to the Delaware Bay shoreline (about 2,000 ft inland) and wells at the LTMUA airport well field are less than 9,000 ft from increasing chloride concentrations at the WWU Rio Grande well field.
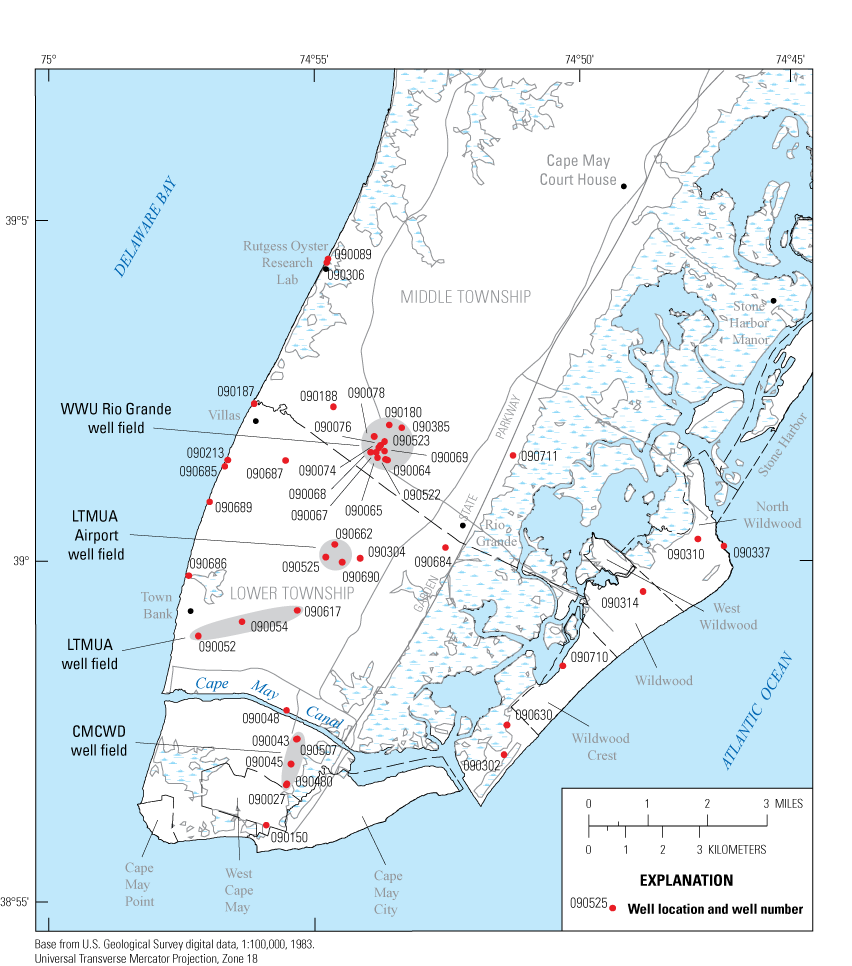
Map showing the location of selected production and observation wells, Cape May County, New Jersey.
In 2008 water levels in the Atlantic City 800-foot sand were about 50 ft below sea level in Ocean City, Cape May County, and more than 90 ft below sea level in the vicinity of Atlantic City, Atlantic County (about 5 miles northeast of Ocean City) (dePaul and Rosman, 2015). Water levels in the aquifer continue a downward trend in coastal communities in Atlantic and Cape May Counties.
To meet future demand in Cape May County, water purveyors—LTMUA, Wildwood Water Utility, Avalon Borough Water Utilities, New Jersey American Water–Cape May Court House, and New Jersey American Water–Strathmere, have requested an increase in full-allocation rates specified in NJDEP water-allocation permits. To determine the effects of the proposed full-allocation withdrawals on the saltwater intrusion rates in the Cohansey aquifer and water levels in the Cohansey aquifer, Rio Grande water-bearing zone, and Atlantic City 800-foot sand, six groundwater flow model scenarios were simulated. In the LTMUA Scenario, proposed full-allocation withdrawals from the Cohansey aquifer are 213 Mgal/yr higher than 2012 full-allocation withdrawals. In the Wildwood Scenario, 766 Mgal/yr of the 2012 Rio Grande water-bearing zone full-allocation withdrawals are simulated to instead be from the Atlantic City 800-foot sand. In the Avalon, Court House, and Strathmere Scenarios, proposed full-allocation withdrawals from the Atlantic City 800-foot sand are higher than the 2012 full-allocation withdrawals in the respective well fields. The Combined Scenario includes the combined changes in withdrawals of the Wildwood, Avalon, Court House, and Strathmere Scenarios.
Purpose and Scope
This report discusses the potential effects of withdrawals at proposed full-allocation rates on saltwater intrusion rates in the Cohansey aquifer and water levels in the Cohansey aquifer, Rio Grande water-bearing zone, and Atlantic City 800-foot sand in Cape May County. Simulated water levels, changes in water levels, and saltwater-front location in 2050 resulting from simulated proposed full-allocation withdrawals for LTMUA from the Cohansey aquifer are discussed and are presented in tables and figures. Simulated water levels and differences in water levels compared to the Baseline Scenario for the Atlantic City 800-ft sand for five scenarios are discussed and presented in tables and figures. The groundwater model archive including the input and output data files generated as part of this study are available as a USGS data release in Carleton (2021).
Well-Numbering System
Wells in the report are identified by their New Jersey Unique Identification (NJUID) number. The well number consists of a county code followed by a sequential number assigned to the well, for example 090043. All of the wells identified in this report are in Cape May County with well numbers starting with 09.
Study Area and Hydrogeologic Setting
The study area is Cape May County, with emphasis on the barrier-island communities along the Atlantic coast, the WWU Rio Grande well field in southern Middle Township, and LTMUA wells in Lower Township. All potable water supplied to houses and businesses in Cape May County is groundwater withdrawn from the five aquifers—Holly Beach water-bearing zone, estuarine sand, Cohansey aquifer, Rio Grande water-bearing zone, and Atlantic City 800-foot sand—that underlie the peninsula (fig. 3). The hydrogeology of Cape May County is described in detail in a number of reports, including Gill (1962), Zapecza (1989), and Lacombe and Carleton (2002) and is summarized below.
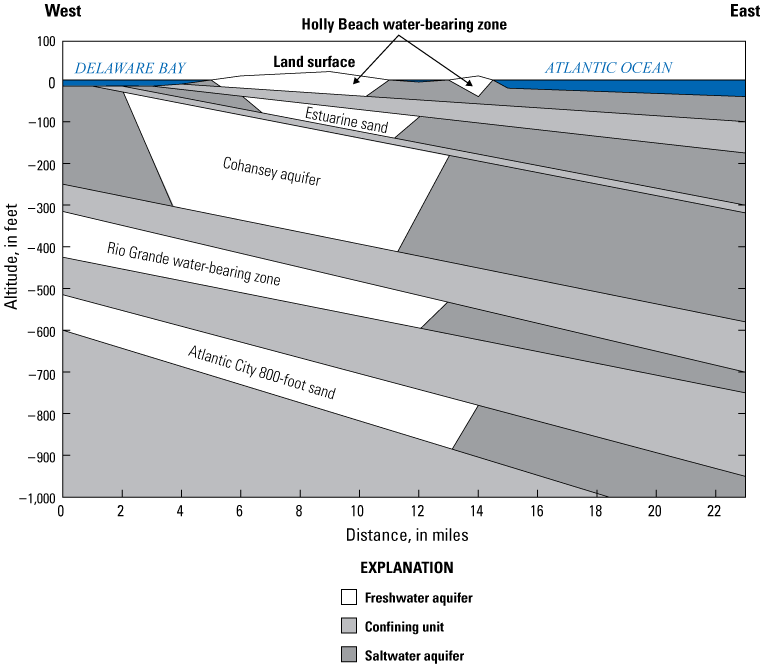
Schematic hydrogeologic section of Cape May County, New Jersey.
The Holly Beach water-bearing zone is present only in Cape May County and is the water-table aquifer. The estuarine sand is a minor confined aquifer below the Holly Beach aquifer that is present only in the southern half of Cape May County (south of the Middle Township/Dennis Township boundary), where it is overlain by a confining unit believed to have been deposited in the channel of the ancestral Delaware River estuary during a period of high sea level (Gill, 1962). The Cohansey aquifer is part of the Kirkwood-Cohansey aquifer system that is present throughout much of the southern half of New Jersey and is identified as a distinct confined aquifer only in southern Cape May County. The Cohansey aquifer transitions from fully confined in southern Cape May County (occurring at depths of about 200 to 300 ft below land surface) to semi-confined in northern Middle Township and Dennis Township to unconfined in northwestern Cape May County. The line demarcating where the Holly Beach aquifer no longer is present and the unconfined Cohansey aquifer is the water-table aquifer is not well defined but is sometimes for convenience considered to be coincident with the northeast boundary of Cape May County (Lacombe and Carleton, 2002). The Rio Grande water-bearing zone (also known as the Upper Kirkwood aquifer) is a thin (about 100-ft thick or less), sandy stratum within the Kirkwood-Cohansey aquifer system that is present within the confining unit separating the Cohansey aquifer and the underlying Atlantic City 800-foot sand. The Rio Grande water-bearing zone was first described by Gill (1962) as present in Cape May County only but has since been identified as a narrow band near the Atlantic coast extending from southernmost Cape May County through Atlantic County and into southernmost Ocean County (Zapecza, 1989; Pope and others, 2012). The Atlantic City 800-foot sand (also known as the Lower Kirkwood aquifer) is a major confined aquifer that is the deepest component of the Kirkwood-Cohansey aquifer system and underlies Cape May County and parts of Cumberland, Atlantic, Burlington, and Ocean Counties.
Although parts of Cape May County are underlain by five aquifers containing potable water, for several municipalities only one of the five aquifers contains potable water in sufficient quantities for public supply. The Holly Beach water-bearing zone and the estuarine sand are tapped for water supply primarily by domestic and commercial self-supply wells. The Holly Beach water-bearing zone has high iron concentrations (>0.3 milligram per liter [mg/L]) in some locations (Lacombe and Carleton, 2002) and, because it is the water-table aquifer, is vulnerable to saltwater intrusion from surface water and anthropogenic contamination, such as septic-system discharges or accidental chemical spills. The estuarine sand is affected by saltwater intrusion in western Lower Township in and near Villas (Lacombe and Carleton, 1992) and is limited in its extent and productivity. The Cohansey aquifer is an important water-supply aquifer in Cape May County and is tapped by the LTMUA, WWU, New Jersey American Water–Cape May Court House, Woodbine Water Company, and numerous campground, golf-course, and other commercial and domestic wells. The Cohansey aquifer is the only potable-water aquifer tapped by the LTMUA, in part because in Lower Township the underlying aquifers have sodium concentrations that exceed the secondary drinking water standard (New Jersey Department of Environmental Protection, 2005) of 50 mg/L. The only substantial withdrawals from the Rio Grande water-bearing zone in Cape May County are made at the WWU Rio Grande well field. The Atlantic City 800-foot sand is the primary, if not sole, source of potable water for Cape May City, Cape May Court House, and the barrier island communities of Stone Harbor, Avalon, Sea Isle City, Strathmere, and Ocean City.
WWU is the only purveyor in Cape May County that taps all five aquifers. At the Rio Grande well field, WWU in the first quarter of 2014 withdrew about 3 percent of its supply from the Holly Beach water-bearing zone, 3 percent from the estuarine sand, 54 percent from the Cohansey aquifer, and 40 percent from the Rio Grande water-bearing zone and Atlantic City 800-foot sand (Edward Cerrone, Wildwood Water Utility, oral commun., 2014). WWU has four withdrawal wells open to the Cohansey aquifer on the barrier island, but because of saltwater intrusion concerns, these wells are used for aquifer storage and recovery (ASR), in which water from the Rio Grande well field is injected during the offseason and from which water is withdrawn during the summer tourist season.
Downward vertical flow from the water-table aquifer is the primary source of recharge for the estuarine sand and the confined part of the Cohansey aquifer, and lateral flow from northern Cape May County and inflow from saline parts of the aquifers make up the remainder. The altitude of the water table in the Holly Beach water-bearing zone in Middle and Lower Townships ranges from near sea level to about 15 ft above sea level (Lacombe and Carleton, 2002). The potentiometric surface of the estuarine sand aquifer is similar to, but lower than, that in the overlying Holly Beach water-bearing zone north of the Rio Grande well field, but it is below sea level in the vicinity of the WWU Rio Grande well field. The potentiometric surface of the Cohansey aquifer is about the same altitude as the water table in northern Cape May County, but it is below sea level from central Middle Township south, a function of both the greater confinement and higher withdrawals in southern Cape May County (Lacombe and Carleton, 2002; dePaul and Rosman, 2015).
Chloride in Groundwater in Cape May County
Saltwater intrusion has been documented in Cape May County since the 1940s (Gill, 1962; Lacombe and Carleton, 1992; Lacombe and Carleton, 2002), and sodium and chloride concentrations elevated above background levels are a concern in all five aquifers used for water supply in the county. Most areas north of Middle Township that are more than 0.5 mile from surficial saltwater are underlain by aquifers containing freshwater to a depth of about 900 ft (Lacombe and Carleton, 2002). However, no reliable source of fresh groundwater underlies the Wildwood communities, Cape May City, and Cape May Point because of elevated sodium and chloride concentrations in all the aquifers. The secondary drinking water standards for sodium and chloride are 50 and 250 mg/L, respectively (New Jersey Department of Environmental Protection, 2005). Chloride concentrations greater than 20 mg/L indicate contamination from anthropogenic sources (for example, road salt or septic systems) or intrusion of saltwater from adjacent, overlying, or underlying sources of groundwater.
Holly Beach Water-Bearing Zone and Estuarine Sand Aquifer
The Holly Beach water-bearing zone is the water-table aquifer in southern Cape May County (south of Dennis Township) and, therefore, directly receives freshwater recharge from precipitation, but is also vulnerable to surficial saltwater intrusion in areas close to saltwater wetlands, bays, and the ocean. The estuarine sand aquifer is present only in southern Cape May County and the aquifer generally is fresh beneath the mainland areas and salty beneath the Wildwoods and Cape May City. Saltwater intrusion in the estuarine sand has been documented since the 1960s in Villas (Lacombe and Carleton, 1992; Lacombe and Carleton, 2002).
Cohansey Aquifer
Saltwater intrusion in the Cohansey aquifer has been documented in Cape May City since the mid-1940s, in Villas and the Wildwood communities since the mid-1960s, and west of the WWU Rio Grande well field since the mid-1970s (Lacombe and Carleton, 1992; Lacombe and Carleton, 2002; Vincent dePaul, U.S. Geological Survey, written commun., 2014). Chloride concentrations in samples collected from selected wells open to the Cohansey aquifer in Cape May County (fig. 4) show that chloride concentrations greater than 250 mg/L underlie the mouth of Fishing Creek, Cape May Point, West Cape May and Cape May City. Also, the Cohansey aquifer beneath the Wildwood communities and Stone Harbor Manor presumably has concentrations greater than 250 mg/L, but there are no recent data to confirm this assumption.
In some locations in southern Cape May County, saltwater intrusion in the Cohansey aquifer is from lateral flow of saltier, offshore water drawn towards pumped wells. However, in some locations the saltwater intrusion is likely from saltier water entering the aquifer vertically because of induced flow through overlying or underlying confining units. In areas of upward intrusion and vertical flow of denser saline water towards a withdrawal well (upconing), if pumping ceases and recharge of freshwater through overlying confining units occurs, the denser saline water will sink, and chloride concentrations will decline. Aspects of saltwater intrusion near the WWU Rio Grande, LTMUA, and Cape May City Water Department (CMCWD) well fields are discussed below.
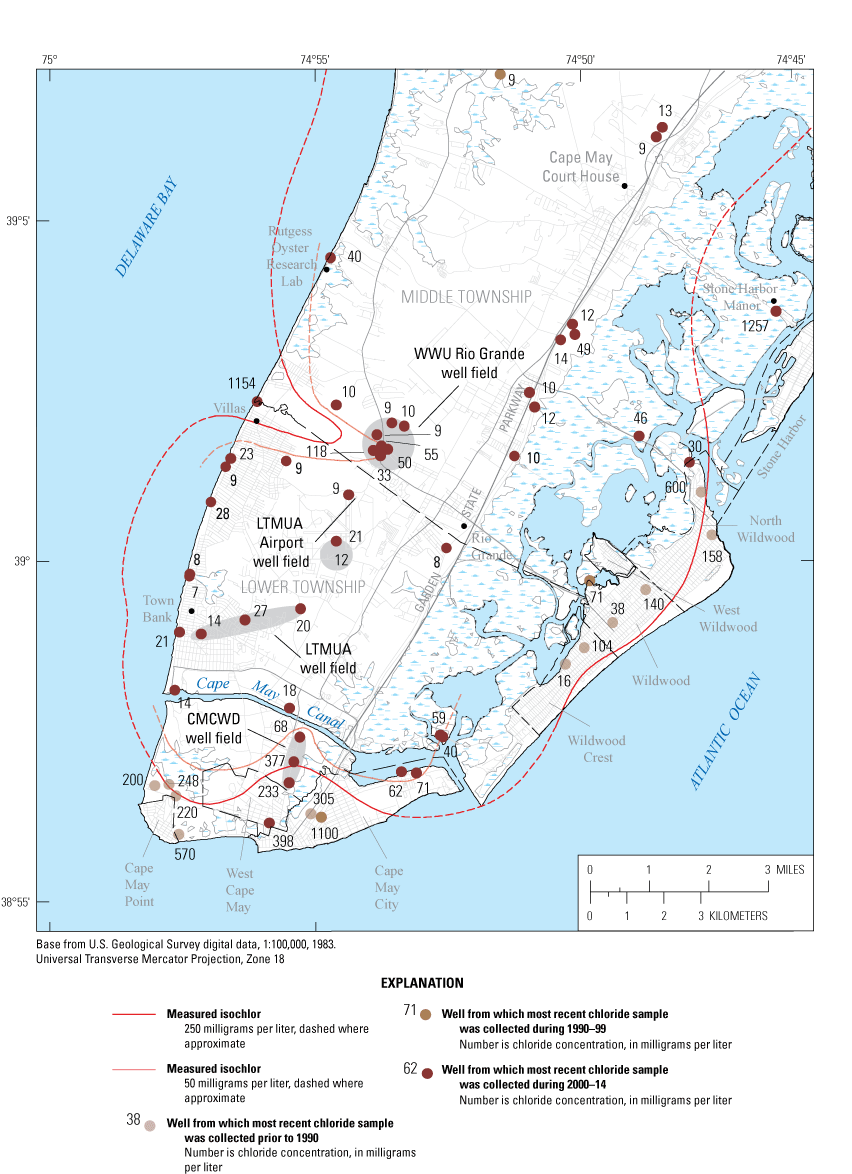
Map showing chloride concentrations in the Cohansey aquifer, southern Cape May County, New Jersey.
Wildwood Water Utility Rio Grande Well Field
Chloride concentrations in water-quality samples collected from WWU Rio Grande well field Rio Grande 28 (well 090068, fig. 2) have increased from about 29 mg/L in 2006 to as much as 310 mg/L in 2017 (Ed Cerrone, Wildwood Water Utility, written commun., 2017) (figs. 4 and 5A). Chloride concentrations reached the drinking water standard of 250 mg/L by 2017, about two decades faster than the projections of Lacombe and others (2009). The future rate of increase of chloride concentrations will be governed partly by changes in groundwater withdrawals. Any future increased withdrawal rates from the Cohansey aquifer by LTMUA and others possibly will increase the rate of intrusion, and any future reduced withdrawal rates from the Cohansey aquifer in the WWU Rio Grande well field will possibly reduce the rate of intrusion.
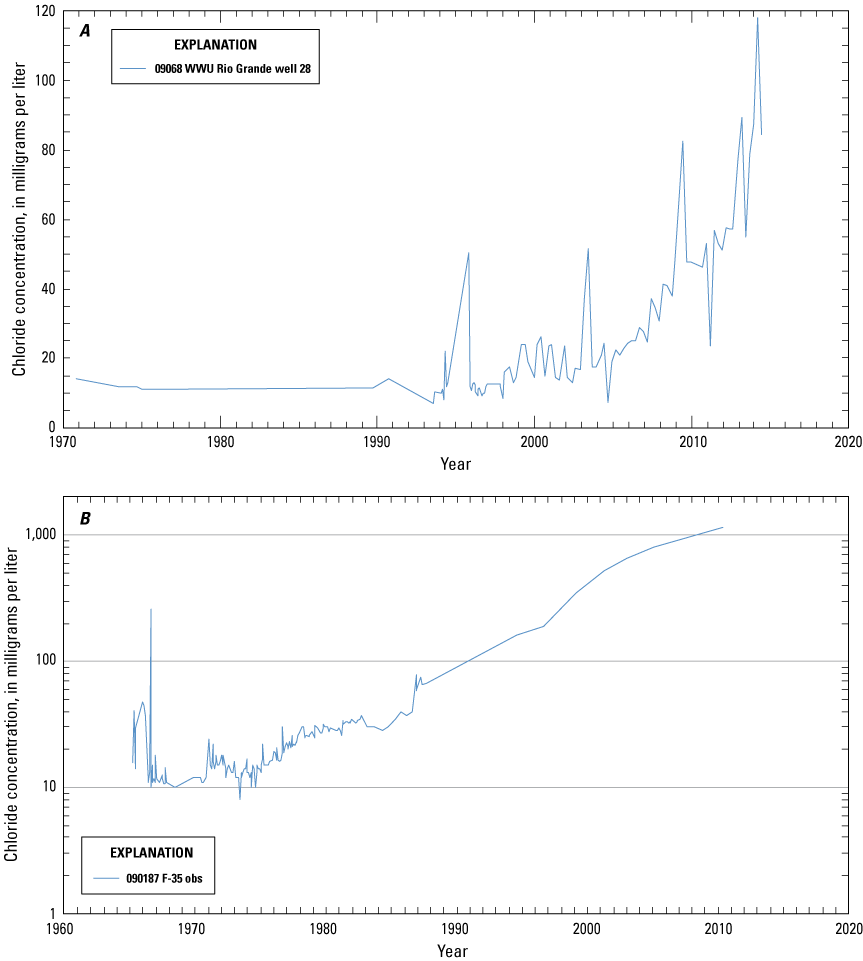
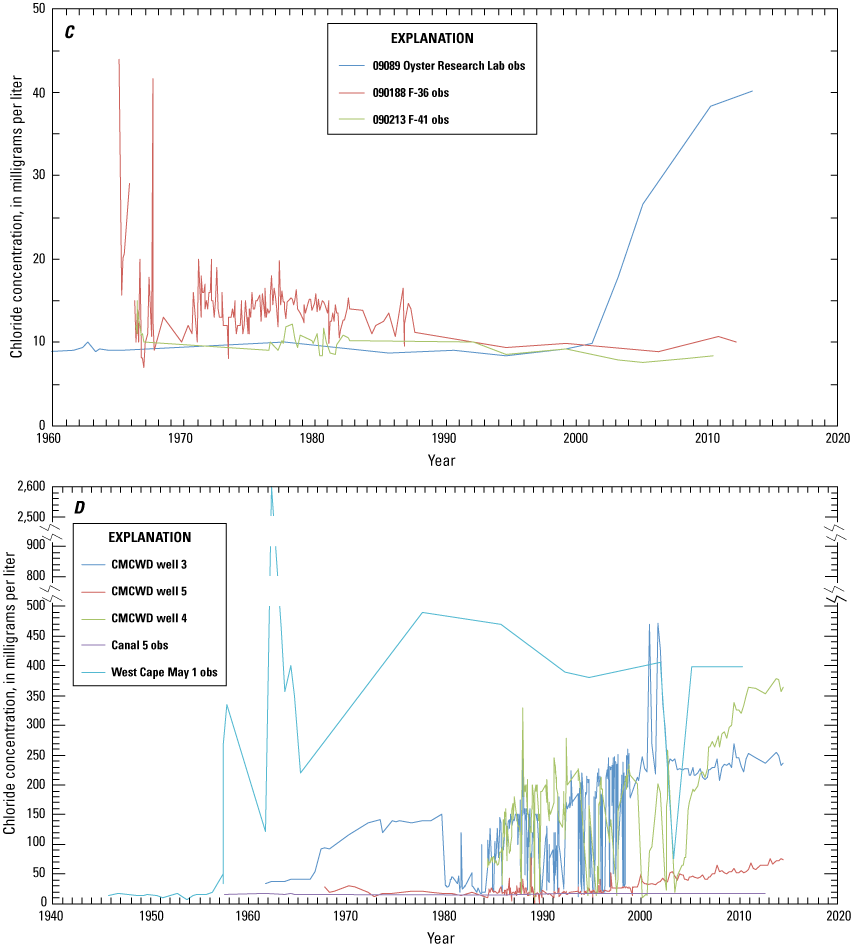
Graphs A-D showing chloride concentrations in samples collected from selected wells open to the Cohansey aquifer, southern Cape May County, New Jersey 1946–2014.
Chloride concentrations in samples from observation well F-35 obs (090187) open to the Cohansey aquifer at the mouth of Fishing Creek, 2.1 miles west-northwest of the WWU well field have been increasing since about 1975, from 16 mg/L in 1975 to 1,154 mg/L in 2010 (figs. 4 and 5B). The increasing Cohansey aquifer chloride concentrations at the mouth of Fishing Creek and the WWU Rio Grande well field are consistent with lateral saltwater intrusion. Chloride concentrations in samples from observation well Oyster Lab 4 (090089) near the Delaware Bay shoreline about 3 miles north of the mouth of Fishing Creek began to increase in the early 2000s, indicating possible saltwater intrusion from the northwest towards the WWU Rio Grande well field, but concentrations remained at or below 40 mg/L through 2018 (figs. 4 and 5C). The chloride concentrations in samples from observation well F-36 (090188) in a wetland area 1.3 miles east of the mouth of Fishing Creek and 1.0 mile northwest of the WWU well field and observation well F-41 (090213) near the Delaware Bay shoreline 1.1 miles south-southwest of the mouth of Fishing Creek and 2.4 miles west of the WWU well field have not increased through 2010 (figs. 4 and 5C), indicating that the lateral saltwater intrusion that has reached the WWU Rio Grande well field is apparently occurring in a tongue that is much longer than it is wide (fig. 4).
Lower Township Municipal Utility Authority Well Fields
The proximity of documented saltwater intrusion in the Cohansey aquifer near the Atlantic Ocean and Delaware Bay shorelines and the lack of offshore chloride data, have caused investigators to assume that the salt front in the Cohansey aquifer is a short distance (thousands of feet) offshore from LTMUA PW 1 (090052) and that the primary threat to LTMUA wells is from the west. Simulations of the predevelopment location of the saltwater front in the Cohansey aquifer (Lacombe and others, 2009) indicate that LTMUA PW 1 (090052) is the closest LTMUA well to the predevelopment saltwater front, but there are not adequate data available to calibrate the model to offshore chloride concentrations and transient aquifer response to the Holocene post-glacial-maximum sea-level rise (Lacombe and others, 2009). The location of the saltwater front near the LTMUA wells is not known and may or may not be an imminent threat. Because saltwater intrusion has begun to reach the Rio Grande well field, LTMUA wells at the airport are at risk for saltwater intrusion from the northwest, and it is not known whether LTMUA wells near the airport will be affected by saltwater intrusion before or after LTMUA PW 1 (090052).
Cape May City Water Department Well Field
Upconing of denser, saltier water during periods of greater withdrawals, and subsequent decline of chloride concentrations during periods of reduced withdrawals, may explain the fluctuating chloride concentration in samples from Cape May City Water Department (CMCWD) wells PW 3 (090027) and PW 4 (090045, figs. 4 and 5D). Chloride concentrations in water from CMCWD PW 3 increased from 34 mg/L to 42 mg/L during 1961-1965 then increased from 54 mg/L to 150 mg/L during 1966-1979 after wells CMCWD PW 4 and PW 5 were installed in 1965. Chloride concentrations in CMCWD PW 3 were generally less than pre-1966 concentrations (less than 50 mg/L) during 1980–83, perhaps because CMCWD PW 1 was pumped to waste for about a year around this time in hopes of drawing freshwater towards CMCWD PW 3 (Pierre Lacombe, U.S. Geological Survey, oral commun., 2012). Seasonal high chloride concentrations in samples from CMCWD PW 3 then increased from about 100 mg/L in 1984 to about 250 mg/L in 1998. Except for a few unexplained high concentrations during 2000–02, chloride concentrations in samples from CMCWD PW 3 remained at about 250 mg/L or less since CMCWD reduced withdrawals from the Cohansey aquifer in 1998.
Chloride concentrations in samples from CMCWD PW 4 (fig. 5C) were, in general, like those from CMCWD PW 3, although concentrations in CMCWD PW 4 were lower during 2000–04 when it was used as a recharge well during the winter (Carl Behrens, Cape May City Water Department, oral commun., 2014). Chloride concentrations in CMCWD PW 4 increased during 2005–10 and were between 350 mg/L and 380 mg/L during 2011–14.
The saltwater intrusion affecting CMCWD PW 3 (090027) is likely vertical intrusion from underlying sediments; if lateral intrusion from the south was the dominant source of saline water, chloride concentrations in samples from CMCWD PW 3 (090027) would be consistently higher than those from CMCWD PW 4 (090045). Furthermore, water levels below sea level would have caused continued lateral intrusion and CMCWD PW 3 (090027) chloride concentrations would have increased during 1999–2014.
It is possible that water is also moving vertically downward from the estuarine sand aquifer to the Cohansey aquifer near CMCWD PW 3 (090027) and PW 4 (090045) because a chloride concentration of 300 mg/L was measured in a sample collected from a well completed in the estuarine sand aquifer in 1987, and the confining unit is locally thinner (25 ft thick) near CMCWD PW 3 (090027) than near CMCWD PW 5 (090043, 90 ft thick) (Lacombe and Carleton, 2002). If chloride concentrations in the overlying estuarine sand aquifer have not increased above 400 mg/L, this may explain concentrations in samples from CMCWD PW 3 (090027) and PW 4 (090045) generally remaining below 400 mg/L.
Chloride concentrations in samples from CMCWD PW 5 (090043) rose steadily after the mid-1990s; concentrations were greater than 50 mg/L in 2007 and rose to 99 mg/L in 2018 (fig. 5C). The rising chloride concentrations in CMCWD PW 5 clearly indicate saltwater intrusion is affecting the well, but it is not yet clear whether that intrusion is lateral from the south, upward (upconing), downward (downconing), or some combination of the three.
Chloride concentrations in samples from USGS observation well West Cape May 1 obs (090150, figs. 4 and 5D), south of the Cape May City well field, began to increase in the late 1950s, spiked in 1962 when the wellhead was flooded by seawater during the March nor’easter, then remained below 500 mg/L from 1977 to 2010, despite water levels remaining below sea level in the area since before 1958 (Gill, 1962, Lacombe and Carleton, 2002, dePaul and Rosman, 2015). Chloride concentrations in samples from USGS observation well Canal 5 obs (090048, figs. 4 and 5D), north of CMCWD PW 5 (090043), have remained constant at background concentrations of less than 20 mg/L from 1958 to 2012.
Rio Grande Water-Bearing Zone and Atlantic City 800-Foot Sand
The Rio Grande water-bearing zone contains water with chloride concentrations greater than 250 mg/L and sodium concentrations greater than 50 mg/L beneath all barrier-island communities south of Sea Isle City and south of the Cape May Canal (Lacombe and Carleton, 2002; Vincent dePaul, U.S. Geological Survey, written commun., 2014). The Atlantic City 800-foot sand contains water with chloride concentrations greater than 250 mg/L south of Middle Township and North Wildwood and sodium concentrations greater than 50 mg/L south of Dennis Township and Sea Isle City. Although sodium and chloride concentrations are a substantial concern in the Rio Grande water-bearing zone and Atlantic City 800-foot sand, no pattern of saltwater intrusion has been detected, despite potentiometric surfaces that are below sea level. The lack of observed saltwater intrusion is likely because the transition zone is sufficiently wide that any intrusion that may have occurred is obscured by the natural variability of chloride and sodium concentrations.
Simulation of Groundwater Flow
Scenario simulations for this study were done using three groundwater-flow models developed or revised by Lacombe and others (2009); the models are described in detail in that report. For this study, proposed full-allocation withdrawals from the Cohansey aquifer (Lower Township scenario) were simulated with the shallow-aquifer system, transient, variable-density model developed by Lacombe and others (2009). Proposed full-allocation withdrawals from the Rio Grande water-bearing zone and the Atlantic City 800-foot sand for the Wildwood, Avalon, Court House, Strathmere, and Combined scenarios were simulated with the deep-aquifer system, steady-state model of Cape May County created by Voronin and others (1996) and modified by Pope (2006) and Lacombe and others (2009). Boundary flows for the deep-aquifer system model were simulated with the steady-state model of the Coastal Plain developed by Pope and Gordon (1999) and revised by Lacombe and others (2009).
Approach
The effects of proposed full-allocation groundwater withdrawals are evaluated by comparing baseline scenario results with the results of various full-allocation scenarios. To assess the effects of proposed withdrawals by LTMUA (Lower Township Scenario), water levels and saltwater front location in 2050 are compared to results of a transient baseline simulation that has full-allocation withdrawals beginning at actual 2003 rates and increasing to 2012 full-allocation rates by 2050. Both the baseline and proposed full-allocation scenarios are simulated using the shallow-aquifer-system, variable-density model developed by Lacombe and others (2009). The Baseline Scenario was modified from Scenario 4 of Lacombe and others (2009) and is described in the “Shallow-Aquifer-System Baseline Scenario” Section of this report. The Lower Township Scenario simulates a proposed increase in the full-allocation withdrawal rate by LTMUA by increasing withdrawals from actual 2003 rates to the proposed full-allocation rate in 2050.
The effects of changes to proposed full-allocation withdrawals from the Rio Grande water-bearing zone and Atlantic City 800-foot sand by Wildwood Water Utility, Avalon Borough Water Utilities, New Jersey American Water–Cape May Court House, and New Jersey American Water–Strathmere are simulated in individual scenarios and in the Combined Scenario. The resulting water levels are compared to those from a deep-aquifer-system Baseline Scenario. The baseline and full-allocation scenarios are simulated using a steady-state coupled-model approach. The baseline simulation of 2012 full-allocation withdrawals is a modification of Scenario 2 of Lacombe and others (2009) using the constant-density Cape May Atlantic City 800-foot sand and Rio Grande water-bearing zone (CMAC) model, described in the “Deep-Aquifer-System Baseline Scenario” section of this report. The boundary of the sub-regional CMAC model does not extend to the natural hydrologic boundaries of the deep-aquifer system. Therefore, the New Jersey Coastal Plain regional multi-density model (NJCP Sharp) of Pope and Gordon (1999), as revised by Lacombe and others (2009), was used to supply fluxes across the arbitrary lateral and vertical model boundaries of the CMAC model of Voronin and others (1996), as revised by Pope (2006) and Lacombe and others (2009). Lacombe and others (2009) conclude that the steady-state, constant-density CMAC model (as opposed to a transient and (or) variable density model) provides accurate simulations of future conditions because water levels in the deep aquifers respond relatively quickly to changes in withdrawals, substantial changes in sodium and chloride concentrations in the deep aquifers have not been observed in Cape May County, and the estimated location of the 250-mg/L isochlor is distant from production wells.
Simulated Groundwater Withdrawals
Groundwater withdrawals for the scenarios are summarized in table 2 and detailed in tables 3 and 4. The following discussion emphasizes the differences between the proposed full-allocation scenarios of this study and those of Lacombe and others (2009).
Table 2.
Proposed and 2012 full-allocation withdrawal rates for Lower Township Municipal Utilities Authority, Wildwood Water Utility, Avalon Borough, New Jersey American Water—Cape May Court House, and New Jersey American Water—Strathmere, Cape May County, New Jersey.[KRKDU, upper Kirkwood Formation; KRKDL, lower Kirkwood Formation; Mgal/yr, million gallons per year]
Table 3.
Simulated withdrawals from shallow-aquifer-system production wells, Cape May County, New Jersey.[USGS, U.S. Geological Survey; NJ, New Jersey; DEP Department of Environmental Protection; ft, foot; Mgal/yr, million gallons per year; WD, Water Department; WC, Water Company; WU, Water Utility; LT, Lower Township; MUA, Municipal Utilities Authority; Twp, Township; Bd of Ed, Board of Education; Inc, Incorporated; Co, Company; Ctr, Center; Insts, Institutions; Dept, Department; Irr, Irrigation; Dom, Domestic; Ind, Industrial; Rec, Recreational; PW, Pumping well; CKDD, undifferentiated Kirkwood-Cohansey aquifer system; CPMY, Cape May formation; HLBC, Holly Beach water-bearing zone; ESRNS, estuarine sand aquifer; CNSY, confined Cohansey aquifer; --, not available or not applicable]
Baseline or LTMUA Scenario withdrawal that is different from Lacombe and others (2009) Scenario 4.
Table 4.
Simulated withdrawals from deep-aquifer-system production wells, Cape May County, New Jersey.[USGS, U.S. Geological Survey; NJDEP, New Jersey Department of Environmental Protection; Mgal/yr, million gallons per year; KRKDU, upper Kirkwood Formation; KRKDL, lower Kirkwood Formation; NJAW, New Jersey American Water Company; Twp, Township; WD, Water Department; Co, Company; PW, Pumping well; Assoc, Association; --, not available or not applicable]
Wildwood Water Utility withdrawals simulated as being from layer 2 instead of layer 1 in the Wildwood and Combined Scenarios.
Withdrawal that is different from Lacombe and others (2009) Scenario 2.
Shallow-Aquifer-System Baseline Scenario
A transient baseline simulation of the shallow-aquifer system for 1896–2050 was developed to compare with the proposed full-allocation withdrawal scenario simulation for LTMUA. The shallow-aquifer-system Baseline Scenario includes minor modifications of the withdrawal rates used in Scenario 4 of Lacombe and others (2009). In Scenario 4, withdrawals are set at full build-out rates (the rate of withdrawals required to supply all homes and businesses if all land is developed to the full extent of each municipality’s zoning as of 2005), withdrawals from LTMUA PW 1 (090052) ceased in 2010, withdrawals from LTMUA PW 2 (090054) and PW 3 (replaced by PW 7, 090617) are maintained at 2003 rates through 2050, and all increases in withdrawals after 2010 are from two existing and two hypothetical wells near the airport. In Scenario 4, WWU withdrawals are set at full build-out rates, but some withdrawals are shifted from the Cohansey aquifer to the deep-aquifer system after 2010 and proposed full-allocation in WWU withdrawals are from the deep-aquifer system. Withdrawals in the shallow-aquifer-system baseline simulation for this study are the same as Scenario 4 for all purveyors other than LTMUA. Baseline Scenario LTMUA withdrawals were modified as follows: (1) the total LTMUA withdrawal rate is changed from the full build-out rate, 880 million gallons per year (Mgal/yr), to the 2012 full-allocation rate, 868 Mgal/yr; (2) withdrawals from Well 1 (still in service in 2014) continue through 2019; and (3) simulated withdrawals from Well 1 during 2010–19 are offset by reducing to zero simulated withdrawals from one well at the airport during 2010-19. The shallow-aquifer-system Baseline Scenario includes full-allocation, rather than full build-out, withdrawals for LTMUA, therefore, it has characteristics of Lacombe and others (2009) Scenario 2 (full-allocation) and Scenario 4 (full build-out).
The simulated Cohansey aquifer water levels from the shallow-aquifer-system Baseline Scenario (fig. 6) are within 1 ft of those from Scenario 4 in Lacombe and others (2009). The simulated locations of the 250-mg/L isochlor in 2050 for the shallow-aquifer-system Baseline Scenario (fig. 6) are also essentially identical to those for Scenario 4 in Lacombe and others (2009). The similarities of the water levels and isochlor locations between Scenario 4 and the shallow-aquifer-system Baseline Scenario indicate that the minor differences in simulated LTMUA withdrawals between the two scenarios has little effect.
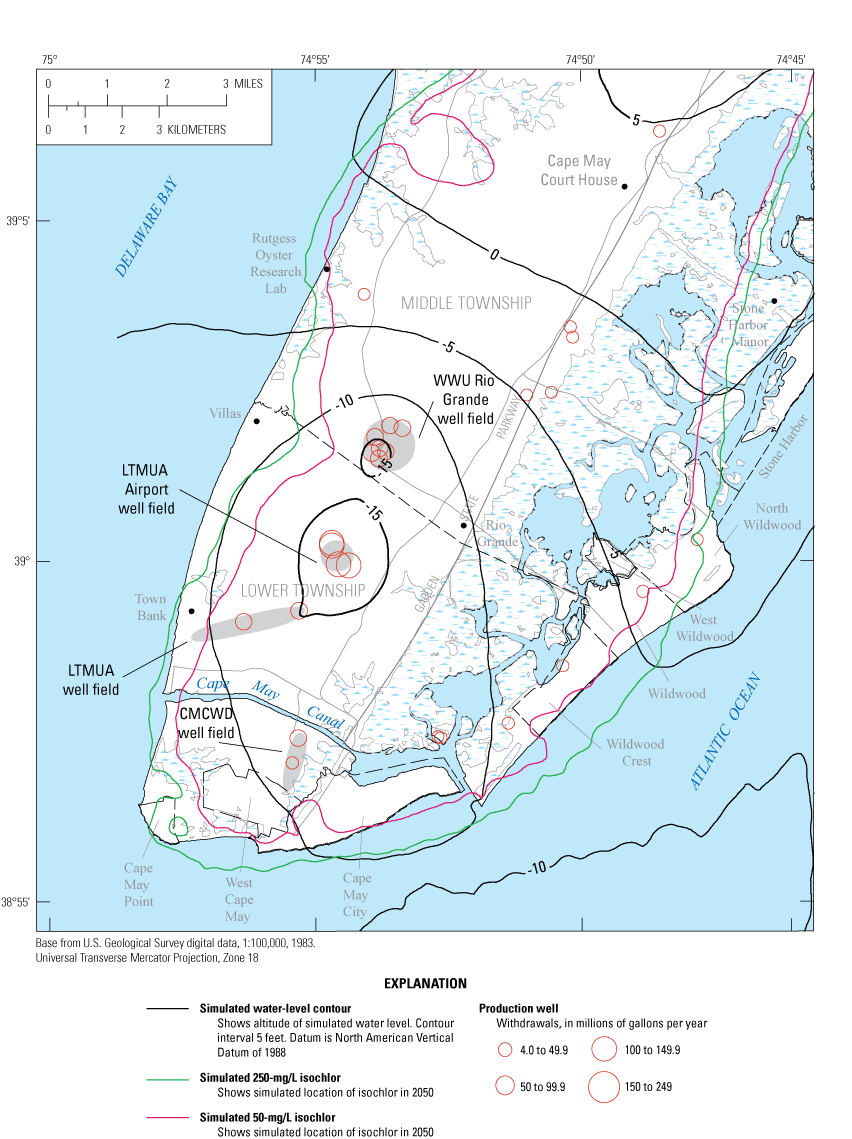
Map showing simulated water levels, chloride concentrations, and groundwater withdrawals in the Cohansey aquifer in 2050 for the shallow-aquifer-system Baseline Scenario, southern Cape May County, New Jersey.
Deep-Aquifer-System Baseline Scenario
Simulations of the deep-aquifer system for this study used the steady-state, coupled-model approach of Voronin and others (1996), Pope (2006), and Lacombe and others (2009) in which fluxes across lateral boundaries of the CMAC model are derived from the NJCP Sharp model. The deep-aquifer-system Baseline Scenario simulates all withdrawals at 2012 full-allocation rates (table 2), which is the same as the full-allocation Scenario 2 of Lacombe and others (2009), except withdrawals are modified at the WWU Rio Grande well field as follows. The full-allocation Rio Grande well field withdrawals in the deep-aquifer-system Baseline Scenario of this study are 388 Mgal/yr for each well (1,164 Mgal/yr total), the same rate as in Scenario 4 of Lacombe and others (2009). Therefore, the deep-aquifer-system Baseline Scenario for this study has characteristics of Scenarios 2 and 4 from Lacombe and others (2009).
Simulated steady-state water levels in the Atlantic City 800-foot sand for the deep-aquifer-system Baseline Scenario (fig. 7) are similar to, but 10-20 ft lower than, those of Scenario 2 of Lacombe and others (2009). Water levels are lower because of upward vertical flow from the Atlantic City 800-foot sand caused by greater withdrawals from the Rio Grande water-bearing zone. In the Rio Grande water-bearing zone, the effects of larger withdrawals from the aquifer are substantial, with deep-aquifer-system Baseline Scenario water levels near the well field as much as 140 ft lower than those for Scenario 2.
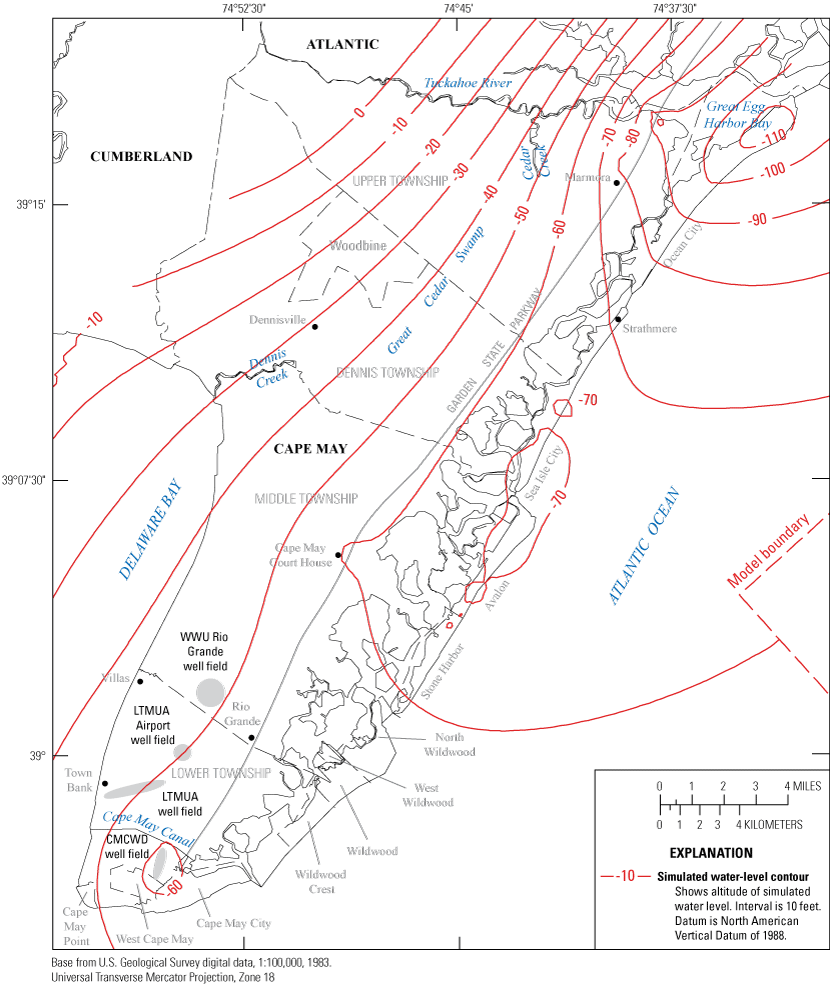
Map showing simulated water levels in the Atlantic City 800-foot sand in 2050 for the deep-aquifer-system Baseline Scenario, Cape May County, New Jersey.
Lower Township Scenario
The Lower Township Scenario uses a transient shallow-aquifer-system simulation to examine the effect of proposed full-allocation withdrawals for LTMUA of 1,079 Mgal/yr. This scenario differs from the shallow-aquifer-system Baseline Scenario with: 1) a 2012 full-allocation withdrawal rate of 868 Mgal/yr (table 2) and 2) domestic wells in Lower Township are removed from service when LTMUA expands its public-supply service area. The simulated LTMUA withdrawal rates are increased in decadal steps, reaching the proposed full-allocation rate of 1,079 Mgal/yr during the 2041–50 stress period. LTMUA PW 1 (090052, table 3) is cut back to zero withdrawals in 2021, and LTMUA PW 2 (090054) and PW 3 (090057, now sealed, replaced by LTMUA PW 7, 090617, at the same location) are held at 2003 withdrawal rates during 2003–50. The remaining withdrawals are made from two existing wells, LTMUA PW 6 (090525) and PW 9 (090662), and two hypothetical wells near the airport. One airport well is assigned zero withdrawals during 2011–19, because simulated withdrawals from LTMUA PW 1 (090052) continue through 2019. Well-by-well simulated shallow-aquifer-system withdrawal rates for users that report withdrawals to the NJDEP are shown in table 3.
Lacombe and others (2009) included withdrawals from domestic wells in the shallow-aquifer-system model throughout Cape May County. The depth and location of domestic wells were determined from NJDEP well-permit applications. Domestic withdrawals from the Holly Beach water-bearing zone are simulated as 100-percent consumptive in sewered areas and 50-percent consumptive in areas with on-site septic systems. Domestic withdrawals from the Cohansey aquifer and estuarine sand are 100-percent consumptive for those aquifers. The simulated rates of withdrawals from domestic wells in each municipality are based on estimates of the total self-supply withdrawal rate for that municipality (calculated by multiplying the self-supplied population for that municipality by estimated per-capita water use) divided by the number of known domestic wells in that municipality (according to available NJDEP well-permit applications). LTMUA expects about 4,500 new connections to the public-supply system (2,015 in Townbank, 1,770 in Villas, and 750 at the Lake Laurie Campground). Assuming a usage of 270 gallons per day per connection, domestic withdrawals would be reduced by 1.23 Mgal/d. Therefore, the domestic self-supply withdrawal rate in the Lower Township Scenario is 1.23 Mgal/d less than the rate in the shallow aquifer baseline simulation with 50 percent of the reduction occurring during the 2011–20 model stress period and 100 percent thereafter.
Wildwood, Avalon, Cape May Court House, Strathmere, and Combined Scenarios
The Wildwood Scenario using the steady-state deep-aquifer-system coupled CMAC-NJCP Sharp models differs from the deep-aquifer-system Baseline Scenario by shifting withdrawals of two of the three deep-system WWU wells from the Rio Grande water-bearing zone to the Atlantic City 800-foot sand. WWU was granted an increase in allocation and in 2005 installed, two wells designed to be open to the Rio Grande water-bearing zone. Unanticipated local-scale variations in the depth of the confining unit separating the Rio Grande water-bearing zone (also known as the upper Kirkwood Formation) from the underlying Atlantic City 800-foot sand (also known as the lower Kirkwood Formation) resulted in the two new wells being open to the Atlantic City 800-foot sand. The total simulated withdrawals in the Wildwood Scenario are the same as the deep-aquifer-system Baseline Scenario except that the Wildwood Scenario withdrawals from the Rio Grande water-bearing zone are lower and withdrawals from the Atlantic City 800-foot sand are higher than the 2012 full-allocation withdrawals.
For the Avalon, Cape May Court House, and Strathmere Scenarios, coupled NJCP Sharp/CMAC model steady-state simulations are used to evaluate proposed full-allocation withdrawals for Avalon Borough Water Utilities and New Jersey American Water (NJAW) systems in Cape May Court House and Strathmere, respectively (table 2). The proposed rates are higher than 2012 full-allocation rates by 40, 64, and 58 percent, respectively. The simulated withdrawals are from the Atlantic City 800-foot sand. Withdrawal rates for all simulated deep-aquifer-system wells are shown in table 4. The Combined Scenario simulates all of the withdrawals described above for the Wildwood, Avalon, Cape May Court House, and Strathmere Scenarios.
All of the deep-aquifer-system scenarios are steady-state simulations and do not represent changes through time, instead representing conditions with steady withdrawals. Therefore, unlike the shallow-aquifer-system model, there is no specific date at which these full-allocation withdrawal rates and subsequent aquifer responses are reached.
Limitations of the Models
As with all numerical models, many simplifying assumptions and approximations are used in both the shallow-aquifer-system model and the deep-aquifer-system coupled models. Lacombe and others (2009) provide calibration statistics that indicate the simulations are good representations of the flow systems, but these calibrations are not unique; different results might be obtained with different values for hydrologic variables (such as hydraulic conductivity) that produced similar calibration statistics. No new calibrations were performed for this study because the only changes made to the models were adjustments of groundwater-withdrawal rates.
The shallow-aquifer-system model explicitly simulates the movement of variable-concentration/variable-density water. Lacombe and others (2009) did not show chloride concentrations of less than 250 mg/L, and that study predated the collection of data during 2010–12 at the WWU well field showing that chloride concentrations of 50 mg/L in the Cohansey aquifer had reached the well field. The simulated 50-mg/L isochlor in 2010 generated by the shallow-aquifer-system Baseline Scenario is about 3,400 ft from the well field rather than at the well field (fig. 6), yet chloride concentrations of 50 mg/L were detected in WWU Well 28 (090068) in 2010. Therefore, the simulated location of the Lower Township Scenario 50-mg/L isochlor near the Rio Grande well field in 2050 is not as far inland as would be expected at the simulated withdrawal rates. However, the magnitude of the difference between the shallow-aquifer-system Baseline Scenario and Lower Township Scenario 50-mg/L isochlor locations is considered to be relatively accurate, thus the effect of increasing LTMUA's allocation can be determined. The locations of the 50- and 250-mg/L isochlors offshore from the Lower Township well field currently (2018) are not known. The calibration of the shallow-aquifer-system model by Lacombe and others (2009) was based on setting the location of the 250-mg/L isochlor west of LTMUA wells in 1900 that resulted in simulated chloride concentrations near the mouth of Fishing Creek during 1980–2010 similar to measured concentrations. It is possible that the location of the 250-mg/L isochlor in 1900 should have been set closer or farther offshore west of the LTMUA wells and, therefore, that the simulated 250-mg/L isochlor in 2050 would be closer or farther, respectively, from the LTMUA wells in 2050.
The shallow-aquifer-system model does not include fluxes into or out of the model through the confining unit underlying the Cohansey aquifer because Lacombe and others (2009) found that the small changes to the heads and water budget were not important and greatly lengthened the time required for each simulation. Therefore, the effects of changes in allocation for deep-aquifer-system purveyors on the shallow-aquifer system were not simulated.
The deep-aquifer-system coupled CMAC-NJCP model uses simulated fluxes across CMAC model boundaries derived from the NJCP Sharp model (Lacombe and others, 2009). However, the NJCP Sharp model does not include the Rio Grande water-bearing zone so withdrawals from that aquifer are assigned to the Atlantic City 800-foot sand. Therefore, the simulation shifting WWU withdrawals from the Rio Grande water-bearing zone to the Atlantic City 800-foot sand may be limited by the fact that the boundary flows calculated by the NJCP Sharp model for the CMAC model are the same for the Baseline and Wildwood Scenarios. This approach is acceptable because the Rio Grande water-bearing zone is a minor aquifer compared to the Atlantic City 800-foot sand, and weighting of boundary flows from the NJCP Sharp model based on transmissivity reasonably allocates the boundary flows from the regional model (Daryll Pope, U.S. Geological Survey, written commun., 2012).
Simulated Effects of Proposed Groundwater Withdrawals
Lower Township Scenario (table 2) simulated water levels are 1 to 4 ft lower than water levels from the shallow-aquifer-system Baseline Scenario in an area about 3 miles across and approximately centered on the LTMUA airport well field in Lower Township, (fig. 8, table 5). The 50-mg/L isochlor is a maximum of 750 ft farther east in the Lower Township Scenario than in the shallow-aquifer-system Baseline Scenario (fig. 9, table 6) and is 700 ft northwest of the northwestern-most LTMUA airport well PW 9 (090662)). North of Fishing Creek and south and east of the Cape May Canal, the simulated 50- and 250-mg/L isochlor locations in 2050 are unchanged compared to the shallow-aquifer-system Baseline Scenario.
Table 5.
Simulated water levels in the Cohansey aquifer in 2050 near the Lower Township Municipal Utilities Authority and Wildwood Water Utility well fields, Cape May County, New Jersey.[LTMUA, Lower Township Municipal Utilities Authority; WWU, Wildwood Water Utility]
Table 6.
Simulated difference in location of the 50-milligram per liter isochlor near the Lower Township Municipal Utilities Authority and Wildwood Water Utility well fields, Cape May County, New Jersey, 2010–50.[LTMUA, Lower Township Municipal Utilities Authority; WWU, Wildwood Water Utility; mg/L, milligrams per liter]
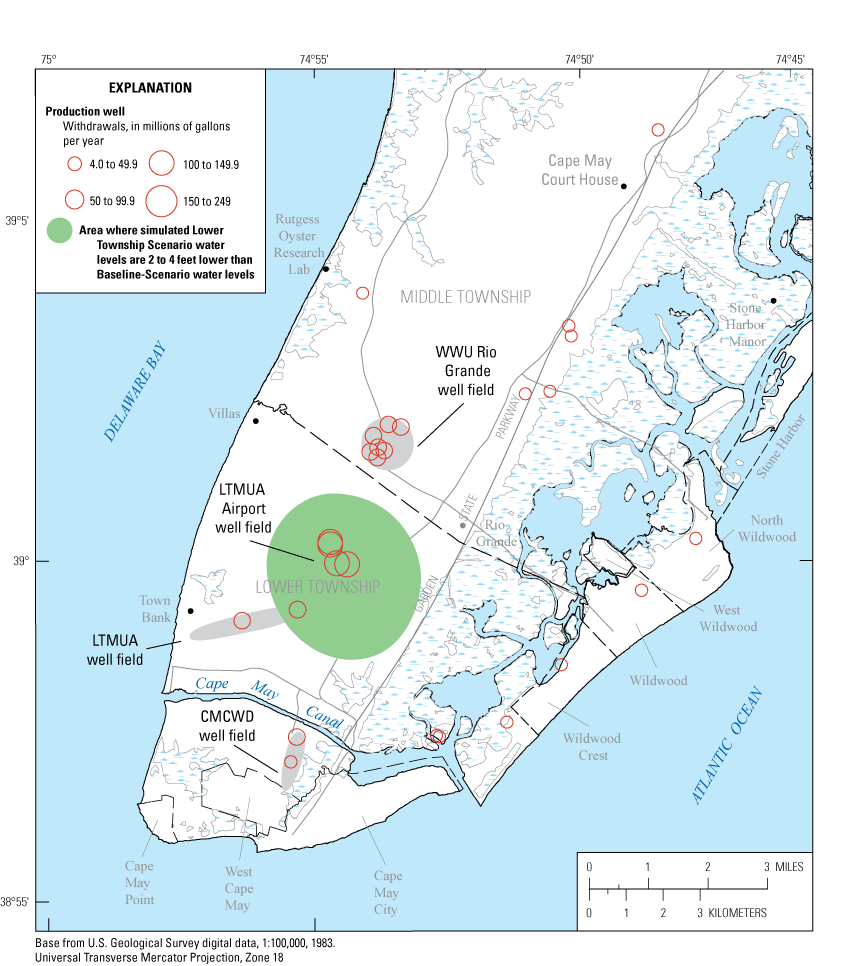
Map showing difference between Lower Township Scenario and shallow-aquifer-system Baseline Scenario simulated water levels in the Cohansey aquifer in 2050, southern Cape May County, New Jersey.
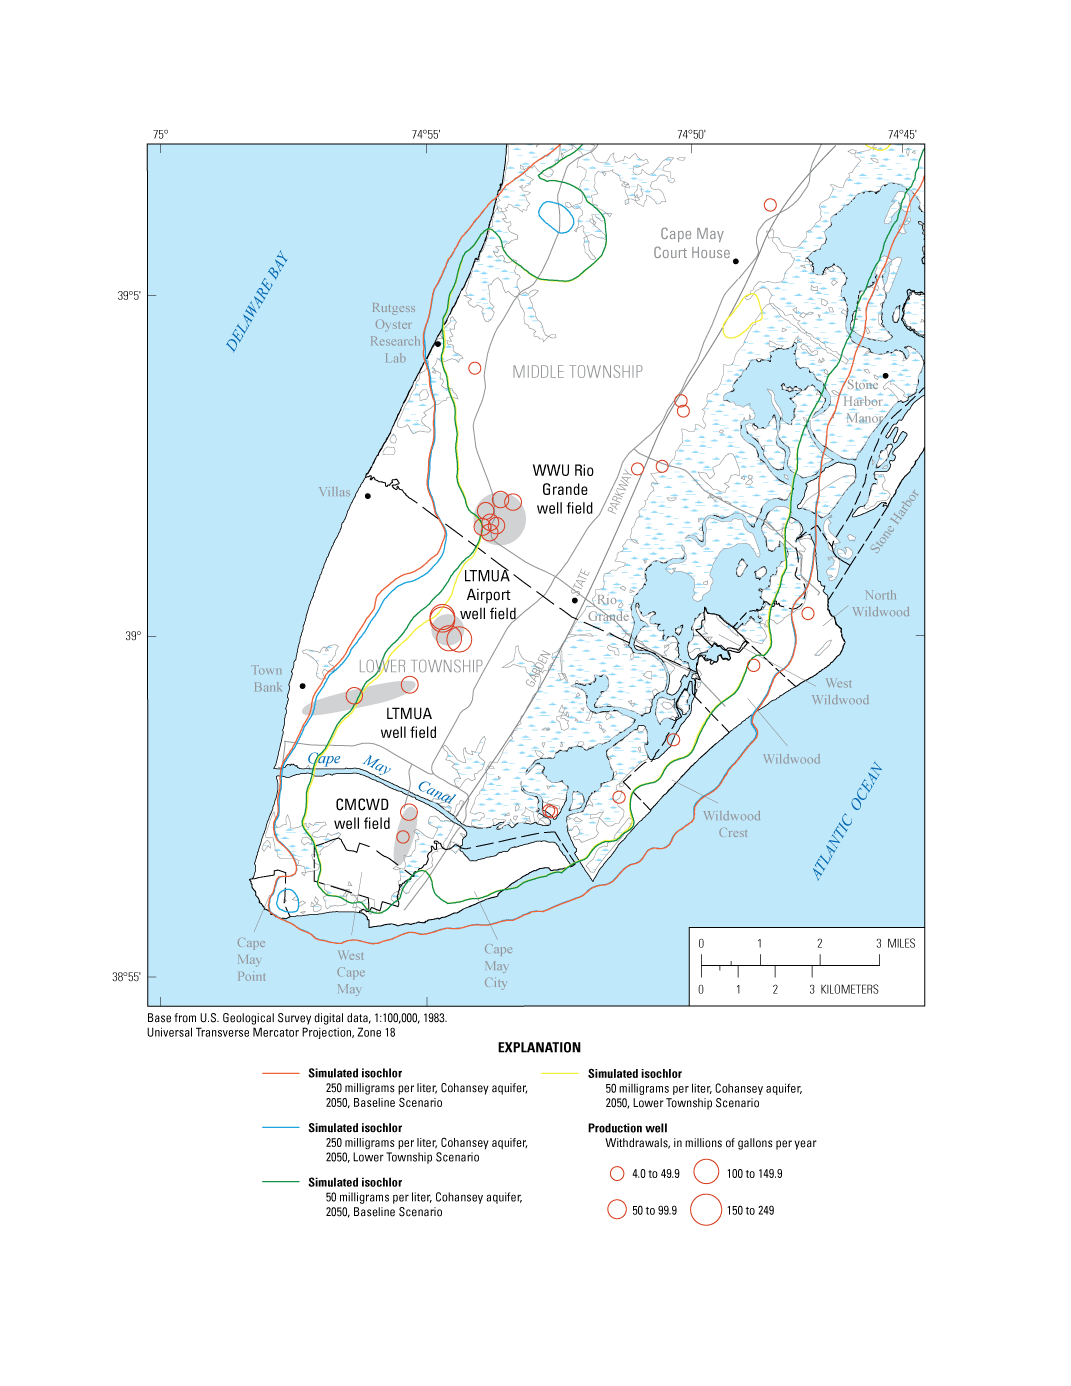
Map showing Lower Township Scenario and shallow-aquifer-system Baseline Scenario simulated isochlors in the Cohansey Aquifer in 2050, southern Cape May County, New Jersey. (WWU, Wildwood Water Utility; LTMUA, Lower Township Municipal Utilities Authority; CMCWD, Cape May City Water Department)
The location of the 50- and 250-mg/L isochlors in the Cohansey aquifer offshore from LTMUA PW 1 (090052) is not known, so the vulnerability of those wells cannot be estimated with confidence. The simulated 50-mg/L isochlor in 2010 is about 3,500 ft west of the WWU Rio Grande well field, but chloride concentrations in water from wells 28, 29, and 34 (090068, 090079, and 090065, respectively) were greater than 50 mg/L at least once during 2010–17 (Ed Cerrone, Wildwood Water Utility, written commun., 2017). Therefore, the actual location of the 50-mg/L isochlor northwest of the LTMUA airport wells may be farther inland than the simulated 50-mg/L isochlor, and those wells could be more vulnerable than shown by the Lower Township Scenario. However, water samples from observation well Cape May F-41 (090213) open to the Cohansey aquifer on the Delaware Bay coastline south of Fishing Creek, had low chloride concentrations (less than 15 mg/L) during 1966–2012. Therefore, it is possible that the more rapid than predicted saltwater intrusion towards the Rio Grande well field is caused by a local aquifer heterogeneity that is not a factor farther to the south and the simulated 50-mg/L isochlor location is accurate west of LTMUA wells.
Wildwood Scenario
The WWU 2012 allocation allows withdrawals from the Holly Beach water-bearing zone, the estuarine sand, Cohansey aquifer, and the Rio Grande water-bearing zone (upper Kirkwood Formation). WWU Rio Grande well field wells 46 and 47 (090523 and 090522, respectively), installed in 2003, were intended to be completed in the lower part of the Rio Grande water-bearing zone but were inadvertently screened in the Atlantic City 800-foot sand (lower Kirkwood Formation). Water-level data from a nearby Atlantic City 800-foot sand observation well to the northwest along the Delaware Bay shoreline (Oyster 800 obs, 090306) and two wells to the southeast along the Atlantic Ocean shoreline (Coast Guard 800 obs, 090302 and N. Wildwood 800 obs--090337) show a distinct step-function drop in water levels in summer 2008 after wells Rio Grande 46 and Rio Grande 47 were brought into production (fig. 10). In contrast, water-level-altitude data from a nearby Rio Grande water-bearing zone well (Airport Rio Grande obs, 090304) do not show a similar drop in water levels during the same period (fig. 10), further indicating the withdrawal wells are not open to the Rio Grande water-bearing zone.
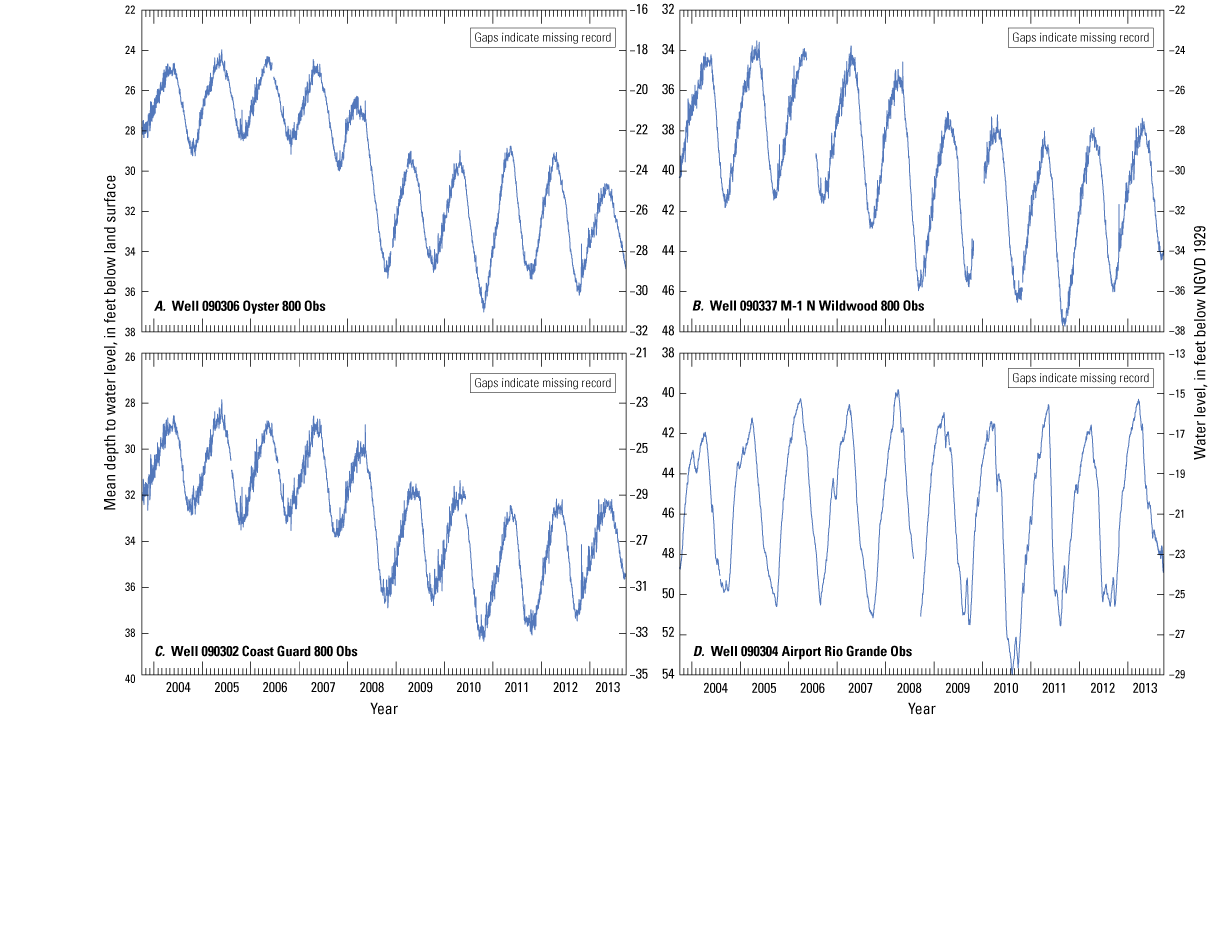
Graphs showing water levels in three observation wells open to the Atlantic City 800-foot sand (A–C) and an observation well open to the Rio Grande water bearing zone (D), Cape May County, New Jersey, 2004–13.
The only difference between the Wildwood Scenario and the deep-aquifer-system Baseline Scenario is that, in the Wildwood Scenario, wells Rio Grande 46 and Rio Grande 47 withdraw from the Atlantic City 800-foot sand rather than the Rio Grande water-bearing zone. Simulated Wildwood Scenario water levels in the Atlantic City 800-foot sand are 30–54 ft lower than the deep-aquifer-system Baseline Scenario water levels within about 4,500 ft of the WWU Rio Grande well field and are a maximum of 102 ft below sea level at the well field (fig. 11, table 7). Simulated water-level-differences between the two scenarios in the Atlantic City 800-foot sand are less than 5 ft lower in Woodbine, Upper Township and Ocean City, 5–10 ft lower in southern Dennis Township, northern Middle Township, Avalon Borough, and Sea Isle City, and 20–54 ft lower in southern Middle Township, Lower Township, Cape May City, and the Wildwoods (fig. 11). The maximum difference between the Baseline and Wildwood scenario water levels in the Rio Grande water-bearing zone is +111 ft at the WWU well field and +10–15 ft as far northeast as Cape May Court House and Stone Harbor. The maximum change in the Rio Grande water-bearing zone (+111 ft) is greater than the maximum change in the Atlantic City 800-foot sand (–54 ft) because of the higher transmissivity of the latter aquifer.
Table 7.
Simulated water levels in the Atlantic City 800-foot sand (lower Kirkwood Formation) and Rio Grande water-bearing zone (upper Kirkwood Formation) for the deep-aquifer-system Baseline, Wildwood, Avalon, Court House, Strathmere, and Combined Scenarios, Cape May County, New Jersey, 2050.[WWU, Wildwood Water Utility; CMCH, Cape May Court House; CMCWD, Cape May City Water Department]
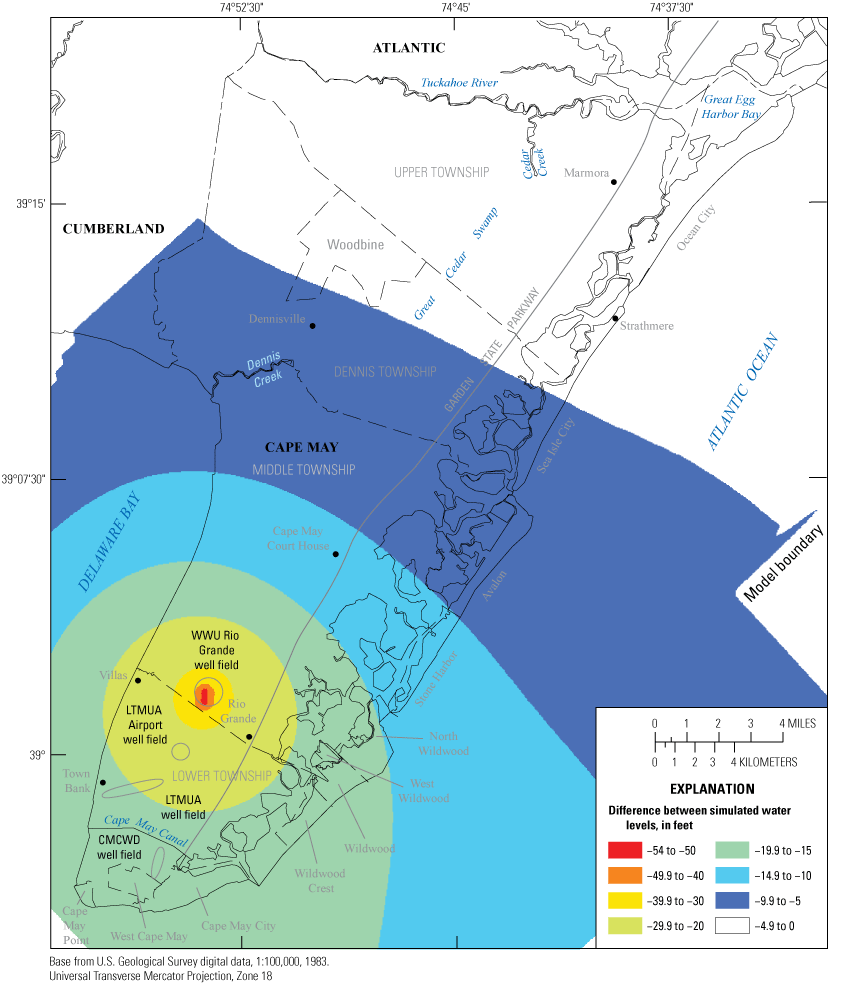
Map showing difference between the Wildwood Scenario and the deep-aquifer-system Baseline Scenario simulated water levels in the Atlantic City 800-foot sand in 2050, Cape May County, New Jersey.
Avalon Scenario
The Avalon Scenario simulated an increase in Avalon Borough proposed full-allocation withdrawals from the Atlantic City 800-foot sand of 495 Mgal/yr, a 40-percent increase from the 2012 allocation of 354 Mgal/yr (table 2). The increased withdrawals are distributed among four Atlantic City 800-foot sand production wells at the same ratio as recent withdrawals.
Avalon Scenario simulated water levels (table 7) in the Atlantic City 800-foot sand are 5–8 ft lower than those from the deep-aquifer-system Baseline Scenario in an area approximately corresponding to Avalon Borough limits (fig. 12). Water levels are about 4 ft lower than in the deep-aquifer-system Baseline Scenario at Cape May Court House and about 2 ft lower at the WWU Rio Grande well field and Ocean City.

Map showing difference between Avalon Scenario and deep-aquifer-system Baseline Scenario simulated water levels in the Atlantic City 800-foot sand in 2050, Cape May County, New Jersey.
Court House Scenario
The Court House Scenario simulated proposed full-allocation withdrawals from the Atlantic City 800-foot sand for New Jersey American Water–Cape May Court House are 385 Mgal/yr, a 64-percent increase from the 2012 allocation of 235 Mgal/yr (table 2). The increased withdrawals were distributed among two Atlantic City 800-foot sand production wells at the same ratio as recent withdrawals.
The Court House Scenario simulated Atlantic City 800-foot sand water levels (table 7) are 10 to 12 ft lower than in the deep-aquifer-system Baseline Scenario in the immediate vicinity of the Court House wells. Water levels are 5–10 ft lower in about a 6-mile-diameter circle covering much of Middle Township and centered slightly to the east of the well field (fig. 13). Water levels are about 5 ft lower than those from the deep-aquifer-system Baseline Scenario in Avalon and about 3 ft lower in Ocean City and Cape May City.
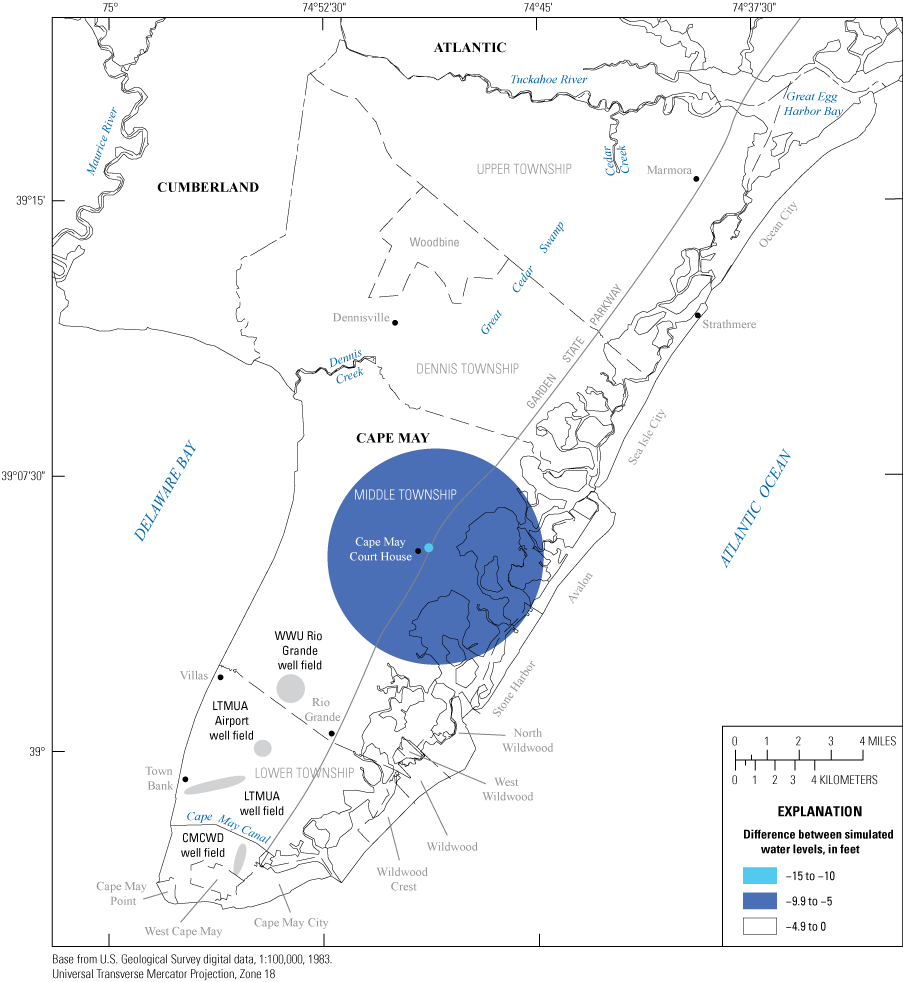
Map showing difference between Court House Scenario and deep-aquifer-system Baseline Scenario simulated water levels in the Atlantic City 800-foot sand in 2050, Cape May County, New Jersey.
Strathmere Scenario
The Strathmere Scenario simulated proposed full-allocation withdrawals from the Atlantic City 800-foot sand of 30 Mgal/yr, a 58-percent increase from the 2012 allocation of 19 Mgal/yr (table 2). The increased withdrawals were distributed among two production wells at the same ratio as recent withdrawals.
Strathmere Scenario simulated water levels (table 7) in the Atlantic City 800-foot sand are less than 2 ft lower than deep-aquifer-system Baseline Scenario water levels at all locations. Water levels are 1 ft lower in Cape May Court House and Ocean City and are less than 1 ft lower south and west of Cape May Court House.
Combined Scenario
The Combined Scenario simulates a combination of a shift of WWU full-allocation withdrawals of 776 Mgal/yr from in two wells from the Rio Grande water-bearing zone to the Atlantic City 800-foot sand and proposed full-allocation withdrawals from the Atlantic City 800-foot sand by Avalon, Cape May Court House, and Strathmere of 495, 385, and 19 Mgal/yr, respectively (table 2). Because the increase in withdrawals by WWU is more than double the other three combined, the WWU withdrawals have the greatest effect on the results of the Combined Scenario, although effects of the Avalon and Court House withdrawals are also evident (fig. 14).
Combined Scenario simulated water levels (table 7) for the Atlantic City 800-foot sand are 40–61 ft lower than those for the deep-aquifer-system Baseline Scenario in the immediate vicinity of the WWU Rio Grande well field (fig. 14), at least 20 ft lower for the part of the county south of Cape May Court House, 15–20 ft lower in Avalon and northern Middle Township, and 5–15 ft lower in the part of the county north of Middle Township (fig. 14).

Map showing difference between Combined Scenario and deep-aquifer-system Baseline Scenario simulated water levels in the Atlantic City 800-foot sand in 2050, Cape May County, New Jersey.
Summary and Conclusions
Several water purveyors in Cape May County requested changes to their allocation permits from the New Jersey Department of Environmental Protection (NJDEP). The U.S. Geological Survey, in cooperation with the NJDEP, simulated six water-supply scenarios to determine the effects of proposed full-allocation withdrawals on water levels and saltwater intrusion in the Cohansey aquifer and water levels in the Rio Grande water-bearing zone (upper Kirkwood Formation) and the Atlantic City 800-foot sand (lower Kirkwood Formation).
The Lower Township Scenario simulates effects on water levels and saltwater intrusion in the Cohansey aquifer with proposed full-allocation withdrawals of 1,079 Mgal/yr from the Cohansey aquifer for Lower Township Municipal Utilities Authority (LTMUA), 211 Mgal/yr (24 percent) greater than the 2012 full-allocation withdrawals. The effects of proposed full-allocation withdrawals on water levels and saltwater intrusion are simulated with a shallow aquifer system variable-density groundwater-flow model developed by Lacombe and others (2009). The Lower Township Scenario simulated water levels are 2–4 feet (ft) lower than shallow-aquifer-system Baseline Scenario simulated water levels in an area about 3 miles across, centered approximately on LTMUA withdrawal wells near the airport. The simulated 250-milligram per liter (mg/L) isochlor is a maximum of 750 ft farther east in the Lower Township Scenario than in the shallow-aquifer-system Baseline Scenario. Groundwater with chloride concentrations of 50 mg/L is simulated to be 700 ft northwest of the northwestern-most LTMUA well at the airport in 2050. North of Fishing Creek and south and east of the Cape May Canal, the simulated 250-mg/L isochlor is unchanged in the Lower Township Scenario compared to the shallow-aquifer-system Baseline Scenario. The current (2018) location of the 50-mg/L isochlor in the Cohansey aquifer offshore from LTMUA PW 1 (090052) and PW 2 (090054) is not known, so the accuracy of the simulated 50-mg/L isochlor location near those wells cannot be verified. Although chloride concentrations greater than 50 mg/L have been measured in water from several wells in the Wildwood Water Utility (WWU) Rio Grande well field, the simulated 50-mg/L isochlor had not reached the well field as of 2010. Therefore, the actual location of saline water northwest of the LTMUA airport wells might be closer than the simulated location.
Two production wells installed at the WWU Rio Grande well field that were intended to be open to the Rio Grande water-bearing zone (upper Kirkwood Formation) were later determined to be open to the Atlantic City 800-foot sand (lower Kirkwood Formation). The Wildwood Scenario simulation of withdrawals of 776 Mgal/yr from the two wells shows simulated water levels in the Atlantic City 800-foot sand to be 15–54 ft lower than the deep-aquifer-system Baseline Scenario in southern Middle Township, Lower Township, the Wildwoods, and Cape May City, 5–10 ft lower in southern Dennis Township, northern Middle Township, Avalon, and Sea Isle City, and less than 5 ft in Woodbine, Upper Township, and Ocean City.
The Avalon Scenario simulated proposed full-allocation withdrawals for Avalon Borough of 495 Mgal/yr, which is 141 Mgal/yr (40 percent) higher than 2012 full-allocation withdrawals from the Atlantic City 800-foot sand, the sole potable aquifer underlying Avalon. Water levels for the Avalon Scenario are 5 to 7 ft lower than those for the deep-aquifer-system Baseline Scenario within the Avalon Borough boundary and less than 5 ft lower beyond the borough.
The Court House Scenario proposed simulated full-allocation withdrawals for New Jersey American Water–Cape May Court House of 385 Mgal/yr, which is 150 Mgal/yr (64 percent) higher than 2012 full-allocation withdrawals. The Court House Scenario simulated water levels in the Atlantic City 800-foot sand are 10–12 ft lower than those for the deep-aquifer-system Baseline Scenario at the wells and 5–12 ft lower over a circular area about 6 miles in diameter approximately centered on the Court House wells. Water-levels are about 3–5 ft lower than the deep-aquifer-system Baseline Scenario in Avalon, Ocean City, and Cape May City.
The Strathmere Scenario simulated proposed full-allocation withdrawals for New Jersey American Water–Strathmere of 30 Mgal/yr, which is 11 Mgal/yr (58 percent) higher than 2012 full-allocation withdrawals. The Strathmere Scenario simulated water levels are less than 2 ft lower than those for the deep-aquifer-system Baseline Scenario in Strathmere, about 1 ft lower in Cape May Court House and Ocean City, and essentially unchanged south and west of Cape May Court House.
The Combined Scenario simulates withdrawals from the Atlantic City 800-foot sand by Wildwood, Avalon, Cape May Court House, and Strathmere of 776, 495, 385, and 30 Mgal/yr, respectively. Compared to the Baseline Scenario, the simulated water levels in the vicinity of the WWU Rio Grande well field are 40–60 ft lower, more than 20 ft lower south of Cape May Court House, and 5–15 ft lower north of Middle Township.
References Cited
Carleton, G.B., 2021, SEAWAT, MODFLOW-2000, and SHARP models used to simulate potential water-allocation changes, Cape May County, New Jersey: U.S. Geological Survey data release, https://doi.org/10.5066/P9KC1PGV.
dePaul, V., and Rosman, R., 2015, Groundwater conditions in selected confined aquifers of the New Jersey Coastal Plain, 2008: U.S. Geological Survey Scientific Investigations Report 2013-5232, 109 p., 9 pl., accessed December 2020 at https://doi.org/10.3133/sir20135232.
Lacombe, P.J., and Carleton, G.B., 1992, Saltwater intrusion into fresh groundwater supplies, southern Cape May County, New Jersey, 1890–1991, in Borden, R.C., and Lyke, W.L., eds., The future availability of groundwater resources: American Water Resources Association Symposium Proceedings, Raleigh, N.C., April 12–15, 1992, p. 287–298.
Lacombe, P.J., and Carleton, G.B., 2002, Hydrogeologic framework, availability of water supplies and saltwater intrusion, Cape May County, New Jersey: U.S. Geological Survey Water-Resources Investigations Report 01–4266, 151 p., accessed December 2020 at https://pubs.usgs.gov/wri/wri014246/.
Lacombe, P.J., Carleton, G.B., Pope, D.A., and Rice, D.E., 2009, Future water-supply scenarios, Cape May County, New Jersey, 2003–2050: U.S. Geological Survey Scientific Investigations Report 2009–5187, 158 p., accessed December 2020 at https://pubs.usgs.gov/sir/2009/5187/.
New Jersey Department of Environmental Protection, 2005, Federal and NJ state primary and secondary drinking water standards as of February 2005: State of New Jersey web page, accessed September 18, 2014, at https://www.nj.gov/dep/watersupply/pdf/dw_standards_2_2005.pdf.
Pope, D.A., 2006, Simulation of proposed increases in ground-water withdrawals from the Atlantic City 800-foot sand, New Jersey Coastal Plain: U.S. Geological Survey Scientific Investigations Report 2006–5114, 17 p., accessed December 2020 at https://pubs.usgs.gov/sir/2006/5114/.
Pope, D.A., Carleton, G.B., Buxton, D.E., Walker, R.L., Shourds, J.L., and Reilly, P.A., 2012, Simulated effects of alternative withdrawal strategies on groundwater flow in the unconfined Kirkwood-Cohansey aquifer system, the Rio Grande water-bearing zone, and the Atlantic City 800-foot sand in the Great Egg Harbor and Mullica River Basins, New Jersey: U.S. Geological Survey Scientific Investigations Report 2012-5187, 139 p., accessed December 2020 at https://pubs.usgs.gov/sir/2012/5187/.
Pope, D.A., and Gordon, A.D., 1999, Simulation of groundwater flow and movement of the freshwater-saltwater interface in the New Jersey Coastal Plain: U.S. Geological Survey Water-Resources Investigations Report 98-4126, 159 p. accessed December 2020 at http://pubs.er.usgs.gov/publication/wri984216.
U.S. Geological Survey, 2015, Groundwater levels for New Jersey: U.S. Geological Survey National Water Information System database, accessed June 17, 2015, at https://nwis.waterdata.usgs.gov/nj/nwis/gwlevels.
Voronin, L.M., Spitz, F.J., and McAuley, S.D., 1996, Evaluation of saltwater intrusion and travel time in the Atlantic City 800-foot sand, Cape May County, New Jersey, 1992, by use of a coupled model approach and flow path analysis: U.S. Geological Survey Water-Resources Investigations Report 95–4280, 38 p., accessed December 2020 at http://pubs.er.usgs.gov/publication/wri954280.
Conversion Factors
U.S. customary units to International System of Units
Datum
Vertical coordinate information is referenced to the North American Vertical Datum of 1988 (NAVD 88), except for figure 10, which is referenced to the National Geodetic Vertical Datum of 1929 (NGVD29).
Horizontal coordinate information is referenced to the North American Datum of 1983 (NAD 83).
Altitude, as used in this report, refers to distance above the vertical datum.
Sea level in this report is defined as an altitude of 0.0 NAVD 88.
Supplemental Information
Concentrations of chemical constituents in water are given in either milligrams per liter (mg/L) or micrograms per liter (µg/L).
Abbreviations
CMAC
Cape May Atlantic County model
CMCWD
Cape May City Water Department
ft
feet
LTMUA
Lower Township Municipal Utilities Authority
Mgal/d
million gallons per day
Mgal/yr
million gallons per year
mg/L
milligrams per liter
NAD 83
North American Datum of 1983
NAVD 88
North American Vertical Datum of 1988
NGVD 29
National Geodetic Vertical Datum of 1929
NJAW
New Jersey American Water Corporation
NJCP
New Jersey Coastal Plain
NJDEP
New Jersey of Department of Environmental Protection
NJUID
New Jersey Unique Identification number
PW
pumping well
USGS
U.S. Geological Survey
WWU
Wildwood Water Utility
For additional information, contact:
Director, New Jersey Water Science Center
U.S. Geological Survey
3450 Princeton Pike, Suite 110
Lawrenceville, NJ 08648
Or visit our website at: https://www.usgs.gov/centers/nj-water
Publishing support provided by the West Trenton Publishing Service Center
Suggested Citation
Carleton, G.B., 2021, Simulation of potential water allocation changes, Cape May County, New Jersey: U.S. Geological Survey Scientific Investigations Report 2020–5052, 39 p., https://doi.org/10.3133/sir20205052.
ISSN: 2328-0328 (online)
Study Area
| Publication type | Report |
|---|---|
| Publication Subtype | USGS Numbered Series |
| Title | Simulation of potential water allocation changes, Cape May County, New Jersey |
| Series title | Scientific Investigations Report |
| Series number | 2020-5052 |
| DOI | 10.3133/sir20205052 |
| Year Published | 2021 |
| Language | English |
| Publisher | U.S. Geological Survey |
| Publisher location | Reston, VA |
| Contributing office(s) | New Jersey Water Science Center |
| Description | Report: vi, 39 p.; Data Release |
| Country | United States |
| State | New Jersey |
| County | Cape May County |
| Online Only (Y/N) | Y |
| Additional Online Files (Y/N) | N |
| Google Analytic Metrics | Metrics page |