

Documentation of Methods and Inventory of Irrigation Information Collected for the 2015 U.S. Geological Survey Estimated Use of Water in the United States
Links
- Document: Report (12.1 MB pdf) , HTML , XML
- Data Release: USGS data release - 2015 calendar-year county-level estimates of actual evapotranspiration for the conterminous United States and Hawaii
- Download citation as: RIS | Dublin Core
Abstract
The U.S. Geological Survey (USGS) National Water-Use Science Project strives to report water-use estimates using the best available information for the period of the estimates. The information available on water used for irrigation activities varies from State to State and in some areas from county to county within a State, which results in many information sources and methods being used to estimate water withdrawals and consumption for the Nation. The variety of estimation methods makes it difficult to compare information across States and makes it difficult to understand how different methods or data sources bias irrigation water-use estimates and trends over time. The sources of information and methods used by USGS Water Science Centers to estimate irrigation water use (the number of irrigated acres by irrigation system type, withdrawal values by water source type, and consumed-water values) for 2015 are compiled and described herein to assist with interpreting the water-use estimates. State-level summaries of information sources and methods are compiled in appendix 1, and a dataset of calendar-year, county-level estimates of actual evapotranspiration for the conterminous United States and Hawaii is provided in an associated USGS data release.
Introduction
The U.S. Geological Survey (USGS) has estimated water use every 5 years since 1950 for various water-use categories and published these estimates in a series of national Circular reports, referred to hereafter as the compilation. The compilation of water-use estimates is facilitated by the USGS National Water-Use Science Project (NWUSP) under the Water Availability and Use Science Program (WAUSP) as part of the National Water Census (NWC), which was implemented under the SECURE Water Act (Public Law 111–11, 123 Stat. 991). The NWC’s mission is to provide data and tools to water managers for assessing water availability at regional and national scales. The data are collected and compiled by the USGS Water Science Centers (WSCs) and provided to the NWUSP for the reporting of average daily withdrawals for the calendar year, by water source type (groundwater and surface water) and quality (fresh and saline), for the 50 States, the District of Columbia, Puerto Rico, and the U.S. Virgin Islands.
The water-use categories published by the USGS have varied across compilations. Some water-use categories are required for all WSCs to compile, and other categories are optional for WSCs to collect. For the 2015 calendar year, the water-use categories required for the compilation were aquaculture, domestic self-supplied, industrial, irrigation, livestock, mining, public supply, and thermoelectric-power generation, while commercial water use was optional. Historically, the three largest use categories were thermoelectric-power generation, irrigation, and public supply. This report focuses on information sources and methods used to estimate water use for irrigation; primarily, irrigation for crops. The WSCs were given the option to either report total water use for irrigation or separate the reported information into crop and golf course use. For 2015, there were 15 States that did not report crop and golf course water use separately, and 5 of those States indicated that they only estimated irrigation data for crops; therefore, 10 States consolidated golf course and crop water use into 1 estimate. The USGS defines irrigation water use as the “water that is applied by an irrigation system to assist crop and pasture [including nurseries and turf farms] or to maintain vegetation on recreational lands such as, parks and golf courses” (U.S. Geological Survey, 2020). These estimates may also account for water applied for pre-growing-season water application, frost protection, chemical application, weed control, field preparation, crop cooling, harvesting, dust suppression, and leaching salts from the root zone. All irrigation-water withdrawals are considered freshwater; groundwater and surface-water withdrawals are estimated separately. Irrigated land, in acres, is estimated for three types of irrigation methods: sprinkler, surface (flood), and micro-irrigation systems.
The WSCs strive to use the best available information for their region when estimating irrigation water use, although most estimates are based on sparse, site-specific data. Therefore, WSCs rely on State and Federal reporting programs, local irrigation districts, industry estimates, satellite data, Soil-Water Balance and surface energy balance model results, and evapotranspiration (ET) estimates for estimating irrigation water use. The information sources vary among States and sometimes between geographic areas within a State. The variation in irrigation water-use estimates can be attributed to crop types, climate, methods of irrigation, irrigation-system and conveyance efficiencies, soil conditions, and the availability of water. The variety of estimation methods makes it difficult to confidently compare information among States and makes it difficult to understand how different methods or data sources bias irrigation water-use estimates and trends over time.
The appropriate documentation of methods and information sources used to develop irrigation water-use estimates is vital for the effective comparison and use of data. Dickens and others (2011) published a report documenting the methods used in the 2000 and 2005 USGS 5‑year compilations. The report highlights the need for improved documentation, accuracy, and consistency in estimating the number of irrigated acres and the volume of irrigation withdrawals; the authors suggest using consistent methods for data reporting and recommend data sources for use in future USGS water-use reporting.
For 2015, WSCs were required to document the information sources and methods used for each element required in the compilation. A template of questions was used to gather specific information for each water-use category and ensure consistent documentation. For irrigation information, questions addressed methods used to assess the number of irrigated acres and irrigation system types, how groundwater and surface-water withdrawals were determined, and if system and conveyance efficiencies were considered when estimating withdrawals for water use on crops and golf courses. The unpublished 2015 documentation provided State-level descriptions of information sources and methods. These documents are used to understand differences in compiled water-use estimates across the Nation.
Purpose and Scope
The purpose of this report is to compile the information sources and methods used by the WSCs for estimating the irrigated acreage, irrigation withdrawals, consumptive use, system and conveyance efficiency, and sources of water, all published by Dieter and others (2018). The compiled information sources and methods are presented in tabular and map formats to highlight the spatial patterning across the Nation and are described to assist with the interpretation of water-use estimates for 2015. Appendix 1 presents a summary of information that includes the sources and methods used to estimate the number of irrigated acres, irrigation withdrawals, system and conveyance efficiencies, and sources of water for the 2015 compilation, for each of the 50 States, the District of Columbia, Puerto Rico, and the U.S. Virgin Islands. Unpublished actual evapotranspiration (ETa) estimates from the operational Simplified Surface Energy Balance (SSEBop) model are provided in the USGS data release associated with this report (Painter and others, 2021). These ETa estimates were provided to WSCs for consideration in their consumptive-use estimates for irrigation.
Sources of Information and Methods Used to Estimate Irrigation Water Use
County-scale estimates of irrigation water withdrawals (fig. 1) and the percentage of consumptive use (fig. 2) for 2015 used several information sources and methodologies, depending on the data availability within the State for which they were estimated. The information sources and estimation methods are described here for the State scale. The compilation required information about irrigated acres, knowledge of irrigation system types (sprinkler, surface, and micro-irrigation), and information on withdrawals by water source type (groundwater and surface water). Additionally, consumptive use—as a fraction of withdrawals—was estimated for the compilation. Federal and State agencies usually provide the number of irrigated acres. Information used to estimate irrigation withdrawals varies from one State to the next and can be divided into three types: direct accounting, indirect accounting, and a combination of the two preceding groups. Direct accounting is defined as estimates that use reported or measured data, whereas indirect accounting is based on estimates crafted from modeled results or estimated (or calculated) coefficients. Some withdrawals are first calculated using consumption numbers and then additional water needs are added based on loss estimates from conveyance and irrigation system efficiencies.
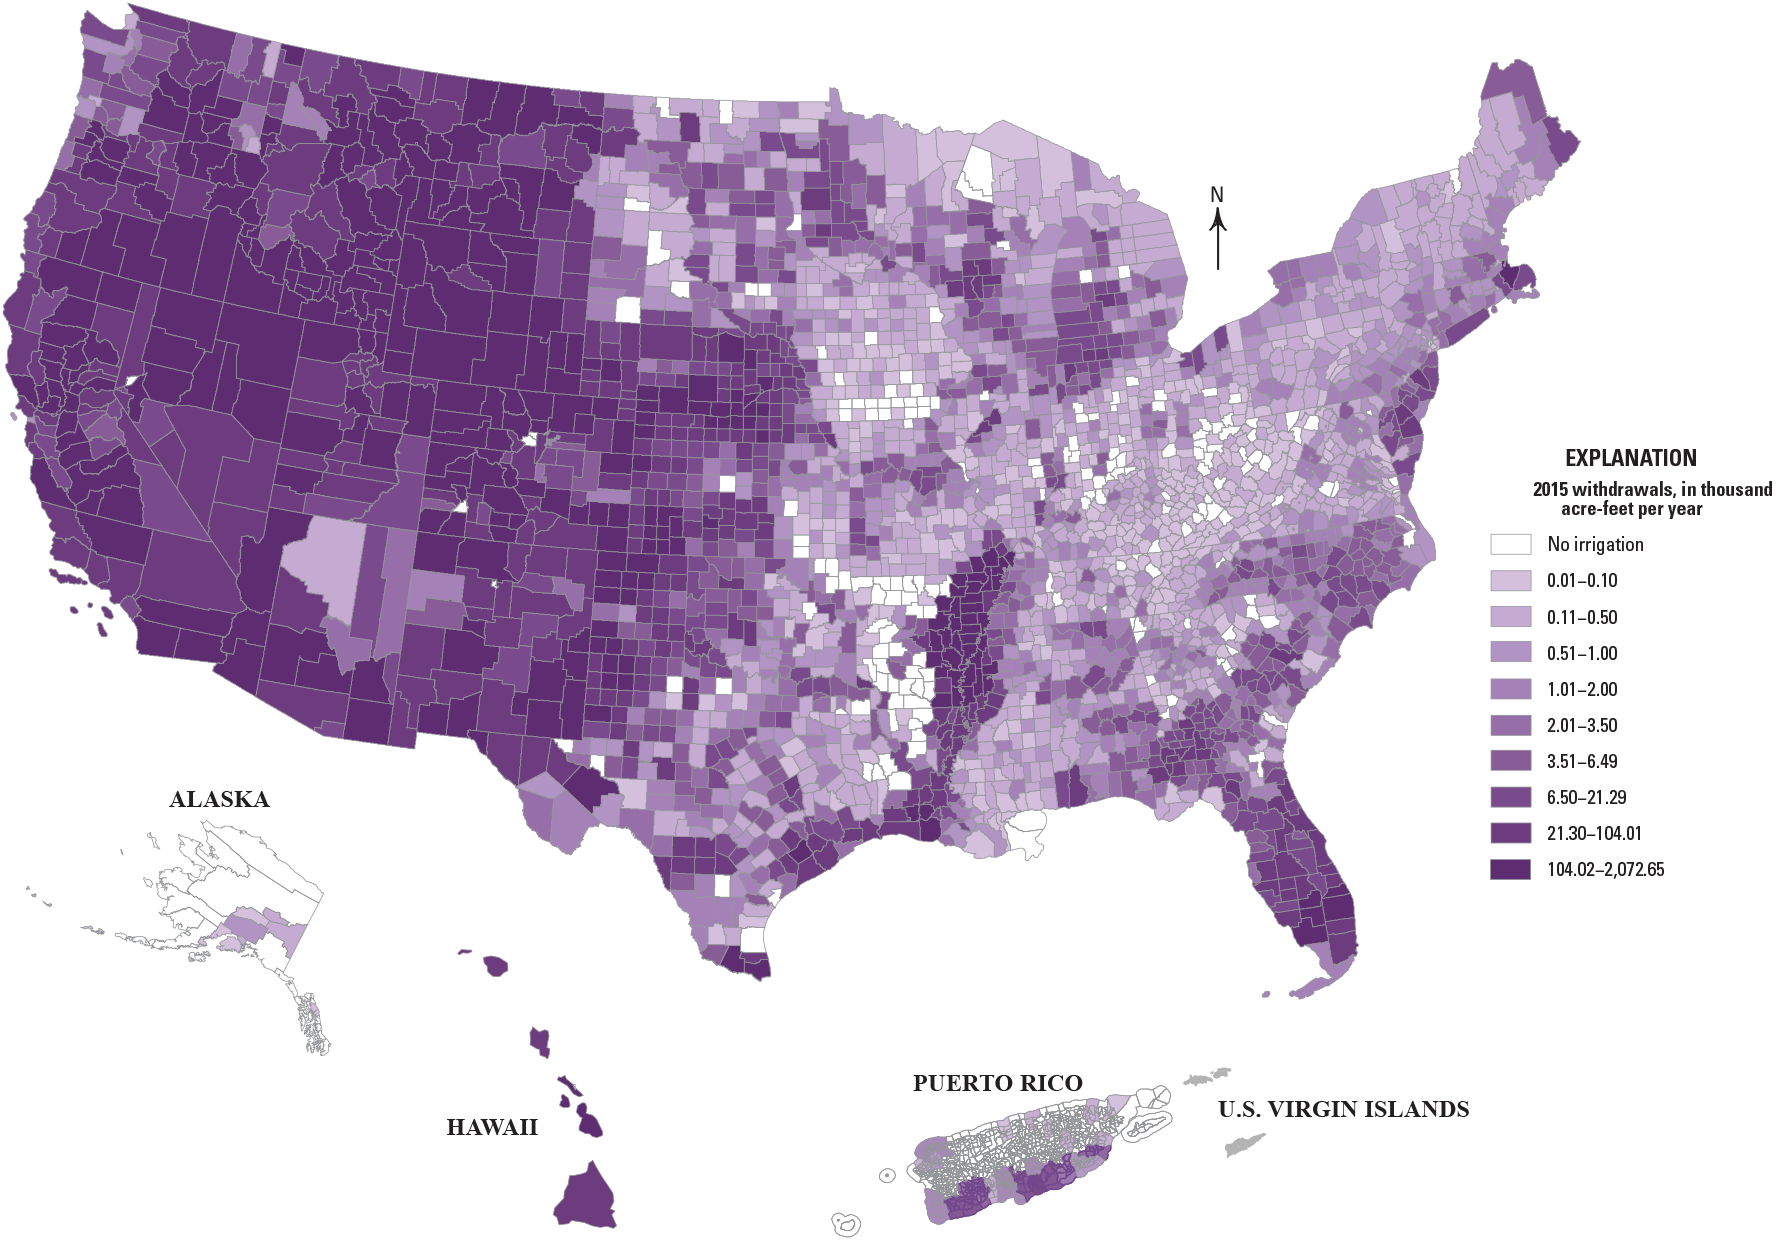
Map of irrigation estimates in the United States, Puerto Rico, and the U.S. Virgin Islands for 2015, showing average withdrawals in thousand acre-feet per year (yr), by county (in the United States and the U.S. Virgin Islands) and municipality (in Puerto Rico).

Map of irrigation estimates in the United States, Puerto Rico, and the U.S. Virgin Islands for 2015, showing percentages of consumptive use, by county (in the United States and the U.S. Virgin Islands) and municipality (in Puerto Rico).
Sources and Methods for Estimating Irrigated Acreage
The location and acreage of irrigated lands are critical for accurately estimating withdrawals. Information provided by the U.S. Department of Agriculture (USDA), State agencies, universities, remote sensing methods, and USGS field-verification efforts were used to estimate the number of irrigated acres for 2015. The most common information sources used to estimate the number of irrigated acres are those provided by the USDA (table 1, fig. 3). The number of irrigated acres for 37 States was estimated using at least 1 USDA product. Twenty-eight States reported or compiled irrigated-acres information by State agencies or universities. Five States used information collected by the USGS through remote sensing or field-verification methods. Most States used more than one information source to estimate the number of irrigated acres. Fourteen States used data from State agencies and universities and also used information from the USDA. Additionally, the District of Columbia only estimated irrigation withdrawals for golf courses, and the U.S. Virgin Islands reported zero irrigation for 2015. Descriptions of these information sources are provided in subsequent sections.
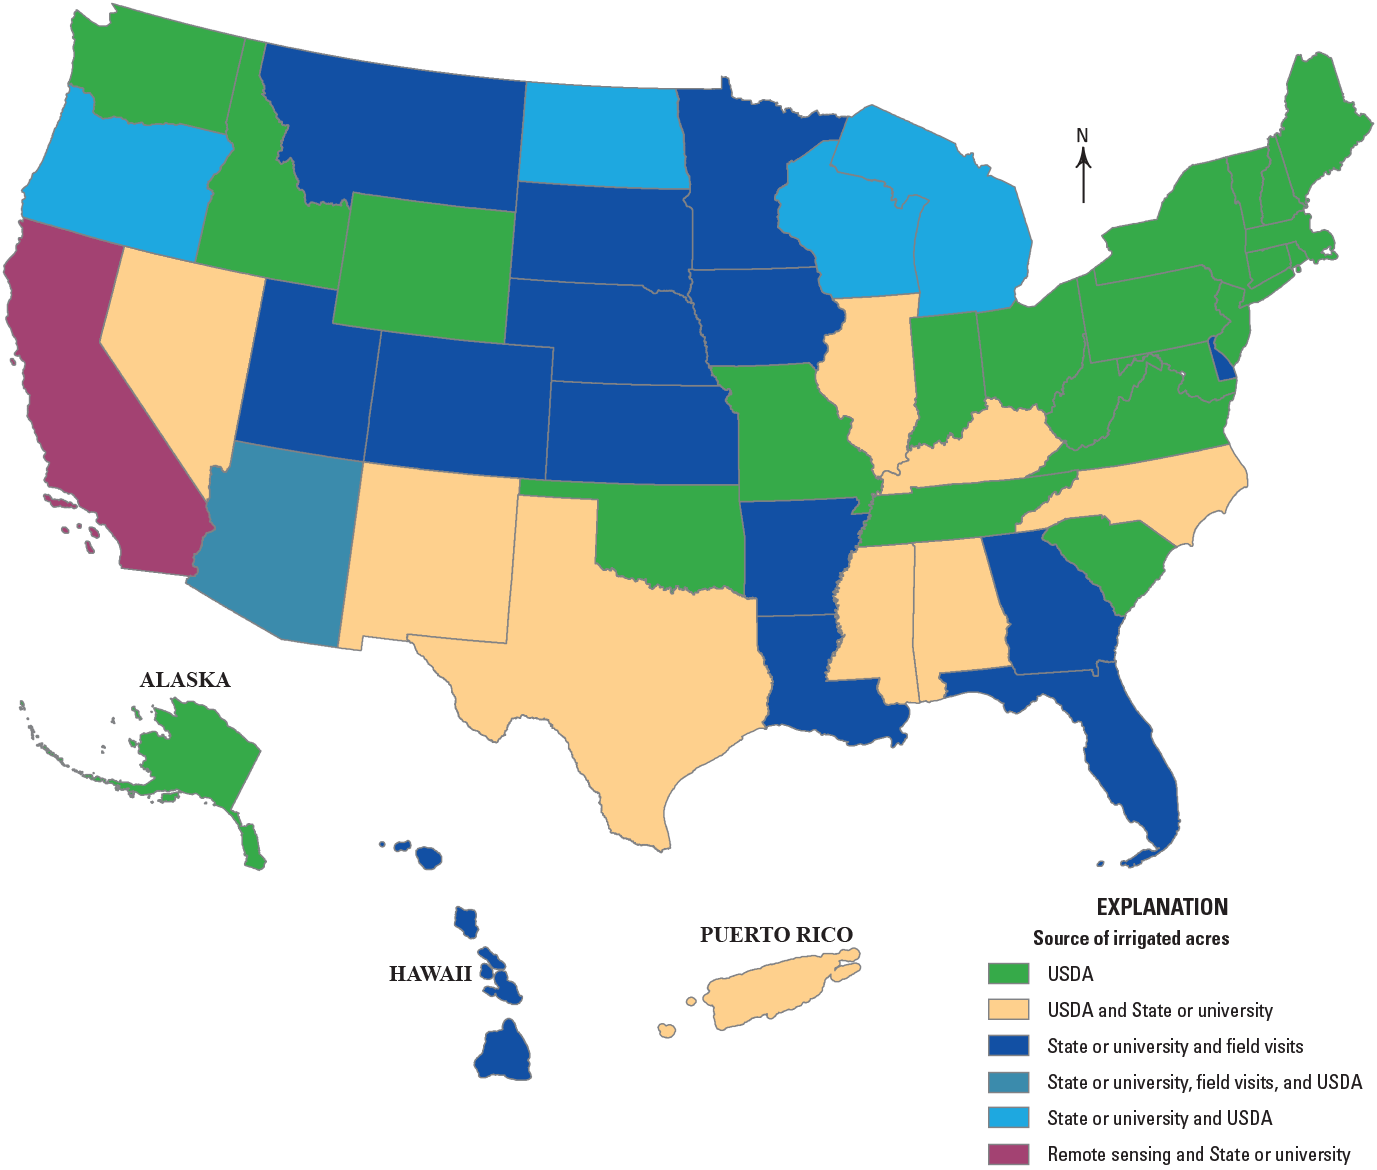
Map of the United States and Puerto Rico showing information sources used to estimate irrigated-crop acreages in each State and territory for 2015. USDA, U.S. Department of Agriculture.
Table 1.
Type and number of information sources used for estimating the number of irrigated acres in each State for 2015.[x, source used; – source not used]
U.S. Department of Agriculture Information
Information from the USDA was used to estimate the number of irrigated acres for 73 percent of States for the 2015 USGS compilation (excluding the District of Columbia and the U.S. Virgin Islands). The USDA’s National Agricultural Statistics Service (NASS) and Farm Service Agency (FSA) products were used by the WSCs and are described below.
Information From the National Agricultural Statistics Service
The USDA–NASS group facilitates several surveys and publishes reports on many aspects of U.S. agriculture. Several of these surveys and reports are directly related to crop acreages and irrigation practices. The WSCs used three USDA products for 2015 irrigated-lands information: the Census of Agriculture, the Irrigation and Water Management Survey (IWMS; formerly known as the Farm and Ranch Irrigation Survey), and the national Cropland Data Layer (CDL) (U.S. Department of Agriculture, National Agricultural Statistics Service, 2014, 2016, 2020a 3134). In some cases, locally created USDA documents were used in estimating the number of irrigated acres, such as an Annual Statistical Bulletin for Nevada (U.S. Department of Agriculture, National Agricultural Statistics Service, 2020c).
The Census of Agriculture (https://www.nass.usda.gov/AgCensus/) is conducted every 5 years to capture on-farm data in all States and U.S. territories (U.S. Department of Agriculture, National Agricultural Statistics Service, 2020a). All farms thought to produce $1,000 or more worth of agricultural products are included. According to the 2017 Census of Agriculture, “The response rate for the 2017 Census of Agriculture Census Mailing List (CML) was 71.8 percent, as compared with the 2012 Census of Agriculture’s response rate of 74.6 percent and 78.2 percent for the 2007 Census of Agriculture” (U.S. Department of Agriculture, National Agricultural Statistics Service, 2019a). Data categories used by WSCs include “crop acres” and “irrigated acres.” Data are available at the county level to prevent disclosing information about individual operations (7 U.S.C. 2276). Primarily, the 2012 Census of Agriculture was used for the 2015 compilation (U.S. Department of Agriculture, National Agricultural Statistics Service, 2014). Thirty States used the Census of Agriculture to identify the number of irrigated acres.
The IWMS is distributed every 5 years to capture on-farm irrigation data in all States. Farms identified in the prior year’s USDA Census of Agriculture or irrigated within the last 5 years are included in the survey. Survey procedures ensure major irrigators in each State are included. However, as with the Census of Agriculture, new irrigators for that survey year are not included in the IWMS. According to the 2017 Census of Agriculture, “The response rate for the 2018 Irrigation and Water Management Survey is 64.4 percent. This compares to 69.8 percent for the 2013 Farm and Ranch Irrigation Survey” (U.S. Department of Agriculture, National Agricultural Statistics Service, 2019b). The WSCs used the values given for irrigated acres, irrigated acres by system type, irrigated acres by source water, and on-field application estimates from the IWMS to estimate the number of irrigated acres. Similar to the Census of Agriculture data, IWMS data are only available at the State level to prevent disclosing information about individual operations. Comparisons with USGS compilations are limited due to nonconcurrent years, State-level versus county-level data, and on-field applications versus withdrawals. As a result, no WSC exclusively used the IWMS information to estimate the number of irrigated acres; 12 States used IWMS data in conjunction with other data sources.
The CDL is an agriculture-focused, georeferenced land-cover raster at 30-meter resolution for the conterminous United States (CONUS) published annually by the Research and Development Division, Geospatial Information Branch, Spatial Analysis Research Section of the NASS. The primary purpose of the CDL is to estimate agricultural acreages (U.S. Department of Agriculture, National Agricultural Statistics Service, 2020b, sec. 1, no. 5); therefore, the CDL accounts for all crop acres (irrigated and rainfed).
The CDL was first processed in 1997 using 56- and 30-meter resolution inputs. States were added until 2008 when the CONUS was processed for the first time. Over time, additional satellite sensors, ground truth data, new software, and other ancillary data have enhanced the decision-tree processing (U.S. Department of Agriculture, National Agricultural Statistics Service, 2020b, sec. 3, no. 2). However, the CDL is still challenged in areas of limited agriculture. Limited agriculture can be defined as new fields or small fields that have existed for several years.
Note that acreage estimates based on the CDL are unlikely to match other agricultural statistics because CDL-based estimates use pixel counting to calculate acreages. Pixel counting is the process of summing the number of pixels for a given category over a specified area and then multiplying that value by the size of the pixel (CDL uses 30× 30-meter pixels) to determine the total area. Because a fixed pixel size does not always represent the true areal extent of an agricultural field, pixel-counting acreages are often biased low compared with other estimates (U.S. Department of Agriculture, National Agricultural Statistics Service, 2020b, sec. 1, no. 6). For the 2015 compilation, 11 States used the 2015 CDL to estimate the number of irrigated acres (U.S. Department of Agriculture, National Agricultural Statistics Service, 2016).
Information From the Farm Service Agency
The FSA manages several programs that document cropland use on farms as part of their mission to provide services to farm operations, including loans, commodity price supports, conservation payments, and disaster assistance. Producers that participate in these programs are required to submit annual reports documenting cropland use on their farms to State and county offices. Submitted data are aggregated to the county or State scale before they are shared publicly. These data consist of the State and county name, the crop type, the intended use of the crop, an indication if irrigation was used, and an accounting of the acres that were planted and if they produced a viable, harvested crop for a given year (U.S. Department of Agriculture, Farm Service Agency, 2020b; Honig, 2020). The NASS uses the FSA planted-acreage data to complement their survey data. Four WSCs shared the same approach and used these data by modifying the 2012 Census of Agriculture numbers to estimate the number of acres irrigated in 2015.
The National Agriculture Imagery Program (NAIP) is managed by the FSA and acquires remotely sensed aerial imagery on a 3-year cycle during the agricultural growing seasons for the CONUS. The NAIP imagery is acquired at a 1-meter ground-sample distance with a spectral resolution in natural colors (red, green, and blue) and, for some areas, natural color and near-infrared. This imagery is “leaf-on” imagery used as a base layer for geographic information system (GIS) programs in the FSA’s County Service Centers and is used by the FSA to maintain the Common Land Unit (CLU) boundaries, which are not publicly available. The CLU boundaries are “the smallest unit of land that has a permanent, contiguous boundary, a common land cover and land management, a common owner and a common producer in agricultural land associated with the USDA farm programs” and is tracked from one image acquisition to the next to assist in the confidence of farm identification (U.S. Department of Agriculture, Farm Service Agency, 2020a). The imagery is collected when there is no more than 10 percent cloud cover per quarter quad time. The high spatial resolution of NAIP imagery enabled the California and Arizona WSCs to delineate agricultural field boundaries and estimate the number of irrigated acres for their States.
Information From State Agencies and Universities
Some WSCs used GIS polygon datasets representing field-permitted boundaries, irrigated acres, verified irrigated land, or areas with water rights for irrigation to estimate the number of irrigated acres. These types of data were usually provided by State agencies or universities and maintained at varied time intervals. Twelve States exclusively used information from State agencies or universities to estimate the number of county-wide irrigated acres, and 16 States used these types of information sources in combination with other datasets to estimate the number of irrigated acres. In certain cases, such as those in Arizona, Florida, and Puerto Rico, the WSCs partnered with State agencies to inventory irrigated-crop acreages (Marella and Dixon, 2015; Marella and others, 2016).
Remotely Sensed Information
The USGS Earth Resources Observation and Science (EROS) Center developed a suite of irrigation products using the Moderate Resolution Imaging Spectroradiometer (MODIS) satellite (Pervez and Brown, 2010). The MODIS Irrigated Agriculture Dataset (MIrAD–US) is one such dataset that incorporates county-level irrigated-area statistics from the USDA; annual peak Normalized Difference Vegetation Index (NDVI) values derived from Collection 6 Aqua MODIS imagery; and a land-cover mask for agricultural lands derived from the USGS National Land Cover Database (NLCD). The MIrAD provides irrigation datasets at 250-meter (m) and 1-kilometer (km) spatial resolutions for the same years as the USDA Census of Agriculture. Although some States and territories, such as Utah and Puerto Rico, explained in their documentation that remotely sensed information was used to identify irrigated acres, the California WSC was the only center that used remotely sensed imagery information to estimate the number of irrigated acres for their State.
Sources and Methods for Estimating Irrigation Withdrawals and Consumptive Use
Irrigation withdrawals and consumptive-use values were determined using methods that differed between States and, in some cases, varied within individual States. These methods can be divided into direct, indirect, and mixed methods (table 2, fig. 4). Direct methods for estimating withdrawals involved the receipt of measured or estimated withdrawals values for counties from State and local agencies. Indirect methods for estimating withdrawals are those in which ancillary or potentially complementary data were used to arrive at county-level withdrawal values because measured or estimated water-withdrawals data were unavailable. The mixed-methods approach used both direct and indirect methods because reported information was only available for part of the State. Sixteen States exclusively used water withdrawal values directly provided by States or local agencies for the 2015 compilation. Twenty-six States exclusively used indirect methods for water withdrawal values. Ten States had a portion of the State’s water-withdrawals data provided by a State, university, or local source (direct method), and the remaining values were estimated through indirect methods.
Consumptive-use estimates for 2015 were made in addition to values of total water withdrawals. The term “consumptive use” is defined as “the part of water withdrawn that is evaporated, transpired, incorporated into products or crops, consumed by humans or livestock, or otherwise not available for immediate use” (U.S. Geological Survey, 2020). Several States estimated consumptive use first and then added irrigation system and conveyance inefficiencies to get a withdrawal total. For these States, methods are described in the indirect methods section. Other States estimated total withdrawals first and then subtracted irrigation system and conveyance inefficiencies from that number to determine consumptive-use values. This second approach is discussed in the section “Sources and Methods for Estimating Conveyance and Irrigation System Efficiencies.”
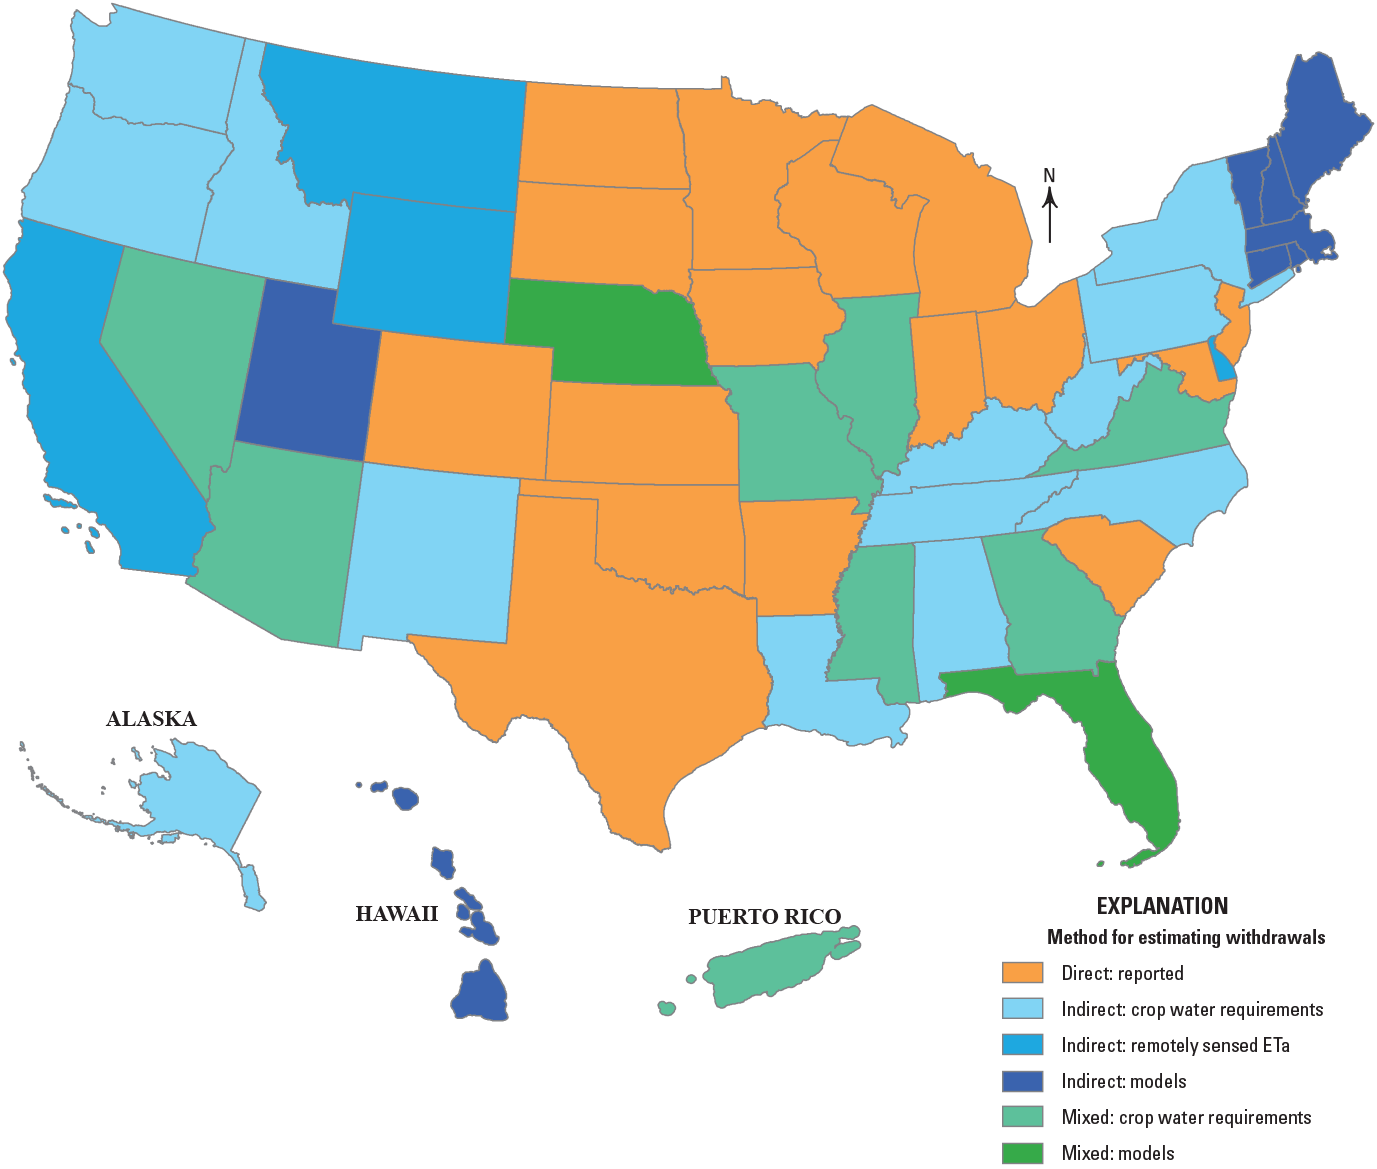
Map of the United States showing methods used for estimating withdrawals or consumptive-use values for 2015 in each State. Methods are defined in the “Sources and Methods for Estimating Irrigation Withdrawals and Consumptive Use” section. ETa, actual evapotranspiration.
Table 2.
Information sources and methods for estimating withdrawals or consumptive-use values, by State and U.S. Territory, for 2015.[x, source used; – source not used]
Direct Methods
A total of 26 WSCs used measured or reported information as sources for estimating irrigation withdrawals and consumptive use values for 2015. The reported data are provided by State and Federal crop-reporting programs, local irrigation districts, canal companies, and incorporated management areas. Although States provided withdrawal values, these reported withdrawals are not always measured. Some of the reported information comes from estimates of withdrawals from permitted-use or power-consumption data. In some cases, the information provided by State agencies may be estimated through the same indirect methods used by the WSCs; however, information describing the methods were not always included in the WSC 2015 documentation. Since the WSCs do not calculate these estimates, they are categorized as direct estimates. The WSCs accept these withdrawal values as relatively accurate because of local knowledge about irrigation practices. WSCs estimated consumptive-use values for States that provided withdrawal estimates. In most cases, consumptive use was determined by incorporating coefficients related to irrigation-system and conveyance efficiencies.
Indirect Methods
When there was no measured or reported information available for water withdrawals, WSCs estimated withdrawals using ancillary or potentially complementary data, such as locally determined crop water requirements and ET estimates. There were 22 States that used locally determined crop water-requirements data, while 4 States used ET estimates to determine water-withdrawal values for 2015, and 10 States used outputs from Soil-Water Balance or water budget models to estimate withdrawal values. For many of these methods, withdrawal values were based on estimates of consumptive use.
Crop Water Requirements
A total of 22 States identified locally determined crop-specific application rates to estimate withdrawal values. This method assumes that irrigation is applied to supplement the effective precipitation required to meet crop water requirements. “Effective precipitation” is defined as the amount of precipitation that becomes soil water storage and is available for crops (Dastane, 1978). The crop type and the acreage numbers for each crop are requirements for estimating withdrawals using this method. The crop information was gathered from previously mentioned USDA sources or local sources. Some of the crop-specific application rates are intended to estimate consumptive-use values and others to estimate total-withdrawals values. This method uses the number of crop acres for a given county and multiplies the number of crop acres by the crop-specific application rate. This method assumes that each farmer can accurately estimate effective precipitation when determining the quantity of irrigation-water withdrawals to meet the per-crop application rate. Withdrawal estimates made using this method can be adjusted, as was documented for Missouri, by relating annual average precipitation for 2015 to the period of record-average annual precipitation used to estimate the per-crop application rate.
Remotely Sensed Estimates of Actual Evapotranspiration
The EROS Center provided the NWUSP with 2015 calendar-year county-level estimates of ETa for the CONUS and Hawaii. The ETa estimates are based on 1-square-kilometer (km2) resolution MODIS satellite data analyzed through the SSEBop model (Senay and others, 2013). The ETa dataset was provided as a consistently generated dataset to assist WSCs with 2015 irrigation consumptive-use estimates. The ETa dataset (comma delimited table) supplied to the WSCs is available as a USGS data release (Painter and others, 2021).
County-level ETa estimates are based on the mean of all individual 1-km pixels within each area. These estimates were reported as mean total depth (in inches) of the following areas within each county: (1) annual values for county-wide areas including agricultural and nonagricultural lands, (2) monthly and annual values for areas classified as potentially irrigated areas (PIA)—agricultural areas with healthy vegetation, and (3) annual values for areas represented as irrigated lands from geospatial datasets provided by some States. The dataset also included the total acreage of agricultural lands classified as hay, pasture, and cultivated crops from the 2011 NLCD (U.S. Geological Survey, 2014).
County-wide ETa estimates were restricted to PIA through the creation of a geospatial dataset that represents maximum calendar year values in the 2015 MODIS-based NDVI for all 1-km pixels within agricultural lands (pasture-hay and cultivated crops) as classified in the 2011 NLCD (U.S. Geological Survey, 2014). This restriction effectively eliminated other land-use classifications that are not likely to be irrigated. The designated agricultural area was further screened by EROS using the 2015 NDVI values. Peak-season NDVI values are used to assess vegetation density and vigor (health and photosynthetic activity) by using the ratio between the MODIS-sourced red and near-infrared spectra. Higher NDVI values represent greater vegetation vigor and density. NDVI values of moderately vegetated areas commonly start at 0.4, and irrigated areas during the peak season are typically 0.7 and higher (Gabriel Senay, U.S. Geological Survey, written commun, February 20, 2017).
A peak-season NDVI value of 0.7 or greater within individual 1-km pixels was selected as the threshold to indicate that a portion of the 1-km pixel was irrigated during the growing season. The resulting PIA geospatial layer for the 2015 compilation efforts represented 1-km pixels within agricultural lands with maximum (peak) NDVI values greater than or equal to 0.7. However, this approach creates uncertainty in the delineation of irrigated versus nonirrigated 1-km pixels because pixels can have an NDVI value equal to or greater than 0.7 due to the presence of riparian areas, wetlands, or any areas where there is moisture available to promote healthy vegetation. Therefore, this approach likely overestimates the total irrigated area.
The WSCs in some States (Arizona, Colorado, Delaware, Florida, Georgia, Illinois, Kansas, Maryland, Montana, New Jersey, New York, North Carolina, Oklahoma, Pennsylvania, Virginia, Washington, and Wisconsin) provided spatial datasets of irrigated lands for some portion of their respective States. These spatial datasets were primarily from local sources, such as State agencies. Also, some States—such as Arizona and Florida—provided spatial datasets of irrigated lands produced by the USGS for cooperative projects. The WSCs were asked to verify these datasets through other sources, internal or external to the USGS, to ensure that these data reasonably represent 2015 conditions. Externally provided geospatial datasets reportedly represent the extent of irrigated lands, and the WSCs typically used these ETa values for only those areas.
The SSEBop ETa dataset represents actual evapotranspiration that occurs not only due to applied irrigation water but also due to effective precipitation and subirrigation (that is, root uptake of shallow groundwater). This dataset was intended to be verified, and users were encouraged to evaluate the ETa data before incorporating them into their estimates of consumptive use. Users were urged to obtain and include local information such as values of effective precipitation in their analysis and add detailed metadata as part of their documentation.
In the semi-arid to arid regions of the United States (most of the western United States), where irrigation accounts for much of the water requirements for crops, the ETa dataset is likely affected by the inclusion of some fraction of nonirrigated lands. In relatively humid regions of the United States (most of the eastern United States), where healthy vegetation is common and effective precipitation often accounts for a large fraction of the crop water requirements, most areas had peak-season NDVI values of greater than 0.7, regardless of whether irrigation was applied (Painter and others, 2021). In these humid regions, where irrigated lands may be a small fraction of the overall croplands, the ETa dataset may more closely approximate the ETa resulting from effective precipitation than from applied irrigation. In these cases, the ETa dataset could be used to indicate the ET that occurs because of effective precipitation. The WSCs were advised to include estimates of effective precipitation in their calculation of irrigation withdrawals to meet the ideal water requirements for crops.
Although all WSCs evaluated these data for use in making consumptive-use estimates, four States—California, Delaware, Montana, and Wyoming—used the provided MODIS-sourced ETa estimates as the primary source for estimating withdrawals and consumptive use. The WSCs in Idaho, Illinois, Indiana, Kansas, Maryland, North Dakota, and South Dakota used these data to estimate consumptive use for at least part of the State, although they used other information for estimating withdrawals. Puerto Rico, Arizona, and New Mexico used estimates of ETa from sources other than MODIS-sourced ETa when estimating consumptive use. Puerto Rico used an ET dataset and methodology from the University of Puerto Rico. In Arizona, consumptive water-requirement rates for crops were determined by using a modified Blaney-Criddle method. Similarly, in the Upper Colorado River Basin of New Mexico, the modified Blaney-Criddle method was used for consumptive-use estimates, and the Blaney-Criddle equation was used for the rest of New Mexico (Blaney and Criddle, 1962; U.S. Department of Agriculture, Soil Conservation Service, 1970; Bureau of Reclamation, 1992).
Soil-Water Balance Models
Some WSCs used Soil-Water Balance (SWB) models to calculate estimates of irrigation-water-withdrawals and consumptive-use values (Westenbroek and others, 2010). These models, and other reported data, were used by WSCs in Nebraska and six States in the northeastern part of the United States. These models incorporate soils, weather, and crop data to estimate irrigation rates. Hawaii and Utah used soil-water budget models, and Florida used reported data calculated with a State model for estimates of withdrawals and consumptive use.
Sources and Methods for Estimating Conveyance and Irrigation System Efficiencies
Irrigation withdrawal is the amount of water diverted from a surface-water body or pumped from groundwater and includes the amount of water consumed by the crop and the water lost because of irrigation and conveyance-system inefficiencies (Allen and others, 1998). Most WSCs considered water loss due to conveyance and irrigation system-type inefficiencies when estimating withdrawals. However, not all WSCs documented the sources of information they consulted when quantifying these losses. These two classes of losses, and the information sources used by the WSCs, are described here.
Conveyance efficiency is the fraction of source (withdrawn) water that reaches the fields after accounting for the water lost or gained during transit. Water is typically lost in transit from a pipe, canal, conduit, or ditch by seepage, ET, or maintenance issues (for example, a leaking pipe). The volume of loss depends on many factors, including the design properties of the canal (lined versus unlined), soil properties (for unlined canals), environmental factors, and the distance the water is transported. Generally, the water lost during conveyance is unavailable for immediate use; however, leakage from an irrigation ditch, for example, may percolate into a groundwater source and be available for future use.
Conveyance loss is also dependent on the water source type. The point of withdrawal for groundwater is typically much closer to the application site because wells are often placed in or near the fields to which they supply irrigation water, thereby resulting in only a small volume of water loss. Surface-water conveyance is much more complex because farm fields are rarely located near streams or rivers; in some cases, the fields are hundreds of miles from the point of diversion, which results in higher levels of water loss than those that occur with groundwater. In some cases, canals gain water due to shallow groundwater levels; however, regional assessments represent net changes in flows between surface diversion points and canal networks. Accordingly, conveyance efficiencies averaged over a conveyance system consisting of networks of canals usually reflect a net system loss rather than a gain.
The irrigation-system efficiency is the fraction of source (withdrawn) water consumed (evapotranspired) by the soil and crops after it is transported to the application site. These efficiencies are strongly dependent on many factors: the type and age of the irrigation system (sprinkler, surface, and micro-irrigation), environmental conditions, soil properties, and field leveling. Additionally, these efficiencies can vary from one field to the next. The volume of excess water necessarily applied to the field to supply the entire crop can be determined by the type of irrigation system. Water losses after application to the field include nonbeneficial evaporation, surface runoff, and deep percolation below the root zone; the latter two losses may ultimately allow water to be available for future use.
The proportions of irrigated lands, in acres, by each system type (sprinkler, surface, and micro-irrigation) must be established to determine overall irrigation-system efficiency. The WSCs were required to report the system type as proportions of the total number of irrigated acres for the 2015 compilation (fig. 5). The methods WSCs used to determine the number of acreages served by each system type commonly involved obtaining data from State water agencies (for example, Georgia and Kansas) or USDA data (for example, Missouri and New York) and then generating coefficients for each system type. Some States (for example, California) provided irrigation system data at the county level, whereas other information sources provided only statewide results for irrigation systems (for example, the IWMS). The WSCs also used local knowledge about farming practices and crop-type data to estimate irrigation-system acreages. For example, Iowa almost exclusively uses center-pivot irrigation, so it was assumed that 100 percent of irrigation systems were sprinkler systems.
With so many factors contributing to water loss in irrigation practices, conveyance and irrigation-system efficiencies vary from State to State, sometimes even within a State (table 3). State-level documentation identified 17 States that definitively consider efficiency losses when estimating consumptive use or withdrawals. The 2015 documentation identified several reports used to estimate efficiencies; they include the U.S. Department of Agriculture, Soil Conservation Service (1976), King and others (1977), Solomon (1988), Howell (2003), Irmak and others (2011), Engott and others (2017), and Johnson and others (2018). Additional information from State agencies and universities were used to estimate irrigation-system efficiencies for Colorado, California, Florida, Maryland, Nevada, and Wyoming. Idaho and Oklahoma used information from USGS studies for efficiency information. Connecticut, Kentucky, Massachusetts, Maine, Michigan, Rhode Island, and Vermont used statewide coefficient information from Shaffer and Runkle (2007). Alabama, Georgia, North Carolina, and South Carolina reported the same volume for withdrawals and consumptive use, which indicates that zero water loss was estimated due to either water conveyance or the irrigation system type. Most States only considered irrigation system efficiencies, while Oklahoma, Montana, Florida, and Arizona estimated conveyance efficiencies separately from irrigation system efficiencies.
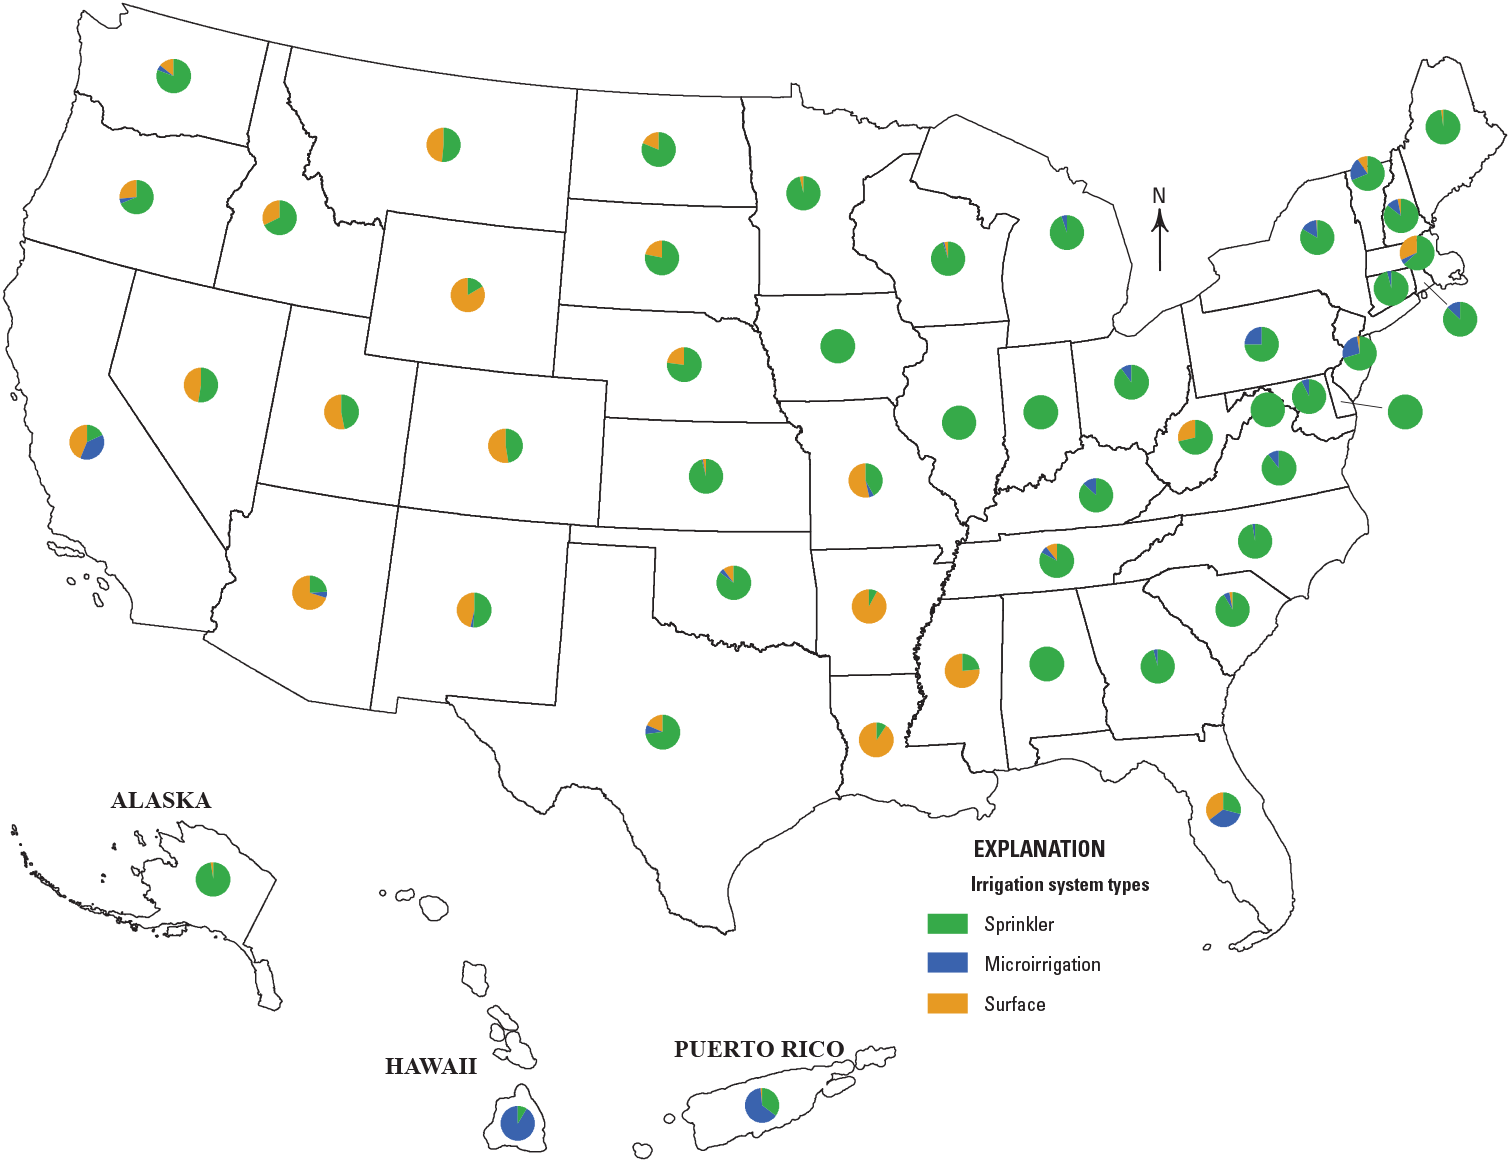
Map of the United States and Puerto Rico showing the proportion of irrigation system types for each State and territory for 2015.
Table 3.
State-level conveyance and irrigation system-efficiency coefficients used for the 2015 water-use compilation.[avg, average; med, median; %, percent; USGS, U.S. Geological Survey; –, no data]
| State or U.S. Territory | Percent consumptive use | Irrigation-system efficiency, by system type | Conveyance efficiency, by water source type | Information source or organizational source type | |||
|---|---|---|---|---|---|---|---|
| Sprinkler | Micro-irrigation | Surface | Groundwater | Surface water | |||
| Alabama | 100.0% | 100% | – | – | – | – | State |
| Alaska | 91.4% | 90% | – | – | – | – | State |
| Arizona | 80.8% | 80% | 90% | 50% | 100% | 50% med | Howell (2003) |
| Arkansas | 65.3% | – | – | – | – | – | – |
| California | 77.4% | 76% | 86% | 72% | – | – | University |
| Colorado | 29.4% | 76% | 86% | 72% | – | – | University |
| Connecticut | 94.7% | 95% | 95% | – | – | – | Shaffer and Runkle (2007) |
| Delaware | 83.8% | – | – | – | – | – | – |
| District of Columbia | 80.0% | – | – | – | – | – | – |
| Florida | 69.4% | 70% | 80% | 50% | 83% | 78% | State |
| Georgia | 100.0% | 100% | 100% | – | – | – | State |
| Hawaii | 83.9% | 70% | 85% | – | – | – | Johnson and others (2018); Engott and others (2017) |
| Idaho | 58.3% | 75% | 91% | 40% | – | – | USGS |
| Illinois | 93.6% | – | – | – | – | – | – |
| Indiana | 90.2% | – | – | – | – | – | – |
| Iowa | 80.3% | 80% | – | – | – | – | Howell (2003). |
| Kansas | 82.1% | – | – | – | – | – | – |
| Kentucky | 90.2% | 95% | 95% | 95% | – | – | Shaffer and Runkle (2007) |
| Louisiana | 66.7% | 75% | – | 65% | – | – | State |
| Maine | 95.2% | 95% | – | 95% | 95% | 95% | Shaffer and Runkle (2007) |
| Maryland | 88.8% | 95% | 95% | 95% | – | – | State |
| Massachusetts | 21.4% | 95% | 95% | 95% | – | – | Shaffer and Runkle (2007) |
| Michigan | 90.1% | 95% | 95% | – | – | – | Shaffer and Runkle (2007) |
| Minnesota | 79.0% | 80% | – | 70% | – | – | Howell (2003) |
| Mississippi | 76.3% | 80% | – | 75% | – | – | Solomon (1988) |
| Missouri | 31.8% | – | – | – | – | – | – |
| Montana | 25.1% | 77% | – | 50% | 100% | 64% avg | State |
| Nebraska | 91.0% | – | – | – | – | – | – |
| Nevada | 75.4% | 80% | 80% | 70% | – | – | State |
| New Hampshire | 95.0% | – | – | – | – | – | – |
| New Jersey | 68.1% | – | – | – | – | – | State |
| New Mexico | 59.5% | – | – | – | – | – | – |
| New York | 95.3% | – | – | – | – | – | – |
| North Carolina | 100.0% | 100% | 100% | – | – | – | State |
| North Dakota | 34.9% | – | – | – | – | – | – |
| Ohio | 89.8% | – | – | – | – | – | – |
| Oklahoma | 81.7% | – | – | – | 83% | 78% | USGS |
| Oregon | 66.7% | – | – | – | – | – | King and other (1977) |
| Pennsylvania | 90.4% | – | – | – | – | – | – |
| Puerto Rico and U.S. Virgin Islands | 96.7% | – | – | – | – | – | – |
| Rhode Island | 95.1% | 95% | 95% | – | – | – | Shaffer and Runkle (2007) |
| South Carolina | 100.0% | 100% | 100% | 100% | – | – | State |
| South Dakota | 52.1% | – | – | – | – | – | – |
| Tennessee | 80.1% | 80% | 80% | 75% | – | – | Solomon (1988) |
| Texas | 78.0% | – | – | – | – | – | – |
| Utah | 68.0% | – | – | – | – | – | – |
| Vermont | 94.2% | – | – | – | – | – | – |
| Virginia | 85.1% | 90% | 95% | – | – | – | Irmak and others (2011) |
| Washington | 79.0% | 80% | 90% | 70% | – | – | Howell (2003) |
| West Virginia | 84.8% | 90% | – | 80% | – | – | Irmak and others (2011) |
| Wisconsin | 63.7% | – | – | – | – | – | – |
| Wyoming | 27.6% | 85% | – | 55% | 40–55% | 40–55% | State |
Sources and Methods for Identifying Water Source Type
Determining the source type (groundwater and surface water) and quantity (volume) of water used for irrigation is essential for water-availability assessments; therefore, they were required elements of the 2015 compilation (fig. 6). Reported water rights or permit information from State or local agencies were used to identify the water source type for 29 States (table 4). Previous USGS compilations were used to identify the water source type for 18 States; Pennsylvania and Washington used statewide IWMS and Census of Agriculture data; California and Connecticut used model data; Louisiana and North Carolina used data from universities; and Puerto Rico relied on field verification when determining the water source type. The District of Columbia only estimated irrigation for golf courses, which are supplied by surface water, and Alaska and Illinois reported all irrigation supplied by groundwater.
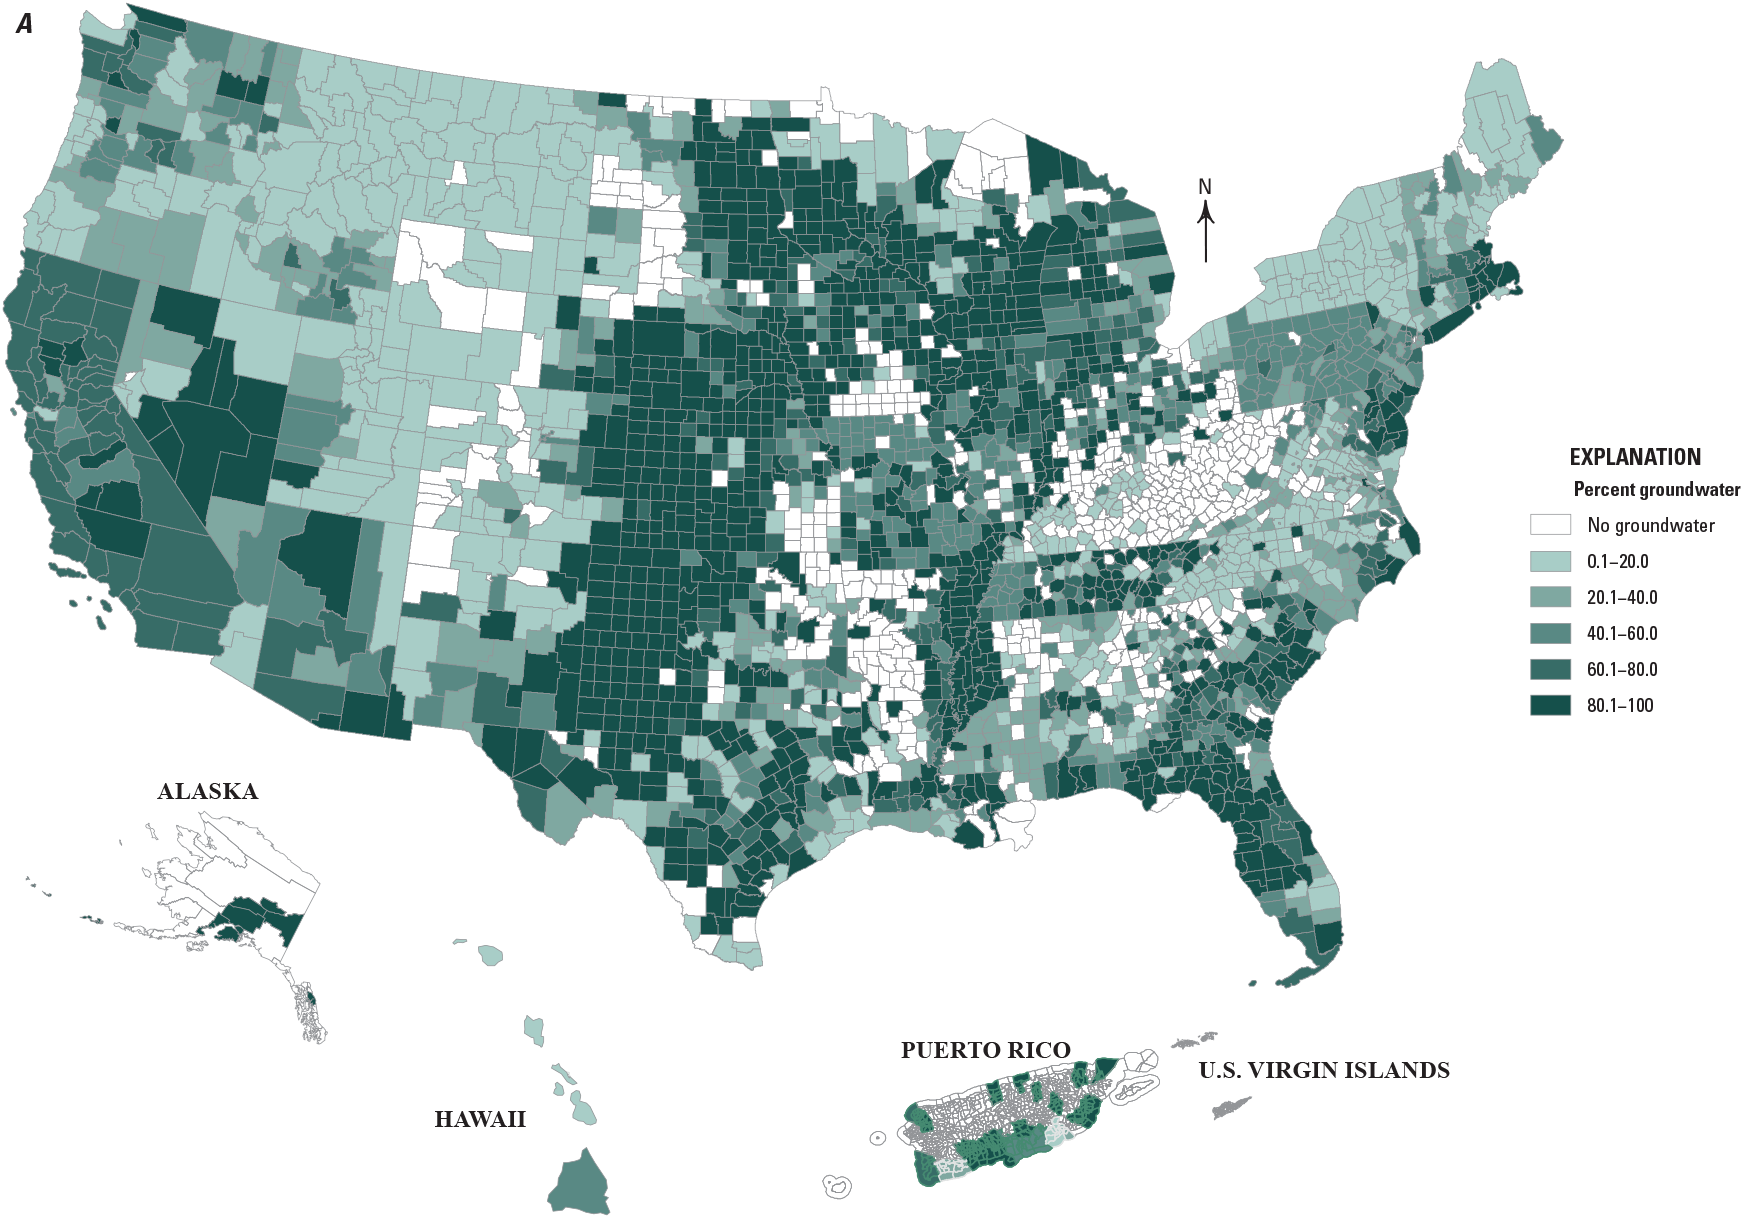
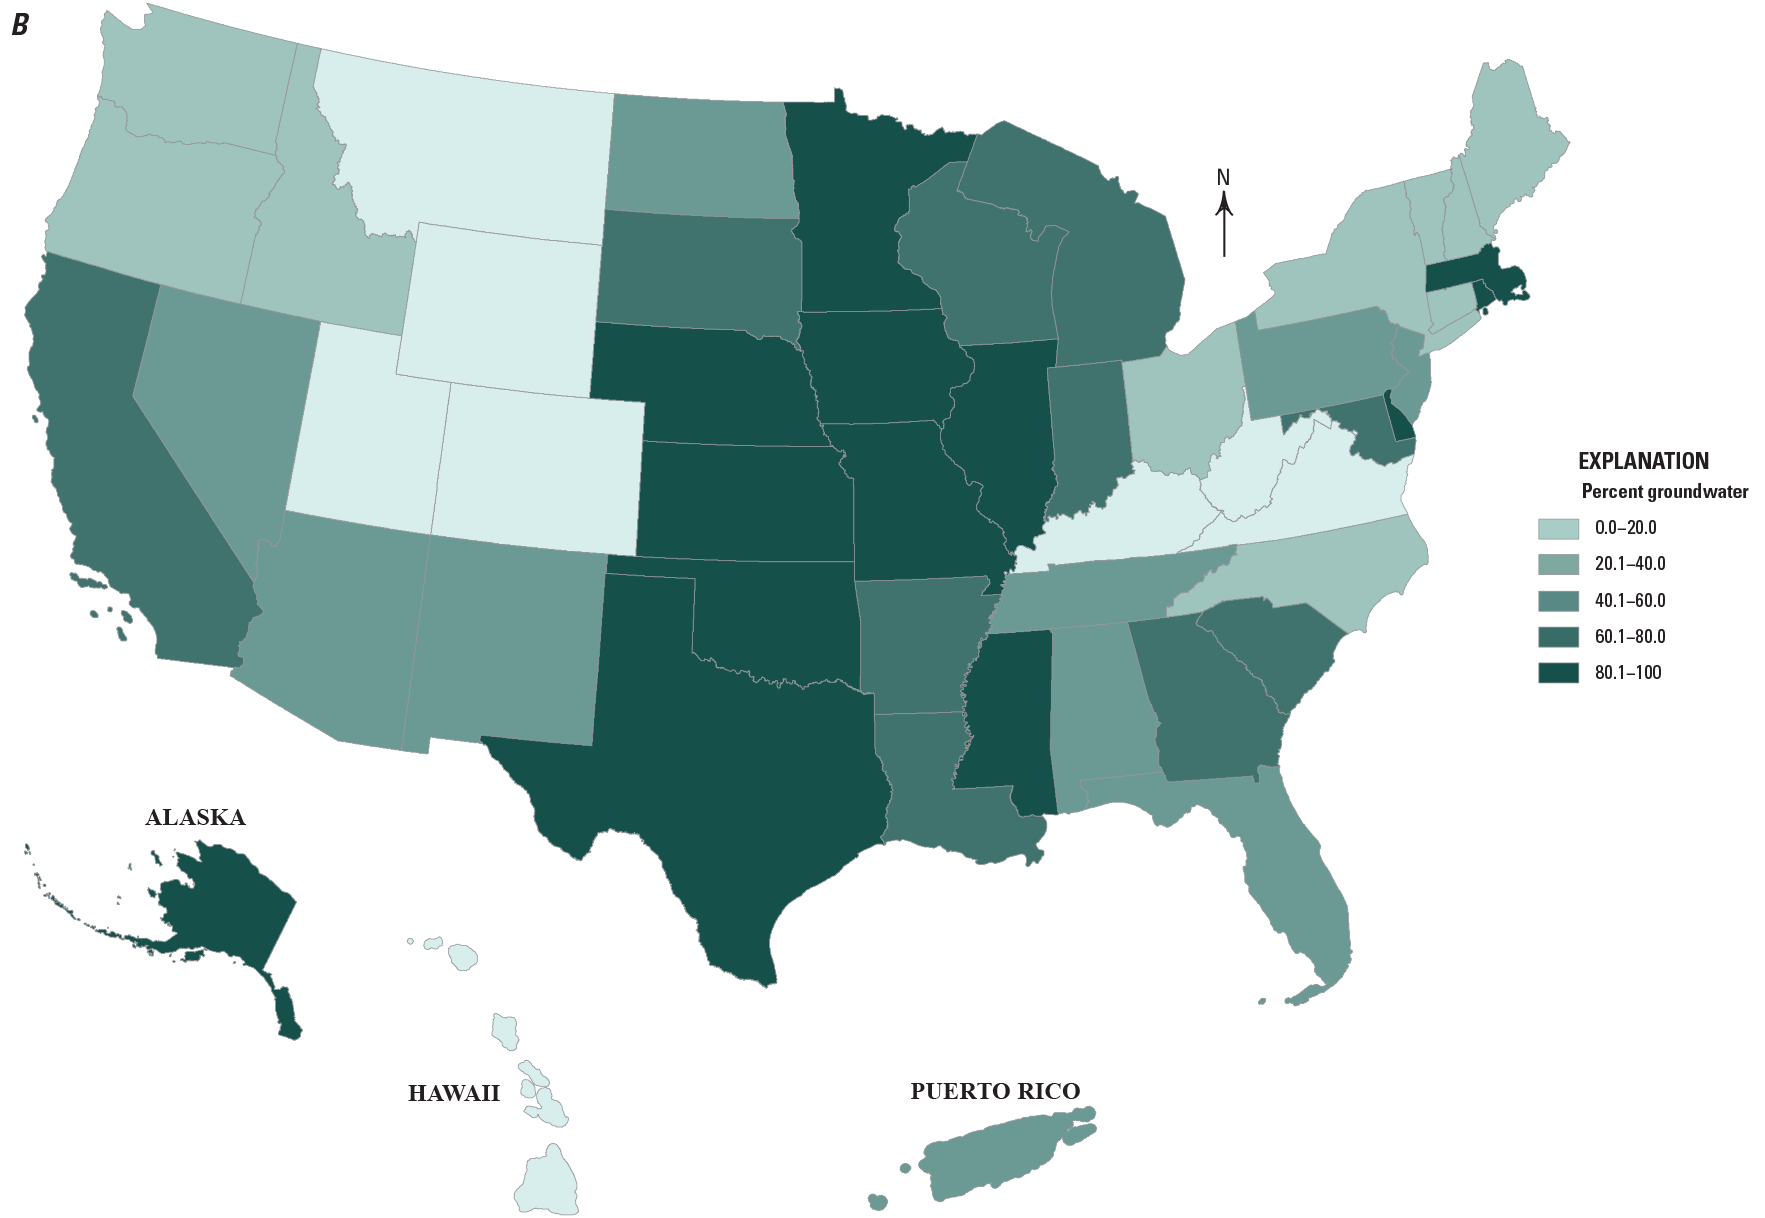
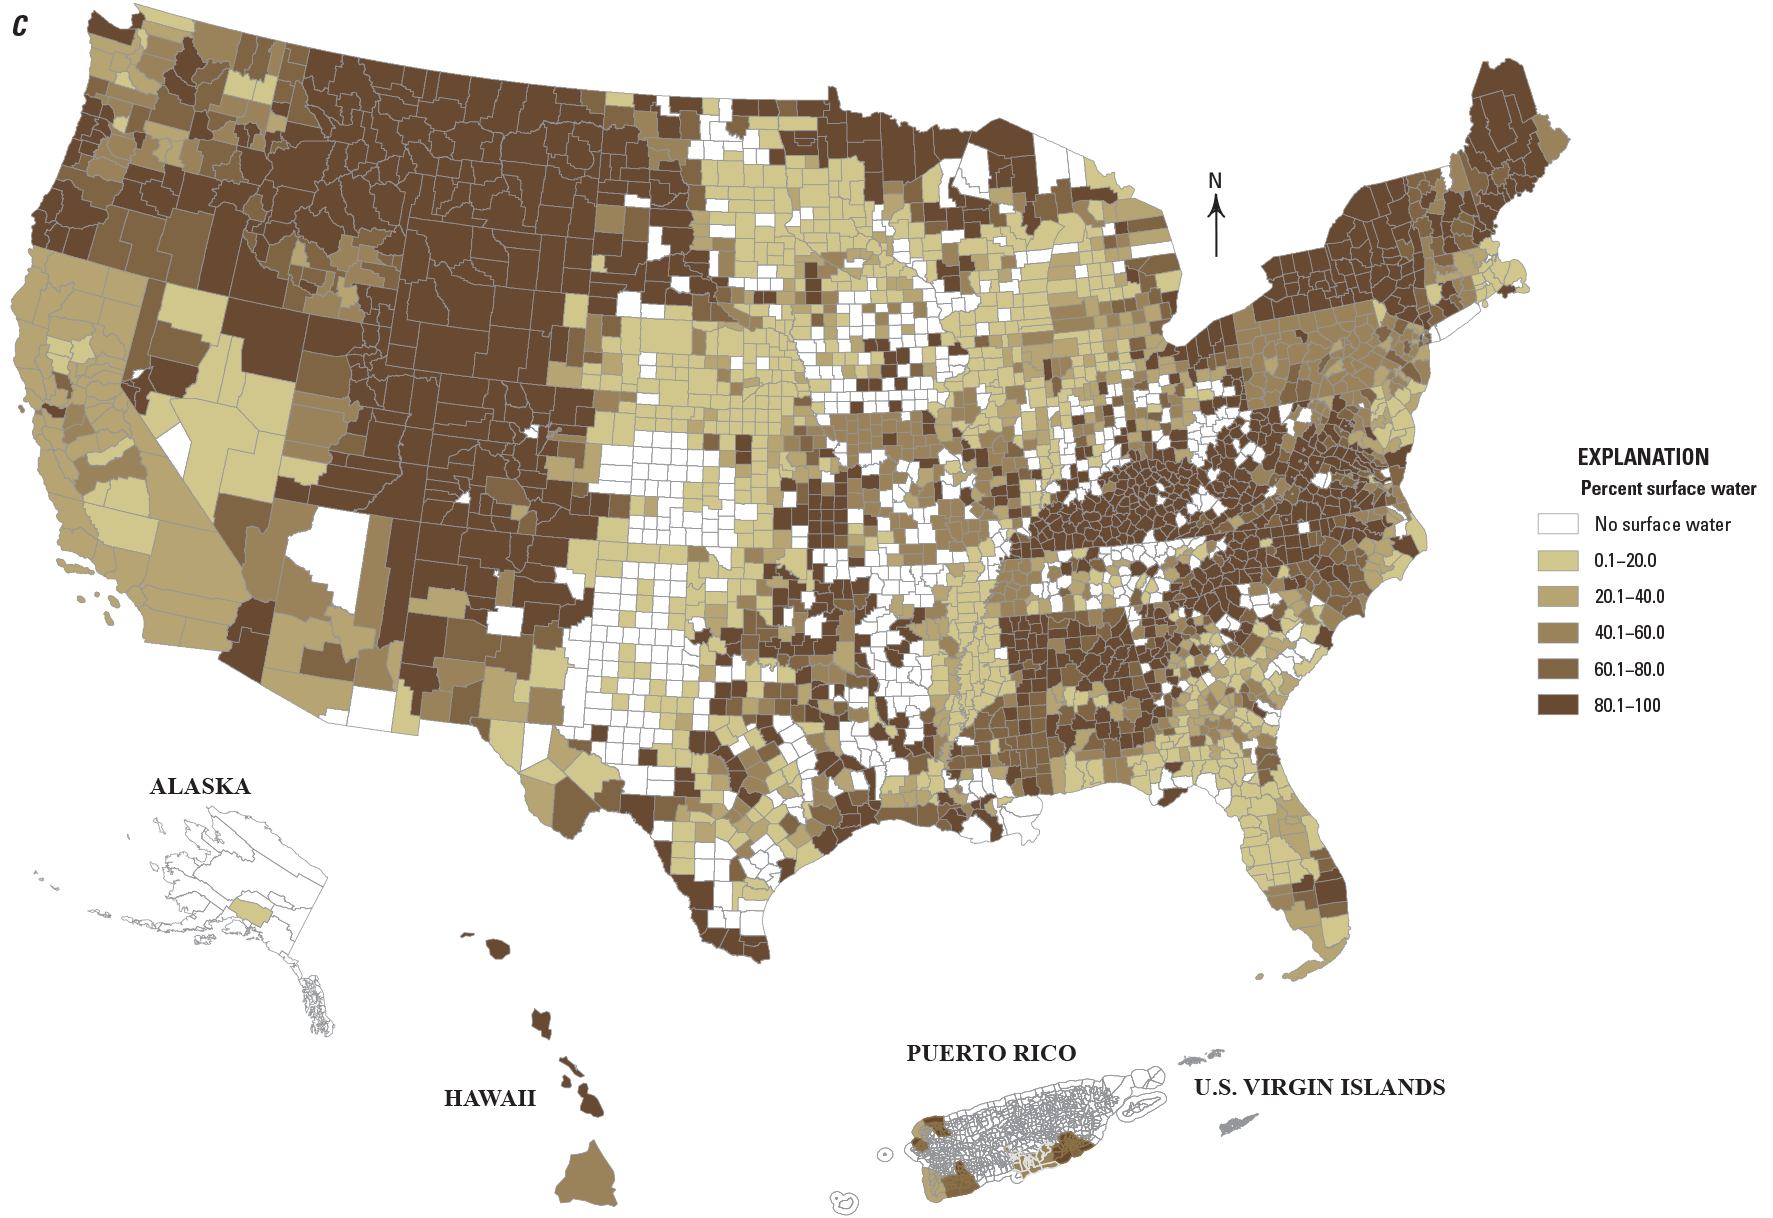

Maps of the United States, Puerto Rico, and the U.S. Virgin Islands (A, C), and of the United States and Puerto Rico (B, D) showing the percentages of groundwater and surface water. Groundwater is shown by (A) county (in the United States and the U.S. Virgin Islands) or municipality (in Puerto Rico) and (B) State or territory. Surface water is shown by (C) county (in the United States and the U.S. Virgin Islands) or municipality (in Puerto Rico) and (D) State or territory.
Table 4.
Sources of information used by States to determine groundwater and surface-water irrigation withdrawal totals for 2015.[x, source used; – source not used; USGS, U.S. Geological Survey]
Discussion
Understanding the information and methods used to estimate water use for irrigation adds insight into how comparable the estimates are between States and how these estimates should be used. Annual irrigation water-use totals are dependent on many factors, including weather, crop type, physiographic region, soil type, irrigation and conveyance system types, and socioeconomic indexes. These factors indicate that spatial and temporal variations in water use for irrigation occur. Irrigation water use is not constant for all areas, years, or even the same crop in different locations. The WSC documentation for 2015 identifies that measured withdrawals for irrigation are sparse, and estimates must be calculated using information that describes the factors that impact the amount of water needed.
The review of methods used for the 2015 compilation report identified that some factors are addressed in some locations but not in others. The information detailing these factors is not comprehensively available for all locations, which is why they are inconsistently considered in the estimates. Although the approaches chosen by the WSCs most often relied on the best available information, data limitations can cause significant uncertainties in irrigation estimates and may not capture the spatial variability inherent to irrigation water use across all States.
The accuracy in the number of 2015 irrigated acres could be limited due to the extensive use of USDA information collected during 2012 and 2013 (U.S. Department of Agriculture, National Agricultural Statistics Service, 2014, 2020a). Climate variations affect where and when fields are irrigated. Using static irrigated-acres data for multiple years despite climate variations can result in erroneous estimates of the number of irrigated acres. Adjustments to the number and location of irrigated areas can account for year-to-year variations in the climate and the associated changes in the number of irrigated acres; however, these approaches may not be universally applicable. There are socioeconomic and crop-choice variations that affect the number of irrigated acres, and these factors are not represented when only correcting for variations in the climate. The CDL for 2015 was used by some States to modify the incongruent dates between the USDA data and the 2015 compilation year, but this approach was not enacted by all States that use USDA products. The USDA has restrictions on what data are released to the public because they are required to ensure that individual farmer information is not disclosed, which can cause an underestimation of irrigated-acres information. Based on the WSC documentation, it is unclear if WSCs modified estimates based on possible undisclosed irrigated-acres information.
Uncertainty in the source (surface water or groundwater) of irrigation water is another cause for potential errors in the 2015 compilation data. For many States, the volume of water, by source, was determined using the same ratio per county or State as was used in previous USGS compilations. The original date for when those ratios were determined is not in all WSC documentation. While this method is relatively accurate from year to year, in some places it might be incorrect, depending on when the water-source data were collected or estimated and what the total volume of available surface water and groundwater was during 2015. For example, in California, a water source type could change due to water availability because groundwater is often used to supplement surface-water shortfalls. This circumstance is also true for some farming activities that have permitted withdrawals reported to State agencies. Permits can include several wells and surface-water intakes, and reported values are taken from the permit and not from individual well or surface-water diversion. These types of water-rights results can lead to complex variations in the fractions of surface-water and groundwater withdrawals.
Withdrawal estimates made using indirect methods can be uncertain due to the necessary assumptions made for those estimations. The crop water-requirement method used crop-specific application rates developed prior to 2015. In this method, crop-specific application rates are uniformly used to estimate water use for many fields that could have different water demands. These water demands are dependent on factors other than crop type and can vary across fields and years. This approach does not consider localized spatial variability in water requirements related to the timing of rainfall events and crop-growth phases, nor the socioeconomic characteristics related to the individual farming operation for 2015. The WSC documentation for Missouri showed that withdrawals estimated using crop water requirements were modified because 2015 rainfall was above average. Other States modified water-withdrawal estimates to account for average annual precipitation, but not all States used this approach. Climate adjustments were constant for States and did not incorporate the spatial variabilities within individual States. The remotely sensed ETa and modeling approaches attempted to capture the timing and location of rainfall events for 2015 and include crop-specific water requirements when calculating estimates of withdrawals.
Resolving the difference between the crop water requirements and the irrigation-withdrawal quantity is another source of uncertainty in the irrigation water-use estimates. Irrigation-system and conveyance efficiencies were not always considered for 2015 estimates of withdrawals and consumptive use. Several information sources were used to identify irrigation efficiencies. In most cases, the same percentage was applied to the entire State, which may not represent the spatial variability of the system efficiencies. Only six States estimated conveyance losses; conveyance efficiencies can more significantly affect estimates of withdrawals than the crop type does, and the latter was considered for many States. There are places where water-management strategies allow for water withdrawn in one county to be transported for use in other counties. The total quantity of water lost during this transport is probably not captured in the water-use estimates for 2015. The conveyance efficiency is highly variable and depends on factors that are not well understood. Common sources of conveyance loss include evaporation, canal overflow, and seepage loss through the canals or pipelines. Insufficient data for conveyance-efficiencies estimates are a significant source of uncertainty in irrigation water-use estimates.
Irrigation withdrawals reported by volume show spatial variability (fig. 1); however, in addition to real variations in water use, this variability may be due to the resolution of the datasets used to make these estimates. Farming and irrigation patterns vary locally and across county and State lines. Abrupt changes in irrigation water-use components at State lines could be caused by the State-specific datasets used to estimate water use (fig. 2 and fig. 6).
Summary
Compiling the information sources and methods used to estimate irrigation water use for the 2015 USGS water-use compilation is necessary for interpreting these estimates. The unpublished WSC documentation identified the sources of information and methods used to locate and quantify the number of irrigated acres, total water withdrawals, consumptive use, and proportioning withdrawals by water source type. Irrigation-efficiencies information, according to irrigation system type and conveyance, were incorporated into total-withdrawals data for the Nation. Although the best available information was used to produce estimates at the State and county scale, the same sources of information were not used universally. Therefore, the estimates are not fully comparable from one part of the Nation to another. Methods that relied on consistent information sources to estimate irrigation water use would improve the overall confidence level in the ability of these estimates to capture the true spatial variability inherent to irrigation water needs.
References Cited
Allen, R. G., Pereira, L. S., Raes, D., and Smith, M., 1998, Crop evapotranspiration—Guidelines for computing crop water requirements: Rome, FAO [Food and Agriculture Organization of the United Nations], Irrigation and drainage paper 56, 300 p. [Also available at http://www.fao.org/3/X0490E/x0490e00.htm#Contents.]
Avery, C., 1999, Estimated water withdrawals and use in Illinois, 1992: U.S. Geological Survey Open-file Report 99–97, 49 p., accessed June 30, 2017, at https://doi.org/10.3133/ofr9997.
Bear River Basin Planning Team, 2000, Appendix H—Spreadsheet modeling support—Efficiencies and return flow patterns: Wyoming Water Development Office technical memorandum, 8 p., accessed February 20, 2017, at https://waterplan.state.wy.us/plan/bear/2001/techmemos/efficient.html.
Blaney, H.F., and Criddle, W.D., 1962, Determining consumptive use and irrigation water requirements: U.S. Department of Agriculture Technical Bulletin 1275, 59 p. [Also available at https://hdl.handle.net/2027/uva.x030348653.]
Cuenca, R.H., 1992, Oregon Crop Water Use and Irrigation Requirements: Corvallis, Oreg., Oregon State University Extension Service, Extension Miscellaneous 8530, 182 p., accessed July 14, 2017, at https://catalog.extension.oregonstate.edu/sites/catalog/files/project/pdf/em8530.pdf. [Reprinted in March 1999.]
Dastane, N.G., 1978, Effective rainfall in irrigated agriculture: Rome, FAO [Food and Agriculture Organization of the United Nations], FAO Irrigation and Drainage Paper 25, 62 p., accessed April 20, 2020, at http://www.fao.org/3/x5560e/x5560e00.htm.
Dickens, J.M., Forbes, B.T., Cobean, D.S., and Tadayon, S., 2011, Documentation of methods and inventory of irrigation data collected for the 2000 and 2005 U.S. Geological Survey estimated use of water in the United States, comparison of USGS-compiled irrigation data to other sources, and recommendations for future compilations: U.S. Geological Survey Scientific Investigations Report 2011–5166, 60 p., accessed February 4, 2020, at https://doi.org/10.3133/sir20115166.
Dieter, C.A., Maupin, M.A., Caldwell, R.R., Harris, M.A., Ivahnenko, T.I., Lovelace, J.K., Barber, N.L., and Linsey, K.S., 2018, Estimated use of water in the United States in 2015: U.S. Geological Survey Circular 1441, 65 p., accessed February 4, 2020, at https://doi.org/10.3133/cir1441.
Engott, J.A., Johnson, A.G., Bassiouni, M., Izuka, S.K., and Rotzoll, K., 2017, Spatially distributed groundwater recharge for 2010 land cover estimated using a water-budget model for the Island of O‘ahu, Hawai’i (ver. 2.0, December 2017): U.S. Geological Survey Scientific Investigations Report 2015–5010, 49 p., accessed November 6, 2017, at https://doi.org/10.3133/sir20155010.
Environmental Institute for Golf, 2009, Golf course environmental profile volume II—Water use and conservation practices on U.S. Golf Courses: Lawrence, Kans., Environmental Institute for Golf, Golf Course Superintendents Association of America, 49 p., accessed July 14, 2017 at https://www.gcsaa.org/uploadedfiles/Environment/Environmental-Profile/Water/Golf-Course-Environmental-Profile--Water-Use-and-Conservation-Report.pdf.
Georgia Environmental Protection Division, 2008, Georgia comprehensive State-wide water management plan: Atlanta, Ga., Georgia Environmental Protection Division, Georgia Water Council, 39 p. [Also available at https://waterplanning.georgia.gov/document/publication/state-water-plan/download.]
Honig, L., [2020], Use of FSA acreage data: Washington, D.C., Department of Agriculture [memorandum], 1 p., accessed February 26, 2020, at https://www.nass.usda.gov/Education_and_Outreach/Understanding_Statistics/FSA_Acreage.pdf.
Howell, T.A., 2003, Irrigation efficiency, in Stewart, B.A., and Howell, T.A., eds., Encyclopedia of water science: New York, Marcel‑Dekker, p. 467–472, accessed November 17, 2017 at https://www.researchgate.net/profile/Terry_Howell4/publication/43256707_Irrigation_Efficiency/links/566ec91c08aea0892c52a91c/Irrigation-Efficiency.pdf.
Irmak, S., Odhiambo, L.O., Kranz, W.L., and Eisenhauer, D.E., 2011, Irrigation Efficiency and Uniformity, and Crop Water Use Efficiency: Biological Systems Engineering—Papers and Publications, no. 451, accessed June 29, 2017, at https://digitalcommons.unl.edu/biosysengfacpub/451.
Johnson, A.G., Engott, J.A., Bassiouni, M., and Rotzoll, K., 2018, Spatially distributed groundwater recharge estimated using a water-budget model for the Island of Maui, Hawai’i, 1978–2007 (ver. 2.0, February 2018): U.S. Geological Survey Scientific Investigations Report 2014–5168, 53 p., accessed November, 6, 2017, at https://doi.org/10.3133/sir20145168.
King, L.D., Wensink, R.B., Wolfe, J.W., and Shearer, M.N., 1977, Energy and water consumption of the Pacific Northwest irrigation systems: U.S. Energy Research and Development Administration Technical Report BNWL–RAP–19, 159 p., accessed July 14, 2017, at https://doi.org/10.2172/5023972.
Marella, R.L., Dixon, J.F., and Berry, D.R., 2016, Agricultural irrigated land-use inventory for the counties in the Suwannee River Water Management District in Florida, 2015: U.S. Geological Survey Open-File Report 2016–1111, 18 p., accessed May 1, 2017, at https://doi.org/10.3133/ofr20161111.
Marella, R.L., and Dixon, J.F., 2015, Agricultural irrigated land-use inventory for Jackson, Calhoun, and Gadsden Counties in Florida, and Houston County in Alabama, 2014: U.S. Geological Survey Open-File Report 2015–1170, 14 p., accessed May 1, 2017, at https://doi.org/10.3133/ofr20151170.
New Mexico Office of the State Engineer, 2015, New Mexico water use by categories 2015: New Mexico Office of the State Engineer Technical Report 55, prepared by Magnuson, M.L., Valdez, J.M., Lawler, C.R., Nelson, M., and Petronis, L., 126 p. [Also available at https://www.ose.state.nm.us/WUC/wucTechReports/2015/pdf/2015%20WUR%20final_05142019.pdf.]
Painter, J.A., Caldwell, R.R., Brandt, J., Haynes, J.V., and Read, A.L., 2021, 2015 calendar-year county-level estimates of actual evapotranspiration for the conterminous United States and Hawaii: U.S. Geological Survey data release, https://doi.org/10.5066/P9O1TMR6.
Pervez, M.S., and Brown, J.F., 2010, Mapping irrigated lands at 250-m scale by merging MODIS data and national agricultural statistics: Remote Sensing, v. 2, no. 10, p. 2388–2412, accessed March 28, 2017, at https://doi.org/10.3390/rs2102388.
Senay, G.B., Bohms, S., Singh, R.K., Gowda, P.H., Velpuri, N.M., Alemu, H., and Verdin, J.P., 2013, Operational evapotranspiration mapping using remote sensing and weather datasets—A new parameterization for the SSEB approach: Journal of the American Water Resources Association, v. 49, no. 3, p. 577–591, accessed March 28, 2017, at https://doi.org/10.1111/jawr.12057.
Shaffer, K.H., and Runkle, D.L., 2007, Consumptive water-use coefficients for the Great Lakes Basin and climatically similar areas: U.S. Geological Survey Scientific Investigations Report 2007–5197, 191 p., accessed July 24, 2017, at https://doi.org/10.3133/sir20075197.
Solomon, K.H., 1988, Irrigation systems and water application efficiencies: CATI publication, no. 880104, 6 p., accessed March 30, 2017, at http://wateright.net/ResearchPublications/880104.
Torak, L.J., and Painter, J.A., 2011, Summary of the Georgia Agricultural Water Conservation and Metering Program and evaluation of methods used to collect and analyze irrigation data in the middle and lower Chattahoochee and Flint River basins, 2004–2010: U.S. Geological Survey Scientific Investigations Report 2011–5126, 35 p. [Also available at https://doi.org/10.3133/sir20115126.].
Torak, L.J., and Painter, J.A., 2013, Geostatistical estimation of growing season irrigation rates using monthly metered data, middle-to-lower Chattahoochee-Flint River Basin, Southwestern Georgia., in Clarke, J.S., and Dalton, M.J., comps., Hydrologic monitoring and selected hydrologic and environmental studies by the U.S. Geological Survey in Georgia, 2011–2013: U.S. Geological Survey Open-File Report 2013–1278, p. 63–68. [Also available at https://doi.org/10.3133/ofr20131278.]
U.S. Department of Agriculture, Farm Service Agency, 2020a, Common land unit (CLU) web page: U.S. Department of Agriculture website, accessed February 25, 2020, at https://www.fsa.usda.gov/programs-and-services/aerial-photography/imagery-products/common-land-unit-clu/index.
U.S. Department of Agriculture, Farm Service Agency, 2020b, Crop acreage data web page: U.S. Department of Agriculture website, accessed February 26, 2020, at https://www.fsa.usda.gov/news-room/efoia/electronic-reading-room/frequently-requested-information/crop-acreage-data/index.
U.S. Department of Agriculture, National Agricultural Statistics Service, 2014, 2012 Census of Agriculture—Farm and ranch irrigation survey (2013): U.S. Department of Agriculture, Census of Agriculture, vol. 3, Special studies, pt. 1, 266 p., accessed April 25, 2017, at https://www.nass.usda.gov/Publications/AgCensus/2012/Online_Resources/Farm_and_Ranch_Irrigation_Survey/.
U.S. Department of Agriculture, National Agricultural Statistics Service, [2016], National CDL [cropland data layer] for 2015: U.S. Department of Agriculture website, accessed February 20, 2020, at https://www.nass.usda.gov/Research_and_Science/Cropland/Release/index.php.
U.S. Department of Agriculture, National Agricultural Statistics Service, 2019a, Census of agriculture methodology, app. A of 2017 census of agriculture—United States summary and State data: U.S. Department of Agriculture, v. 1, pt. 51, Geographic area series, 25 p., accessed April 7, 2020, at https://www.nass.usda.gov/Publications/AgCensus/2017/Full_Report/Volume_1,_Chapter_1_US/usappxa.pdf.
U.S. Department of Agriculture, National Agricultural Statistics Service, 2019b, Statistical methodology, app. A of 2017 census of agriculture—2018 Irrigation and water management survey: U.S. Department of Agriculture, v. 3, pt. 1, Special studies series, 8 p., accessed April 7, 2020, at https://www.nass.usda.gov/Publications/AgCensus/2017/Online_Resources/Farm_and_Ranch_Irrigation_Survey/appxa.pdf.
U.S. Department of Agriculture, National Agricultural Statistics Service, 2020a, Census of Agriculture web page: U.S. Department of Agriculture website, accessed April 7, 2020, at https://www.nass.usda.gov/AgCensus/.
U.S. Department of Agriculture, National Agricultural Statistics Service, 2020b, CropScape and Cropland Data Layers—FAQs in National Agricultural Statistics Service, Research and Science web page: U.S. Department of Agriculture website, accessed April 7, 2020, at https://www.nass.usda.gov/Research_and_Science/Cropland/sarsfaqs2.php.
U.S. Department of Agriculture, National Agricultural Statistics Service, 2020c, Nevada Field Office (part of the Pacific Regional Field Office)—Annual Statistical Bulletin web page: U.S. Department of Agriculture website, accessed April 7, 2020, at https://www.nass.usda.gov/Statistics_by_State/Nevada/Publications/Annual_Statistical_Bulletin/index.php.
U. S. Department of Agriculture, Soil Conservation Service, 1976, Water conservation and salvage report for Montana: Bozeman, Mont., U. S. Department of Agriculture, 75 p. [Also available at https://archive.org/details/CAT77681789/page/n1/mode/2up.]
U.S. Geological Survey, 2014, National Land Cover Database (NLCD)—2011: U.S. Geological Survey website, accessed March 28, 2017, at https://www.sciencebase.gov/catalog/item/53715219e4b07ccdd78bad4a.
U.S. Geological Survey, [2020], Water-use terminology: U.S. Geological Survey website, accessed April 6, 2020, at https://www.usgs.gov/mission-areas/water-resources/science/water-use-terminology?qt-science_center_objects=0#qt-science_center_objects.
Waltz, C., 2008, Research update—Evaluation of the GGCSA BMPs: Athens, Ga., University of Georgia, 4 p., accessed March 30, 2018, at http://cdn.cybergolf.com/images/994/Research-Update---BMPs-_01-08_.pdf.
Westenbroek, S.M., Kelson, V.A., Dripps, W.R., Hunt, R.J., and Bradbury, K.R., 2010, SWB—A modified Thornthwaite-Mather Soil-Water Balance code for estimating groundwater recharge: U.S. Geological Survey Techniques and Methods, book 6, chap. A31, 60 p., accessed July 24, 2017, at https://doi.org/10.3133/tm6A31.
Appendix 1. Information Sources and Method Summaries by State for Estimating Irrigation Water Use for the 2015 U.S. Geological Survey Water-Use Compilation
Alabama
The Lower Mississippi-Gulf WSC estimated crop acreages for Alabama using data from the U.S. Department of Agriculture (USDA) National Agricultural Statistics Service (NASS) 2012 Census of Agriculture. The number of irrigated acres were estimated using county-reported acres by crop type from the USDA–NASS Census of Agriculture 2012. Irrigated-acres data from the Census of Agriculture were adjusted for some counties based on data assembled by the University of Alabama-Huntsville (UAH). UAH determined irrigated acreages by making geographic information system (GIS) based estimates of center-pivot irrigated acreage. Total water withdrawals, including pasture and horticulture, were estimated using locally determined crop-specific application rates and multiplying those rates by the number of previously determined irrigated acres. Consumptive-use values for crop irrigation were estimated to equal withdrawals. Water-source was determined using previous compilations (2005 and 2010). Sprinkler irrigation is the only system-type estimated. Reclaimed wastewater is not a known water source type for agriculture. Golf course irrigation values were estimated and reported separately using coefficients based on survey data from the Alabama Department of Economic Affairs, Office of Water Resources.
Alaska
The Alaska Science Center estimated crop acreages and the number of irrigated acres from census data provided by the USDA–NASS 2012 Census of Agriculture. Total water-withdrawals values, including horticulture (pastures are not irrigated in Alaska), were estimated using historical irrigation rates to determine withdrawals based on the updated number of irrigated acres from the 2003 Irrigation and Water Management Survey (IWMS). Irrigation system efficiencies and conveyance losses were not considered when estimating withdrawals. Consumptive-use values were estimated as 90 percent of the estimated withdrawals. The water-source was determined to be entirely groundwater, based on historically collected data. Reclaimed wastewater is not a known source of water for irrigation in Alaska. Golf course irrigation values were estimated and reported separately from crop irrigation values using historical irrigation rates and the number of golf course acres.
Arizona
The Arizona WSC estimated crop acreage using data from polygons digitized from National Aerial Imagery Program (NAIP) imagery. The number of irrigated acres were estimated by crop type and summed by county using the 2015 Cropland Data Layer (CDL) and field visits. Total water-withdrawals values, including pasture and horticulture, were estimated using the information on reported withdrawals from the Arizona Department of Water Resources and the Arizona Irrigation and Drainage Districts, consumptive-use estimates, irrigation system-efficiency data, and the number of cropped acres. Irrigation-system and conveyance-efficiencies data were estimated based on research from the USDA and field observations. Consumptive water-use requirement rates for crops were determined using a modified Blaney-Criddle method, as described in the Bureau of Reclamation (1992, appendix A). The water source type was determined using reported diversions for surface-water and well registration records. Data on reclaimed wastewater used for agriculture were estimated using reported information from the Arizona Irrigation and Drainage Districts. Golf course irrigation values were estimated and reported separately using data on golf course acreages and consumptive use by grass.
Arkansas
The Lower Mississippi-Gulf WSC estimated the number of crop acres and irrigated acres using site-specific information from the Arkansas Water-Use Database (WUDB). Total water-withdrawal values, including pastures and horticulture, were estimated using the site-specific data from the WUDB. The information in the WUDB includes both measured data and estimates of water withdrawals made by water users during the annual reporting requirement. Irrigation system-type data were included in the WUDB database, and irrigation-system efficiencies and conveyance losses were not considered when estimating withdrawals. The water source type was determined using information in the WUDB. Reclaimed wastewater is not a known source of water for irrigation in Arkansas. Golf course irrigation data were estimated and not reported separately because they use data from the WUDB.
California
The California WSC estimated the number of crop acres using information from the California Department of Water Resources (CADWR), the California Department of Conservation, the Division of Land Resource Protection, the Farmland Mapping and Monitoring Program (FMMP), and the USGS Earth Resources Observation and Science (EROS) Center. The CADWR periodically conducts inventories of irrigated lands for most counties about once every 10 years. The data inventory used for this effort was conducted between 1993 and 2015. For counties with no applicable irrigated land-use data available, irrigated-lands data from the FMMP and the USGS MODIS Irrigated Agriculture Dataset (MIrAD–US) were used to fill spatial gaps. The number of crop acres was then compared to the NAIP imagery from 2014 to visually identify and remove areas converted to urban or other nonirrigated land-use types. The tabulated county sums of irrigated land (including pasture and horticulture) were then qualitatively compared with total irrigated-land data from USDA County Agriculture Commissioner reports for 2014 and found comparable.
Operational Simplified Surface Energy Balance (SSEBop) estimates of actual evapotranspiration (ETa) were used with the irrigated-acreage data and annual precipitation data from the National Oceanic and Atmospheric Administration (NOAA) to compute consumptive use. Total water withdrawals were calculated using irrigation-system survey data from the CADWR, and application-efficiency information, by irrigation system type, from the University of California–Davis Water Management Research Group. The water source type was determined using a combination of surface-water diversion data compiled by the California WSC and aggregated Bureau of Reclamation surface-water delivery data. The difference between the total water-withdrawals estimates and surface-water delivery estimates were identified as groundwater withdrawals. Irrigation system-type data indicated that 18 percent of irrigated acres are equipped with sprinkler systems, 38 percent with micro-irrigation systems, and 44 percent with flood systems. Information on reclaimed wastewater used for agriculture were from the California State Water Resources Control Board survey. Consumptive-use and withdrawal values for golf courses were estimated separately from crop-irrigation values using survey results published by the Golf Course Superintendent’s Association of America (GCSAA) (https://www.gcsaa.org/).
Colorado
The Colorado WSC estimated crop acreages using data from field verifications conducted by the Colorado Department of Water Resources (CDWR). The number of irrigated acres were provided by CDWR via an irrigated-acreage polygon dataset created from field visits in 2010 and 2015 and summed by county. The CDWR HydroBase dataset (https://cdss.colorado.gov/software/hydrobase) contains monthly surface-water diversion and groundwater withdrawals values based on a combination of reported and metered data. Total water-withdrawal values, including pastures and horticulture, were estimated by the number and type of crops planted in 2010 and 2015, the CDWR irrigated-acreage spatial dataset, and crop coefficients for water demand from the CDWR Colorado Decision Support System (CDSS; https://cdss.colorado.gov/). Irrigation system-type information was provided by the CDWR. Irrigation-system efficiencies and conveyance losses were not considered when estimating withdrawals values. Consumptive-use values were estimated by SSEBop modeled ETa data in combination with a dry-land correction factor. The water-source was determined from information in the CDSS. Reclaimed wastewater is not a known source of water for irrigation in Colorado. Golf course irrigation values were estimated separately from crop-irrigation values using information from the CDWR.
Connecticut
The New England WSC estimated crop acreages and the number of irrigated acres using the USDA–NASS 2012 Census of Agriculture. The number of irrigated acres was estimated using the USDA–NASS 2012 Census of Agriculture county-acres totals and the USDA–NASS 2015 CDL distribution of crops. Total water-withdrawal values were estimated from the irrigation rates produced as outputs from a USGS Soil-Water Balance (SWB) model (Westenbroek and others, 2010.) The irrigation rates were multiplied by the number of irrigated acres and adjusted upwards by 5 percent to account for system and conveyance inefficiencies (Shaffer and Runkle, 2007). Irrigation system-type data were considered consistent with previous compilations. Consumptive-use values were estimated using the SWB estimates of ETa for each crop and summarized by county. The water source type was determined using historically accepted county divisions of surface water and groundwater. Reclaimed wastewater is not a known source of water for irrigation in Connecticut. Golf course irrigation values were estimated and reported separately using the Homeland Security Infrastructure Program (HSIP) Gold 2015 database and data from Massachusetts.
Delaware
The Maryland, Delaware, and District of Columbia WSC estimated crop-acreage and the number of irrigated acres using a polygon data layer from the University of Delaware agriculture department. Total water-withdrawal values, including pastures, were estimated using the SSEBop estimates of ETa, multiplied by the number of irrigated acres and adjusted based on growing season length. Irrigation system efficiencies and losses were not estimated. Irrigation system-type information was provided by the Delaware Department of Natural Resources and Environmental Control. Consumptive-use values were estimated using ETa for each crop and summarized by county. The water source type was determined by using information from the Delaware Extension Service; 85 percent of irrigation is sourced by groundwater. Reclaimed wastewater is not a known source of water for irrigation in Delaware. Golf course irrigation values were estimated and reported separately from crop irrigation using a coefficient multiplied by the estimated number of golf course facilities in a county.
District of Columbia
The Maryland, Delaware, and District of Columbia WSC reported no crop-irrigation values, as there is no agriculture in the District of Columbia area. The only irrigation is for golf courses. The number of golf course irrigated acres were reported by the golf courses. The total water-withdrawal values for golf courses were estimated from the public supply deliveries made by the Washington Aqueduct and the land acreage of the golf courses. Irrigation-system efficiencies and conveyance losses were not estimated. The water source type is exclusively surface water from the Potomac River through the Washington Aqueduct. Reclaimed wastewater is not a known source of water for irrigation in the District of Columbia.
Florida
The Caribbean-Florida WSC estimated the number of crop-acres, irrigation system type, source of water, and total withdrawal values using information from various State water management districts (WMD), USGS reports, and the Balmoral Group (https://www.balmoralgroup.us/). The number of irrigated acres were estimated using a series of land-use maps prepared by the WMDs and recent satellite imagery. Crop coefficients were developed using selected irrigation-demand models and calibrated with metered data provided annually by the WMDs. Total water-withdrawal values, including those for pastures and horticulture, were also obtained from the State WMDs. Irrigation-system efficiencies were considered when estimating consumptive-use values. Sprinkler efficiency values were estimated at 70 percent, surface systems at 50-percent efficient, and micro-irrigation systems at 80-percent efficient. Values of reclaimed wastewater used for agriculture were estimated using information from the Florida Department of Environmental Protection, Domestic Wastewater Division. Golf course irrigation values were estimated and reported separately using information from State WMDs.
Georgia
The South Atlantic WSC estimated the number of crop acres using information from the Georgia Environmental Protection Division (GaEPD) through the Georgia State Agricultural Water Conservation and Metering Program and the Georgia Statewide Water Plan (Georgia Environmental Protection Division, 2008). The number of irrigated acres was estimated using a permitted agricultural-lands polygon dataset (Georgia Department of Natural Resources, written commun., April 26, 2016) combined with metered-withdrawals data and summed by county. Total water-withdrawal values, excluding pasture information, were estimated primarily using annual metered-withdrawal data. When metered data were unavailable, two approaches were used, each dependent on the location within the State. Geostatistical techniques described in Torak and Painter (2011, 2013) were used in south Georgia, and water-use forecasts from the Georgia Statewide Water Plan were used in north Georgia. Irrigation system-type information was provided in the agricultural lands polygon dataset. Irrigation-system efficiencies and conveyance losses were not estimated but are assumed to be negligible because of the extensive use of low-pressure center-pivot and micro-irrigation systems that are primarily sourced by groundwater. Consumptive-use values for crop irrigation were estimated to equal withdrawals. The water source type was determined using farm permits issued by the GaEPD. Reclaimed wastewater is not a known source of water for irrigation in Georgia. Golf course irrigation values were estimated and reported separately from crop-irrigation values using information from farm permits and nonfarm withdrawal permits managed by the GaEPD and from irrigation-demand computations developed in partnership with the GaEPD, the Georgia Golf Course Superintendents Association, and the University of Georgia for the Georgia Statewide Water Plan (Waltz, 2008).
Hawaii
The Pacific Islands WSC estimated the number of crop-acres using the Statewide Agricultural Land Use Baseline (SALUB) 2015 dataset (https://hdoa.hawaii.gov/salub/). The number of irrigated acres and irrigation system-type information was determined using the SALUB and then summed by county. Total water-withdrawals values, including horticulture, were estimated using a demand-based calculation from a daily water-balance model. Irrigation system-efficiencies and conveyance-losses values were based on water budget reports (Engott and others, 2017; Johnson and others, 2018). Consumptive-use values were estimated using a coefficient derived from information on system efficiencies, irrigated acres, and crop types. The water source type was determined by using information from the State of Hawaii, which indicated that 95 percent of irrigation water needs are met with groundwater. Surface-water withdrawal values were calculated by subtracting the groundwater withdrawals and precipitation values from the total crop-water demand numbers. Reclaimed wastewater is not a known source of water for irrigation in Hawaii. Golf course irrigation values were estimated and reported with crop-irrigation values. A historical irrigation-application rate of 1 million gallons per day per 200 acres and the total number of reported golf course acres were used to estimate golf course irrigation water-use values.
Idaho
The Idaho WSC estimated the number of crop acres using information from the USDA–NASS 2012 Census of Agriculture and 2015 CDL. The number of irrigated acres were estimated by summing the number of acres per crop type per county from the USDA data. Total water-withdrawal values, excluding pastures and horticulture, were estimated using AgriMet data for crop-irrigation requirements and effective-precipitation calculations (https://www.usbr.gov/pn/agrimet/general.html). Irrigation system-efficiency estimates were determined using coefficients and system-type information that originated from the 2010 USGS compilation. Conveyance loss was not estimated. Consumptive-use values were estimated using the SSEBop estimates of ETa (Senay and others, 2013; data in Painter and others, 2021). The water-source type was determined using water rights and surface-water diversion data obtained from the Idaho Department of Water Resources. Irrigation system-type data indicated that 68 percent of irrigated acres are equipped with sprinkler systems, 32 percent with flood systems, and less than 1 percent with micro-irrigation (drip) systems. Reclaimed wastewater is not a known source of water for irrigation in Idaho. Golf course irrigation values were estimated and reported separately using information from the Idaho Golf Course Association.
Illinois
The Central Midwest WSC compiled the number of irrigated acres, principally from (1) the USDA Farm Service Agency (FSA) 2015 crop acreage dataset, (2) irrigated crop-acreages information from a polygon GIS dataset of center-pivot locations provided by the Illinois State Water Survey (https://www.isws.illinois.edu/), and (3) the USDA–NASS irrigated-acreage data from the 2012 Census of Agriculture. All irrigated acres were assumed to be supplied from groundwater unless the use of surface water was reported in the 2000 compilation. This decision was based on information from USDA–NASS, which has been used as the basis for determining the number of acres irrigated by surface water since the 2000 compilation (Jim Burt, written commun., March 2002). The State total for irrigated acreages by irrigation-system type was obtained from the 2012 Census of Agriculture and the 2013 IWMS, which indicated that about 97 percent of the State was irrigated with sprinkler systems. Since county-level irrigation-system data were unavailable, sprinkler systems were designated for all counties.
Reported withdrawal data were only available from local sources in three counties. Withdrawal values for most of the remaining counties were estimated by the rainfall-deficit method presented in “Estimated Water Withdrawals in Illinois, 1992” (Avery, 1999). The rainfall deficit for each county was determined through weekly rainfall data compiled from daily records, primarily from the NOAA National Weather Service (NWS) rain gages in each county. Rainfall deficits were determined for May 2015 (first full week, beginning May 4) through August 2015 (last full week, ending August 30). The method assumes that all irrigated crops require 1.25 inches of rainfall per week. Total irrigation-withdrawal values in each county, including pasture, were the product of the rainfall-deficit values (application rate) and irrigated-acreage numbers. Consumptive-use values were set as equal to withdrawal values in all counties in which the rainfall-deficit method was used to calculate withdrawals, as it was considered that nearly all the provided moisture was consumed by ET. Consumptive-use values for the three counties with reported withdrawals were calculated using SSEBop ETa estimates (Senay and others, 2013; data in Painter and others, 2020). Reclaimed wastewater used for agriculture was estimated using reported data from agriculture operations. Golf course irrigation data were estimated primarily through the rainfall-deficit method with some reported withdrawals.
Indiana
The Ohio-Kentucky-Indiana WSC estimated the number of crop acres using information from the Indiana Department of Natural Resources (INDNR). The number of irrigated acres were reported by the USDA–NASS 2012 Census of Agriculture and summed by county. Total water-withdrawal values, excluding pastures and horticulture, were reported by the INDNR Division of Water. Irrigation system-type information from the 2013 IWMS indicated 100 percent of irrigation systems are sprinkler systems for Indiana. Irrigation-system efficiencies and conveyance losses were not estimated. Consumptive-use values were estimated using the SSEBop estimates of ETa (Senay and others, 2013; data in Painter and others, 2021). The water-source type was provided by INDNR. Reclaimed wastewater is not a known source of water for irrigation in Indiana. Golf course irrigation values were estimated and reported separately from crop irrigation using information from the INDNR.
Iowa
The Central Midwest WSC used reported irrigated-acres data and irrigation-withdrawal values by source (groundwater and surface water) from the Iowa Department of Natural Resources (IADNR) Water Allocation Compliance and Online Permitting (WACOP) database (https://www.iowadnr.gov/Environmental-Protection/Water-Quality/Water-Supply-Engineering/Water-Allocation-Use) or through the IADNR online search engine (https://programs.iowadnr.gov/wateruse/Search.aspx). The WACOP database stores the agriculture-operation location (township, range, and section) along with the environmental and historical information on all of Iowa’s water-use permits, which are required of any person or entity that withdraws over 25,000 gallons in 24 hours during a calendar year. The irrigation system-type information from the IADNR indicated that sprinkler systems were associated with all irrigated lands. Consumptive-use values were calculated by multiplying the total withdrawal values by 0.80 (80-percent efficiency), based on the assumed use of sprinkler irrigation and the associated efficiency estimates found in Howell (2003). Reclaimed wastewater is not a known source of water for irrigation in Iowa. Irrigation-withdrawal values for pastures were not included in estimates, and estimated values of golf course irrigation withdrawal and consumptive use were determined and reported separately from crop irrigation.
Kansas
The Kansas WSC estimated the number of irrigated-crop acres, determined water source types, and identified crop type and irrigation system type using information from the Kansas Department of Agriculture, Division of Water Resources (KADWR) water-use reports, which are based on annual reports submitted by individual water-right owners and incorporated into KADWR’s Water Rights Information System (WRIS). Total water-withdrawal values (at point of diversion), including pastures and horticulture, were provided by KADWR. Irrigation-system efficiencies and conveyance loss were not estimated. Consumptive-use values were estimated using KADWR provided withdrawal values and SSEBop estimates of ETa (Senay and others, 2013; data in Painter and others, 2021). Irrigation system-type information indicated that 96 percent of irrigated acres were equipped with sprinkler systems, 1 percent with micro-irrigation systems, and 3 percent with surface systems. Information on reclaimed wastewater use for agriculture was obtained from the Kansas Department of Health and Environment for systems permitted to reuse water; however, volumes were unavailable. Golf course irrigation-withdrawal values were reported separately from the information provided in the KADWR water-use reports.
Kentucky
The Ohio-Kentucky-Indiana WSC estimated the number of crop acres and irrigated acres using information from the USDA–NASS 2012 Census of Agriculture tables and the Kentucky Department of Environmental Protection, Division of Water (KDOW). Total water-withdrawal values, excluding pastures, were estimated using irrigated-acreage numbers and an estimated irrigation rate of 0.5 foot per year. Irrigation system-type information was provided by the 2013 IWMS. Irrigation system efficiencies and conveyance loss were not estimated. Consumptive-use values were estimated to be 90 percent of total withdrawals based on Shaffer and Runkle (2007). The water source type was determined using the same statewide ratio of 96-percent surface water and 4-percent groundwater, which are estimated historically. Reclaimed wastewater is not a known source of water for irrigation in Kentucky. Golf course irrigation values were estimated separately from crop-irrigation values using information from KDOW and using 4.11 acres per hole multiplied by a coefficient for water requirements.
Louisiana
The Lower Mississippi-Gulf WSC estimated the number of crop acres using information compiled by the Louisiana Cooperative Extension Service (https://www.lsuagcenter.com) for the 2015 calendar year. Total water-withdrawal values, excluding pastures (and including horticulture when available), were estimated using application-rate information taken from the 2014 Agricultural Water Use Questionnaire, a survey distributed by the Louisiana State University Agricultural Extension Office. The number of irrigated acres from horticultural establishments was not included in the number of irrigated acres estimated. County-level proportions of the total number of irrigated acres associated with each irrigation system type (sprinkler and flood systems) identified for 2015 were consistent with those identified for 2005. Irrigation-system efficiencies and conveyance loss were not considered in estimating withdrawals; however, consumptive-use values were estimated using average irrigation system-type efficiency information from a literature review on geographically similar conditions. The water source was determined using unpublished data provided by Bill Branch, Professor Emeritus, Department of Biological and Agricultural Engineering, Louisiana State University (oral commun., May 4, 2011). Reclaimed wastewater is not a known source of water for irrigation in Louisiana. Golf course irrigation-withdrawal values were not reported.
Maine
The New England WSC estimated the number of crop acres and irrigated acres by using information from the USDA–NASS 2012 Census of Agriculture, with an adjustment to the number of irrigated acres for blueberries, which are considered an underreported crop in USDA products. The number of irrigated acres was summed by county. The total water-withdrawal values, including pastures, were estimated using the USGS SWB model (Westenbroek and others, 2010). For the irrigation-system type, county proportions of irrigated acres were considered consistent with those in the previous compilation. Irrigation system-efficiencies and conveyance-loss values were estimated to be 5 percent of total withdrawals. Consumptive-use values were estimated by using ETa provided by the SWB model. The water source type was determined using historical data. Reclaimed wastewater is not a known source of water for irrigation in Maine. Golf course irrigation values were estimated and reported separately using information from the HSIP Gold 2015 database and the SWB model.
Maryland
The Maryland, Delaware, and District of Columbia WSC estimated the number of crop acres and irrigated acres using the USDA–NASS 2012 Census of Agriculture tables. County total-water withdrawal values, including lawns, parks, and nurseries, were estimated using monthly reported data from the Maryland Department of the Environment (MDE). Irrigation-system types associated with irrigated acreages were determined from the 2013 IWMS. Irrigation systems are considered 95-percent efficient and with minimal loss due to conveyance because the primary source of water is groundwater, as determined through consultation with the University of Maryland and MDE. Consumptive-use values were estimated using SSEBop estimates of ETa (Senay and others, 2013; data in Painter and others, 2021). Reclaimed wastewater is not a known source of water for irrigation in Maryland. Golf course irrigation values were estimated and reported separately from crop-irrigation values using information from MDE.
Massachusetts
The New England WSC estimated the number of crop acres and irrigated acres using information from the USDA–NASS 2012 Census of Agriculture, 2013 IWMS, and 2015 CDL. Acreage by irrigation-system type was determined using the same ratios used in the 2010 compilation. Total water-withdrawal values, excluding horticulture, were estimated using an SWB model (Westenbroek and others, 2010). The resultant rates were then multiplied by the number of irrigated acres and aggregated by county to calculate withdrawal values. Irrigation systems are considered 95-percent efficient with minimal losses due to conveyance. Consumptive-use values were estimated using ETa provided by the SWB model. The water source type was determined using the same county proportions from the 2010 compilation. Reclaimed wastewater is not a known source of water for irrigation in Massachusetts. Golf course irrigation values were estimated and reported separately using modified golf course acreages from the HSIP Gold 2015 database and irrigation rates from the SWB.
Michigan
The Upper Midwest WSC estimated the number of crop acres using reported information from the Michigan Department of Environmental Quality. The number of irrigated acres was estimated using the county-summary information provided by the department and compared to totals in the USDA 2013 IWMS and the 2012 Census of Agriculture. Total water-withdrawal values, including pastures and horticulture, were estimated using the information reported by the Michigan Department of Environmental Quality. The reported information includes both measured data and estimates of water withdrawals made by the water user because of an annual reporting requirement. Irrigation-system types associated with irrigated acres were identified using total statewide values from the 2013 IWMS and the 2012 Census of Agriculture. System efficiencies were not estimated. Consumptive-use values were assessed at 90 percent of total withdrawals (Shaffer and Runkle, 2007). The water source type was determined using information provided by the Michigan Department of Environmental Quality. Reclaimed wastewater is not a known source of water for irrigation in Michigan. Golf course irrigation values were estimated and reported separately from crop-irrigation values.
Minnesota
The Upper Midwest WSC estimated the number of crop acres, determined irrigation-system types and water source types, and estimated withdrawal values based on irrigation permit holders’ self-reported information, which is stored in the Minnesota Department of Natural Resources (MNDNR) Permitting and Reporting System (MPARS). An MNDNR water-appropriation permit is required to irrigate any type of crop if the amount of water appropriated (used) from a groundwater or surface-water source exceeds 10,000 gallons per day or one million gallons per year. Monthly withdrawals data are available from MPARS and include withdrawals data for nurseries and orchards. Withdrawals data for pastures are not included. Consumptive-use values were estimated through multiplying withdrawals by a coefficient based on the irrigation system-efficiencies and conveyance-losses information (70 percent for surface irrigation and 80 percent for sprinkler irrigation). Reclaimed wastewater is not a known source of water for irrigation in Minnesota. Golf course irrigation values were estimated and reported separately from crop irrigation values using data from MPARS.
Mississippi
The Lower Mississippi-Gulf WSC estimated the number of crop acres and irrigated acres using the USDA–NASS tables for most of the State and reported data from the Mississippi Department of Environmental Quality and Yazoo Management District (YMD) for the Delta region of Mississippi. Total water-withdrawal values for most of the State, excluding pastures, were estimated by multiplying the number of irrigated acres by a coefficient (1.04 acre-feet per acre per year) determined from the 2013 IWMS data. Total-withdrawal values for counties in the Delta region were based on a model that uses data on crop type and extent, climate conditions, and ideal water needs by crop type. Irrigation system-type data were assumed to be consistent with previous compilations and were compared to information from the 2013 IWMS for verification. Irrigation system-efficiencies and conveyance-loss values were estimated to be 80 percent for sprinkler irrigation and 75 percent for surface irrigation based on Solomon (1988). Consumptive-use values were estimated by multiplying the total withdrawals by the system-efficiency percentage. The water source type was determined using the same proportions used in 2010. Reclaimed wastewater is not a known source of water for irrigation in Mississippi. Golf course irrigation was not estimated.
Missouri
The Central Midwest WSC estimated the number of crop acres and irrigated acres using information from the USDA–NASS, the 2012 Census of Agriculture, the 2013 IWMS, and the 2015 CDL. Total water-withdrawals values, including pastures and horticultural activities, were estimated using a combination of information from a database of major water users (MWU) from the Missouri Department of Natural Resources and State-level coefficients developed in 2000 based on irrigation system types. These coefficients were multiplied by the number of acres in each county, for each irrigation system, to determine an estimate of withdrawals. The irrigation system type associated with the irrigated acres was determined using information in the 2013 IWMS. Adjustments to those estimated withdrawals were made based on 2015 total rainfall in relation to an average rainfall year (33 percent more rainfall than average) and an estimated runoff coefficient of 0.45 for farmland. The water source type was determined from the MWU database. Irrigation-system efficiencies and conveyance loss were not explicitly estimated but contributed to the irrigation system-type coefficients used in the withdrawal estimates. Reclaimed wastewater is not a known source of water for irrigation in Missouri. Golf course irrigation values are likely included in the MWU data but were not explicitly estimated.
Montana
The Wyoming-Montana WSC used a polygon dataset of irrigated land attributed with acres and irrigation-system type provided by the Montana State Water Plan (Montana Department of Natural Resources and Conservation Water Management Bureau [MTDNRC WMB]). The MTDNRC WMB also provided the percentage of acres within each county irrigated by groundwater (James Heffner, written commun., March 2017); the balance of the irrigated acres in each county was assigned to surface water. Total irrigation-withdrawal values for each county, including pastures, were calculated by dividing the total consumptive use of applied irrigation-water (ETirr) values by the total irrigation efficiency (combined conveyance and irrigation system-type efficiencies) for areas in the polygon irrigated-land dataset. The ETirr values were calculated by subtracting effective precipitation from ETa. Effective precipitation values are based on individual weather-station data processed with the USDA Natural Resources Conservation Service (NRCS) Irrigation Water Requirements (IWR) Program, which ranged from 2.5 to 4.9 inches among counties and averaged 4.0 inches for the State of Montana. ETa estimates for the growing season (April–September 2015) were calculated using the SSEBop model (Senay and others, 2013; data included in Painter and others, 2021). The conveyance efficiency for groundwater-sourced irrigation systems was assumed 100 percent efficient. In contrast, the conveyance efficiency for surface-water sourced systems is between 32 and 96 percent, with a median of 64 percent (U.S. Department of Agriculture, Soil Conservation Service (1976). Surface water is used by both sprinkler and surface-irrigation system types, with average irrigation system-type efficiencies of 50 percent for surface-irrigation systems and approaching 80 percent for sprinkler-irrigation systems. All groundwater-sourced irrigation-system types are sprinklers with an average irrigation system-type efficiency of 77 percent. The overall, combined irrigation efficiency (conveyance and irrigation system) for Montana was about 25 percent. Reclaimed wastewater estimates were not made. Golf course irrigation was not estimated.
Nebraska
The Nebraska WSC estimated the number of crop acres using information provided by the Nebraska Natural Resource Districts and the output from the USGS Northern High Plains Groundwater Availability Study’s SWB model. The number of irrigated acres were estimated using a polygon dataset from the Center for Advanced Land Management Information Technologies for acres under center-pivot irrigation and other irrigated acres. Total water-withdrawal values were estimated using reported data, SWB model outputs, and extrapolated estimates using reported data for irrigated areas outside of reported withdrawals or the SWB model extent. Irrigation-system efficiencies were not estimated. Consumptive-use values were estimated using the results of the SWB model. Reclaimed wastewater is not a known source of water for crop irrigation in Nebraska. Golf course irrigation values were estimated and reported with crop-irrigation values using information from the GCSAA water-use report and groundwater-wells information from the Nebraska Department of Natural Resources. It was assumed that a golf course would irrigate using either municipal water or a well but not direct surface water. The irrigation application rates from the GCSAA report were multiplied by the number of course acres to estimate groundwater-withdrawal values for golf courses.
Nevada
The Nevada WSC estimated the number of crop acres from the USDA 2012 Census of Agriculture and field-checked crop inventories from the Nevada Department of Water Resources (NDWR). The number of irrigated acres were estimated by using the irrigated-cropland values reported in the 2015 USDA–NASS Annual Statistical Bulletin (https://www.nass.usda.gov/Statistics_by_State/Nevada/Publications/Annual_Statistical_Bulletin/index.php). Total water-withdrawal values, including horticulture, were estimated using NDWR and USDA crop inventories and application rates per crop with a county-level average application rate of 3.42 feet. The irrigation-system type associated with the irrigated acreages was determined using information from the NDWR, the 2010 compilation, and the 2015 Annual Statistical Bulletin. Irrigation system-efficiencies data were determined from literature compiled by the NDWR (sprinkler, 80 percent; micro-irrigation, 80 percent; and surface, 70 percent); conveyance losses were not estimated. Consumptive-use values were calculated from application rates, acreages, crop types, and system-efficiency information. The water source type was determined using historical information. Data on reclaimed wastewater used for agriculture were estimated using historical information. Golf course irrigation values were estimated and reported separately from crop-irrigation values using data from the NDWR and GOLFNOW (https://www.golfnow.com).
New Hampshire
The New England WSC estimated crop acreages and the number of irrigated acres using the USDA 2012 Census of Agriculture, 2013 IWMS, and 2015 CDL. Acreage values by irrigation-system type were determined using the same ratios used in the 2010 compilation. Total water-withdrawal values, excluding horticulture, were estimated using an SWB model (Westenbroek and others, 2010). These rates were multiplied by the number of irrigated acres and aggregated by county to calculate county total-withdrawal values. Irrigation system and conveyance efficiencies were assumed to be 95 percent combined. Consumptive-use values were estimated from the SWB model values of ETa. The water source type was determined using the same county proportions from the 2010 compilation. Reclaimed wastewater used for agriculture was not estimated. Most golf course irrigation values were reported, but some were estimated using modified acreages from the HSIP Gold data and irrigation rates from the SWB model.
New Jersey
The New Jersey WSC estimated the number of irrigated acres using information from the USDA–NASS 2012 Census of Agriculture and the 2013 IWMS. Total water-withdrawal values were estimated using reported information from the New Jersey Department of Environmental Protection (likely including pastures and horticulture). The New Jersey Department of Environmental Protection Bureau of Water Allocation collects water-use reports on groundwater or surface-water withdrawal amounts over 100,000 gallons of water per day. For any water-use withdrawal or diversion in the Highlands Preservation Area, the threshold is 50,000 gallons per day. The irrigation-system type used on irrigated acreages was determined from information in the 2013 IWMS. Irrigation-system efficiencies and conveyance losses were not estimated. Consumptive-use values were estimated to be 68 percent of total withdrawals based on the New Jersey State Water Supply Plan. The water source type was determined using information reported by the New Jersey Department of Environmental Protection. Reclaimed wastewater is not a known source of water for irrigation in New Jersey. Golf course irrigation values were estimated using information from the New Jersey Department of Environmental Protection and reported with crop-irrigation values.
New Mexico
The New Mexico WSC estimated the number of crop acres using information from the USDA–NASS 2015 CDL. Some counties had reported irrigated-acreage values; for others, the number of irrigated acres was estimated using the 2015 CDL and historical information. Total water-withdrawal values, including horticulture, were estimated using historical water-use values and a coefficient based on the ratio of irrigated acres from previous compilations and the 2015 acreage counts for each crop type. The ratio of county-level irrigation-system types associated with irrigated acreages was consistent with the 2010 compilation. Irrigation-system efficiencies and conveyance losses were not estimated. Consumptive-use values were provided by the New Mexico Office of the State Engineer (New Mexico Office of the State Engineer, 2015). The modified Blaney-Criddle method was used for the Upper Colorado River Basin to maintain consistency with the New Mexico Interstate Stream Commission’s accounting of consumptive use, and the Blaney-Criddle equation was used for the rest of New Mexico (Blaney and Criddle, 1962; U.S. Department of Agriculture, Soil Conservation Service, 1970). The water source type was determined using historical information. Reclaimed wastewater is not a known source of water for irrigation in New Mexico. Golf course irrigation values were estimated and reported separately using information from the New Mexico Office of the State Engineer and the Blaney-Criddle equation.
New York
The New York WSC used values from the USDA–NASS 2012 Census of Agriculture and the 2013 IWMS to estimate the number of crop acres and withdrawal values for irrigation. The total number of irrigated acres for each New York county, by system type, were calculated using the 2013 IWMS values for four main crops and extrapolated to county acres reported in the 2012 Census of Agriculture. Total crop-irrigation withdrawal values were calculated using the number of irrigated acres with county application-rate coefficients built from crop-specific 2013 IWMS application, withdrawal, and system-type information. Conveyance and irrigation-system efficiencies were not estimated. Consumptive-use values were estimated to be 95 percent of total withdrawal values. Total county crop-irrigation withdrawals values were portioned into groundwater and surface-water withdrawals using reported data ratios of golf course irrigation from the New York State Department of Environmental Conservation Water Withdrawal Reporting (DEC WWR) database. Reclaimed wastewater is not a known source of water for irrigation in New York. Golf course irrigation values were either reported from the DEC WWR database or estimated using coefficient-derived irrigated-acres values and application rates calculated from the reported data.
North Carolina
The South Atlantic WSC estimated the number of crop acres using information from the USDA–NASS 2012 Census of Agriculture and information published by the North Carolina Department of Agriculture. The number of irrigated acres was estimated using the percentage of total harvested acres reported in the USDA–NASS 2012 Census of Agriculture. Total water-withdrawal values, excluding pastures, were estimated using the number of calculated irrigated acres and a coefficient of 8 inches per acre per year for most crops, 10 inches per acre per year for orchards, 27 inches per acre per year for sod, and 40 inches per acre per year for nursery crops. County proportions of each irrigation-system type associated with the number of irrigated acres was consistent with previous compilations. Conveyance and irrigation-system efficiencies were not estimated. Consumptive-use values were estimated to be 100 percent. The water source type was determined using the results of an email survey conducted by North Carolina State University and the Agriculture Extension Service, in the mid-1990s, that collected water-source and irrigation system-type information by county. Reclaimed wastewater is not a known source of water for crop irrigation in North Carolina but has been used for golf course irrigation. Golf course irrigation values were estimated and reported separately from crop-irrigation values using coefficients and the number of acres estimated per hole.
North Dakota
The Dakota WSC estimated the number of irrigated acres, identified irrigation-system types, and estimated withdrawal values primarily on information received from the permit section of the North Dakota State Water Commission (NDSWC). Water-permit holders are allocated specified amounts of withdrawals from a source and are required to file annual water-use information with the State engineer. The number of crop acres was estimated using information from the NDSWC permit files and the 2013 IWMS. Total water-withdrawal values by water source type, including pastures and horticulture, were estimated using the NDSWC permit information and reported data. Irrigation system-type data were obtained from the NDSWC permit files and information provided by North Dakota State University. Conveyance and irrigation-system efficiencies were not considered in estimating withdrawal values. Consumptive-use values for the applied irrigation water within each county were calculated by subtracting effective precipitation values from ETa; ETa estimates for the growing season (April through September 2015) were estimated from the SSEBop model (Senay and others, 2013, data in Painter and others, 2021), and effective-precipitation values were estimated at about 75 percent of growing-season precipitation (https://farmwest.com/climate/weather-parameters/effective-precipitation/). Reclaimed wastewater is not a known source of water for crop irrigation in North Dakota. Golf course irrigation values were estimated and included with crop-irrigation values.
Ohio
The Ohio-Kentucky-Indiana WSC estimated the number of irrigated acres using information from the USDA–NASS 2012 Census of Agriculture. Total water-withdrawal values, including pastures and horticulture, were estimated using information from the Ohio Department of Natural Resources. Irrigation system-type data came from the Ohio State University County Extension offices and the Soil and Water Conservation District Offices. Conveyance and irrigation-system efficiencies were not considered. Consumptive-use values were estimated at 90 percent of withdrawals. The Ohio Department of Natural Resources reported water-source type information. Reclaimed wastewater is not a known source of water for crop irrigation in Ohio. Golf course irrigation values were provided from the Ohio Department of Natural Resources and are reported separately from crop-irrigation data.
Oklahoma
The Oklahoma-Texas WSC estimated the number of crop acres using information from the Oklahoma Water Resources Board (OWRB), the Bureau of Reclamation, the USDA–NASS 2012 Census of Agriculture, and the Lugert-Altus Irrigation District. The number of irrigated acres was estimated using the 2012 Census of Agriculture data plus an estimated 5-percent increase to account for drier conditions during 2012 than 2015. Total water-withdrawal values, including horticulture (irrigated pastures are uncommon in Oklahoma), were estimated using site-specific reported data from the OWRB. Irrigation system-type assignments to irrigated acres were determined through communication with the USDA Oklahoma State statistician. Conveyance and irrigation system-efficiencies and consumptive-use values were estimated using information from the 2010 USGS compilation and a Bureau of Reclamation report for the Lugert-Altus Irrigation District. The conveyance efficiency was identified at 83 percent for groundwater and 78 percent for surface water. The water source type was determined using reported data from the OWRB. Reclaimed wastewater is not a known source of water for crop irrigation in Oklahoma. Golf course irrigation values reported by the OWRB were included with crop-irrigation values.
Oregon
The Oregon WSC determined the number of crop irrigated acres by intersecting Oregon Water Resources Department water-rights maps and irrigation district boundaries with the USDA–NASS 2015 CDL. The number of crop acres by irrigation system were calculated using previously developed coefficients using information from Oregon State University (OSU) Extension Service scientists, the 2008 IWMS, and other publications. Crop consumptive-use coefficients were developed from Oregon Crop Water Use and Irrigation Requirements (Cuenca, 1992) and communication with OSU Extension Service scientists. The irrigation-efficiency coefficients used were based on those in Energy and Water Consumption of Pacific Northwest Irrigation Systems (King and others, 1977) and modified from discussions with OSU Extension Service scientists. Irrigation system-type coefficients for 2015 were modified from prior coefficients with information from OSU Extension Service scientists, the 2008 IWMS, and other publications. The Oregon Water Resources Department water-rights maps and irrigation-district boundaries were used to determine the proportion of total water-withdrawal values by groundwater and surface water for each county. Reclaimed wastewater use for irrigation is unknown and not estimated. Golf course irrigation values were reported separately from crop-irrigation values. The number of golf course irrigated acres was calculated by identifying all golf courses in Oregon and assuming 80 percent of the OWRD water-rights acreages for each golf course were irrigated (Environmental Institute for Golf, 2009).
Pennsylvania
The Pennsylvania WSC estimated the number of irrigated acres using information from the USDA–NASS 2012 Census of Agriculture and the 2013 IWMS. Total water-withdrawal values, including pastures, were calculated using information from the IWMS, Census of Agriculture, and county-level crop-application rates. Information from the 2013 IWMS was used to associate irrigation-system type with the county-level estimates of irrigated acreage. Irrigation-system efficiencies and conveyance losses were not considered. Consumptive-use values were estimated at 90 percent of total county-withdrawal values. The water source type was determined from the 2013 IWMS. Reclaimed wastewater is not a known source of water for crop irrigation in Pennsylvania. Golf course irrigation values were either reported from the Pennsylvania Department of Environmental Protection or estimated using coefficients and are reported separately from crop-irrigation values.
Puerto Rico and U.S. Virgin Islands
The Caribbean-Florida WSC reported no irrigation activity in the Virgin Islands in 2015. The Caribbean-Florida WSC estimated the number of crop acres and the number of irrigated acres for Puerto Rico using the USDA–NASS 2012 Census of Agriculture and satellite imagery from Google Earth. Total water-withdrawal values, excluding pastures and horticulture, were determined using metered diversions of surface water and the estimation of groundwater based on the number of irrigated acres, crop type, and the crop water requirements. Irrigation-system efficiencies and conveyance efficiencies were not considered. Consumptive-use values were estimated using ET information from the University of Puerto Rico. The associated water source type and irrigation-system type were determined using field verifications and reported diversions. Reclaimed wastewater is not a known source of water for crop irrigation in Puerto Rico. Golf course irrigation values were estimated and were reported with crop-irrigation values. These estimates were calculated using data from the water requirement for grass and golf course acreages.
Rhode Island
The New England WSC estimated crop acreages and the number of irrigated acres using the USDA–NASS 2012 Census of Agriculture, 2013 IWMS, and 2015 CDL. Acreage values by system type were determined using the same county ratios used in the 2010 compilation. Total water-withdrawal values, excluding horticulture, were estimated using an SWB model that incorporated soils, weather, and crop data to create irrigation rates. These rates were then multiplied by the number of irrigated acres and aggregated by county to calculate withdrawal values. Irrigation-system and conveyance efficiencies were assumed to be 95 percent combined. Consumptive-use values were estimated from the SWB values of ETa. The water source type was determined using the same county proportions from the 2010 compilation. Reclaimed wastewater used for agriculture was not estimated. Golf course irrigation values were estimated and reported separately using modified acreages from HSIP Gold data and irrigation rates from SWB.
South Carolina
The South Atlantic WSC estimated crop acreages and the number of irrigated acres by irrigation-system type using the USDA–NASS 2012 Census of Agriculture. Reporting water-withdrawal values is a requirement for having a water-use permit and withdrawing 3 million gallons per month or greater in the State and is regulated by the South Carolina Department of Health and Environmental Control (SCDHEC). These withdrawal values were summarized to determine county total-withdrawal estimates. Irrigation-system efficiencies and conveyance loss were not considered. Consumptive-use values were estimated to be 100 percent. The water source type was determined using data reported to SCDHEC. Reclaimed wastewater is not a known source of water for irrigation in South Carolina. Golf course irrigation values were estimated using reported information from SCDHEC and supplemented with estimates for nonreporting golf courses using estimated acres per course and a coefficient for application rates based on methodologies established in North Carolina.
South Dakota
The Dakota WSC based estimates of the number of irrigated acres, the identification of irrigation-system types, and estimated-withdrawal values on information received from the permit section of the South Dakota State Department of Environmental and Natural Resources (DENR), Water Rights Program. Annually, the DENR sends out questionnaires to each permitted irrigation-water user in the State. The questionnaire requests information including withdrawals, water source type (surface water or groundwater), the number of irrigated acres, irrigation-system type, county name, types of crops irrigated, and the amount of water applied to each crop. The Dakota WSC receives this compiled information from DENR and summarizes the required information by county. Irrigation system and conveyance efficiencies were not considered. Consumptive-use values were estimated based on ETa estimates for the growing season (May–September 2015) provided by the SSEBop model (Senay and others, 2013; data in Painter and others, 2021). Effective-precipitation values were estimated based on NWS climate-station records and calculations that used methods provided by the South Dakota State University Extension iGROW Corn program (https://extension.sdstate.edu/igrow-corn-best-management-practices-corn-production). Effective-precipitation values were subtracted from the ETa estimates to determine the consumptive-use values for the applied irrigation water within each county. Reclaimed wastewater used for agriculture was not estimated. The irrigation water-use values for golf courses, horticulture, and pastures were not estimated.
Tennessee
The Lower Mississippi-Gulf WSC estimated crop acreages and the number of irrigated acres using information from the USDA–NASS 2012 Census of Agriculture. Total water-withdrawal values, excluding pastures and horticulture (which were not specifically identified), were estimated using crop-acreage and application-rates information from the 2012 Census of Agriculture and the 2010 USGS compilation for counties not included in the USDA–NASS data (to protect farm-owner privacy). Consumptive-use values were estimated using application efficiencies from Solomon (1988). County-level irrigation-system types linked to irrigated acreages were consistent with the county-level ratios used in the 2010 compilation. Irrigation system-efficiency information indicated 80-percent efficiency for sprinkler and micro-irrigation systems and 75-percent efficiency for surface-irrigation systems. The water source type was determined using county water-source ratios from the 2010 compilation. Reclaimed wastewater used for agriculture was not estimated. Golf course irrigation values were estimated and reported separately from crop-irrigation values.
Texas
The Oklahoma-Texas WSC estimated the number of crop acres using information from the Texas Water Development Board. The data provided were aggregated by county. Irrigated-acreage data came from the FSA and were modified using the Texas Water Development Board data when applicable. The Texas Water Development Board provided county water-withdrawal estimates. Horticulture was not included, and it is unknown if pasture irrigation was included in the estimates. Proportions of surface water and groundwater were determined, in part, from diversion data from the Texas Commission on Environmental Quality and the Texas Water Masters. Proportions of the estimated irrigated acreages associated with each irrigation-system type (sprinkler, micro-irrigation, and surface) were determined through a report from the year 2000, which documented irrigation by system type. The Texas Water Development Board provided an irrigation-efficiency factor for use in estimating consumptive-use values. Reclaimed wastewater and golf course irrigation values were not estimated.
Utah
The Utah WSC estimated crop acreages and the number of irrigated acres by system type using information from the Utah Department of Water Resources (UDWR), which uses satellite imagery and field verifications to determine field boundaries. The number of irrigated acres was summed by county. Total water-withdrawal values, including pastures, were estimated using the UDWR GIS-based Water Budget Program model and provided to the Utah WSC as county aggregates. The Water Budget Program model contained information on irrigation-system and conveyance efficiencies and provided consumptive-use values. The water source type was determined using the UDWR’s Water Budget Program model and USGS groundwater data. Reclaimed wastewater is used primarily on pastureland and alfalfa, and the values were estimated using information from the Utah Division of Water Quality and UDWR publications. Golf course irrigation values were estimated and reported separately from crop-irrigation values using information from the Utah Automated Geographic Reference Center database.
Vermont
The New England WSC estimated crop-acreages and the number of irrigated acres using information from the USDA–NASS 2012 Census of Agriculture, the 2013 IWMS, and the 2015 CDL. Acreage values by irrigation-system type were determined using the same ratios as those in the 2010 compilation. Total water-withdrawal values, excluding horticulture, were estimated using an SWB model. These rates were then multiplied by the number of irrigated acres and aggregated by county to calculate withdrawal values. Irrigation-system and conveyance-efficiencies information indicated a combined 95-percent statewide efficiency (Shaffer and Runkle, 2007). Irrigation system-type data were considered consistent with county ratios in the 2010 compilation. Consumptive-use values were estimated from the SWB modeled values of ETa. The water source type was determined using the same county proportions as those in the 2010 compilation. Reclaimed wastewater is not a known source of water for irrigation in Vermont. Golf course irrigation values were estimated and reported separately from crop-irrigation values using modified acreages from the HSIP Gold 2015 data and irrigation-rate values from the SWB.
Virginia
The Virginia and West Virginia WSC estimated the number of irrigated acres using information from the USDA–NASS 2012 Census of Agriculture. Total water-withdrawal values, including pastures and horticulture, were estimated using the Virginia Department of Environmental Quality (VADEQ) reported data or calculated by using the number of irrigated acres and county coefficients developed for previous compilations. Irrigation system-type county ratios were considered consistent with those used in previous compilations. Irrigation-system type and conveyance efficiencies were estimated to be 90 percent for sprinkler systems and 95 percent for micro-irrigation systems (Irmak and others, 2011). Consumptive-use values were estimated to be the fraction of withdrawals not lost due to system-type or conveyance inefficiencies. The water source type was determined either through information provided by VADEQ or estimated using county-specific coefficients developed for previous compilations. Reclaimed wastewater is not a known source of water for irrigation in Virginia. Golf course irrigation values were either reported from VADEQ or estimated using regional coefficients and reported separately from crop-irrigation values.
Washington
The Washington WSC estimated crop acreages and the number of irrigated acres by system type using information from the USDA–NASS 2012 Census of Agriculture, 2013 IWMS, and previous USGS compilations. Estimates of water withdrawals, including pastures and excluding horticulture, were calculated using the number of irrigated acres and irrigation application rates estimated from 2010 application rates. Irrigation-system efficiencies were determined to be 80 percent for sprinkler systems, 90 percent for micro-irrigation systems, and 70 percent for surface-irrigation systems, and these percentages were used in estimating consumptive-use values (Howell, 2003). The water source type was determined using previous USGS compilations and USDA information. Reclaimed wastewater is not a known source of water for irrigation in Washington. Golf course irrigation values were estimated and reported separately from crop irrigation.
West Virginia
The Virginia and West Virginia WSC estimated crop acreages and the number of irrigated acres using information from the USDA–NASS 2012 Census of Agriculture. Total water-withdrawal values, including pastures and horticulture, were calculated by multiplying the number of irrigated acres and county-specific coefficients developed for previous compilations. County ratios of irrigation-system types were consistent with those used in the previous compilation. Irrigation system-type and conveyance efficiencies were identified as 90 percent for sprinkler systems and 80 percent for micro-irrigation systems (Irmak and others, 2011). Consumptive-use values were estimated to be the fraction of withdrawals not lost through matters of system efficiency or conveyance. The water source type was determined using county-specific coefficients developed for previous compilations. Reclaimed wastewater is not a known source of water for irrigation in West Virginia. Golf course irrigation values were estimated using regional coefficients and reported separately from crop-irrigation values.
Wisconsin
The Upper Midwest WSC estimated the number of irrigated acres using a GIS coverage of irrigated lands provided by the Wisconsin Department of Natural Resources (WDNR) Water Use Section, county-level data from the USDA–NASS 2012 Census of Agriculture, and industry reports of cranberry production. Total water-withdrawal values, including minor quantities of withdrawals for pastures, horticulture, and golf courses, were estimated primarily from data provided by WDNR for high-capacity systems with reported withdrawals of greater than 70 gallons per minute. Registered water users are required to measure or estimate the volume of water they withdraw every month and report that information annually to the WDNR. In addition, the USGS estimated withdrawal values for low-capacity systems based on reported pumping rates and estimated periods of use. The number of irrigated acres, by irrigation system type, was estimated through the evaluation of 2013 IWMS data and county-specific, high-capacity usage data provided by WDNR. High-capacity groundwater-usage irrigation systems were designated as sprinkler systems, and high-capacity surface-water usages irrigation systems were designated as sprinkler systems for most principal crops (corn, for example) and as a combination of surface and sprinkler systems for secondary crops (examples are wild rice and cranberries). Irrigation system and conveyance efficiencies were not considered. Consumptive-use values were estimated at 20 percent of withdrawals for cranberries and 90 percent of withdrawals for all other irrigation. The water source type was determined using WDNR data. Reclaimed wastewater is not a known source of water for irrigation in Wisconsin. Golf course withdrawal values were estimated and included with crop-irrigation values, but golf course acres were not estimated and are not included in the compilation.
Wyoming
The Wyoming-Montana WSC estimated the number of irrigated acres within each county based on values reported in the USDA–NASS 2012 Census of Agriculture. The sum of acres for each irrigation-system type was based on percentages from historic (through 2009) USDA–NASS reports that included the acreage irrigated by “method of water distribution.” The same percentages have been used since the 2000 compilation. The relative percentages of surface-water and groundwater withdrawals were applied at percentages similar to the 2000–2010 compilations. Irrigation-withdrawal values were based on ETa calculated by the SSEBop model (Senay and others, 2013; data in Painter and others, 2021). Since a digital spatial dataset of irrigated lands was unavailable for Wyoming, the ET estimates were calculated in areas identified as “potentially irrigated.” Effective-precipitation values ranged from 1.0 to 6.0 inches among counties and averaged 3.4 inches for the State of Wyoming. Total irrigation-withdrawal values (including pastures) for each county were calculated by dividing the total consumptive use of applied irrigation water (ETirr) by the total irrigation efficiency (combined conveyance and irrigation system-efficiencies percentages). Assigned irrigation system-efficiency percentages were 55 percent for flood systems and 85 percent for sprinkler systems (Bear River Basin Planning Team, 2000). Conveyance system-efficiencies percentages ranged from 40 to 55 based on values reported in River Basin Water Plans of the Wyoming Water Development Office. The overall combined irrigation-efficiency percentages (conveyance and irrigation system) for Wyoming was about 59 percent. Reclaimed wastewater for agriculture and golf course irrigation were not included in these estimates.
Conversion Factors
U.S. customary units to International System of Units
Abbreviations
BOR
Bureau of Reclamation
CADWR
California Department of Water Resources
CDL
Cropland Data Layer
CDSS
Colorado Decision Support System
CDWR
Colorado Department of Water Resources
CLU
Common Land Unit
CML
Census mailing list
CONUS
Conterminous United States
DEC WWR
New York State Department of Environmental Conservation Water Withdrawal Reporting
DENR
Department of Environmental and Natural Resources
EROS
Earth Resources Observation Science
ET
evapotranspiration
ETa
actual evapotranspiration
ETirr
evapotranspiration of applied irrigation water utilized by the crops (consumptive use)
FAO
Food and Agriculture Organization
FMMP
Farmland Mapping and Monitoring Program
FSA
Farm Service Agency
GaEPD
Georgia Environmental Protection Division
GIS
geographic information system
GCSAA
Golf Course Superintendents Association of America
HSIP
Homeland Security Infrastructure Program
IADNR
Iowa Department of Natural Resources
INDNR
Indiana Department of Natural Resources
IWMS
Irrigation and Water Management Survey
IWR
Irrigation Water Requirements
KADWR
Kansas Department of Agriculture, Division of Water Resources
KDOW
Kentucky Department of Environmental Protection, Division of Water
km
kilometer
km2
square kilometers
MDE
Maryland Department of the Environment
MIrAD–US
MODIS Irrigated Agriculture Dataset for the United States
MNDNR
Minnesota Department of Natural Resources
MODIS
Moderate Resolution Imaging Spectroradiometer
MPARS
MNDNR Permitting and Reporting System
MTDNRC WMB
Montana Department of Natural Resources and Conservation, Water Management Bureau
MWU
major water users
NAIP
National Agriculture Imagery Program
NASS
National Agricultural Statistics Service
NDSWC
North Dakota State Water Commission
NDVI
Normalized Difference Vegetation Index
NDWR
Nevada Department of Water Resources
NOAA
National Oceanic and Atmospheric Administration
NRCS
Natural Resources Conservation Service
NWC
National Water Census
NWS
National Weather Service
NWUSP
National Water Use Science Project
OSU
Oregon State University
OWRB
Oklahoma Water Resources Board
SALUB
Statewide Agricultural Land Use Baseline
SCDHEC
South Carolina Department of Health and Environmental Control
SSEBop
operational Simplified Surface Energy Balance
SWB
Soil-Water Balance
UAH
University of Alabama-Huntsville
UDWR
Utah Department of Water Resources
USDA
U.S. Department of Agriculture
USGS
U.S. Geological Survey
VADEQ
Virginia Department of Environmental Quality
WACOP
Water Allocation Compliance and Online Permitting
WAUSP
Water Availability and Use Science Program
WDNR
Wisconsin Department of Natural Resources
WMD
water management districts
WRIS
Water Rights Information System
WSC
Water Science Center
YMD
Yazoo Management District
Suggested Citation
Painter, J.A., Brandt, J.T., Caldwell, R.R., Haynes, J.V., and Read, A.L., 2021, Documentation of methods and inventory of irrigation information collected for the 2015 U.S. Geological Survey estimated use of water in the United States: U.S. Geological Survey Scientific Investigations Report 2020–5139, 39 p., https://doi.org/10.3133/sir20205139.
ISSN: 2328-0328 (online)
Study Area
| Publication type | Report |
|---|---|
| Publication Subtype | USGS Numbered Series |
| Title | Documentation of methods and inventory of irrigation information collected for the 2015 U.S. Geological Survey estimated use of water in the United States |
| Series title | Scientific Investigations Report |
| Series number | 2020-5139 |
| DOI | 10.3133/sir20205139 |
| Year Published | 2021 |
| Language | English |
| Publisher | U.S. Geological Survey |
| Publisher location | Reston, VA |
| Contributing office(s) | Arizona Water Science Center, Georgia Water Science Center, Oregon Water Science Center, WY-MT Water Science Center, South Atlantic Water Science Center |
| Description | Report: vi, 39 p.; Data Release |
| Country | United States |
| Online Only (Y/N) | Y |
| Additional Online Files (Y/N) | Y |
| Google Analytic Metrics | Metrics page |