

Nitrogen and Phosphorus Loads from Groundwater to Lake Spokane, Spokane, Washington, October 2016–October 2019
Links
- Document: Report (5.8 MB pdf) , HTML , XML
- Data Release: USGS data release — Water quality and seepage estimates collected at Lake Spokane, Washington, 2016–19.
- Download citation as: RIS | Dublin Core
Abstract
Shallow nearshore groundwater and estimates of groundwater seepage were collected at 21 locations along the north and south shores of Lake Spokane beginning in October 2016 and ending in October 2019. Nitrate plus nitrite concentrations in nearshore groundwater ranged from <0.04 to 7.60 milligrams of nitrogen per liter. Nearshore groundwater orthophosphate concentrations ranged from <0.004 to 0.381 milligrams of phosphorus per liter, and, overall, there were no consistent seasonal differences in nearshore groundwater nutrients during this study. Nitrate plus nitrite concentrations were highest at sites located adjacent to nearshore development and similar to concentrations in water collected from nearby drinking water wells. Similarly, samples from locations adjacent to nearshore development were statistically greater than samples collected from other locations for orthophosphate concentrations. Dissolved boron concentrations, elevated values of which are an indicator of household-detergent use, were elevated in spring and summer at some locations, indicating that residential wastewater was reaching the lake. Stable isotope ratios of nitrate (15N and 18O), which were used to identify the source nitrate in sampled groundwater, showed that most data indicated a mix of soil nitrogen and nitrogen sources from human or animal waste.
Generally, median groundwater discharge to the lake was low across all sites and seasons, with most values smaller than 1 centimeter per day (cm/d). Similar to the nutrient-concentration data, seasonal patterns in seepage flux were weak, and, where there were seasonal increases in flux, the increased groundwater discharge did not carry increased nutrients. Localized estimates of groundwater seepage flux were scaled up to the entire length of the lakeshore. The median groundwater flux of 0.34 cm/d scaled to 1.9 cubic feet per second (ft3/s), and the maximum recorded seepage flux of 17.6 cm/d was equivalent to 97 ft3/s. These estimates of groundwater inputs are orders of magnitude less than surface water inputs to the lake.
Nutrient loads were determined from the product of groundwater flow and a representative nutrient concentration. Using the median seepage flux of 1.9 ft3/s, the orthophosphate load ranged from 0.7 to 3.8 pounds of phosphorus per day based on the median and maximum orthophosphate concentrations, respectively. For nitrate plus nitrite, loads ranged from 5.8 to 76.6 pounds of nitrogen per day. Using the maximum value of seepage flux, maximum orthophosphate loads ranged from 35 to 198 pounds of phosphorus per day, and maximum nitrate plus nitrite loads ranged from 296 to 3,943 pound of nitrogen per day. Overall, groundwater nutrient loads are small compared to other sources to the lake. Continued monitoring of future nutrient loads would aid decisions by resource managers as infrastructure within the neighboring residential communities continues to age around Lake Spokane.
Introduction
Lake Spokane, located about 10 miles northwest of Spokane, Washington, is formed by the impoundment of the Spokane River between two dams; upstream at Nine Mile Falls Dam and downstream at Long Lake Dam (fig. 1). The lake forms the boundary between Stevens County to the north and Spokane County to the south and is approximately 24 miles (mi) long. There is a long history of water-quality studies of Lake Spokane, and water-quality impairment has been an issue for decades. Low dissolved oxygen (DO) conditions in the lake have been documented since the 1970s, and phosphorus loading to the lake was identified as the cause of these low DO conditions (Patmont and others, 1987). Phosphorus inputs can result in algal and plant growth increases and a subsequent decrease in DO that results from the decomposition of in-lake algae and plants (Soltero and others, 1973). Phosphorus is delivered to Lake Spokane from municipal and industrial point-source inputs to the Spokane River upstream of Lake Spokane but is also conveyed by groundwater from nonpoint-sources including septic tanks, agricultural fields, wildlife, and erosion of soils from surface runoff.
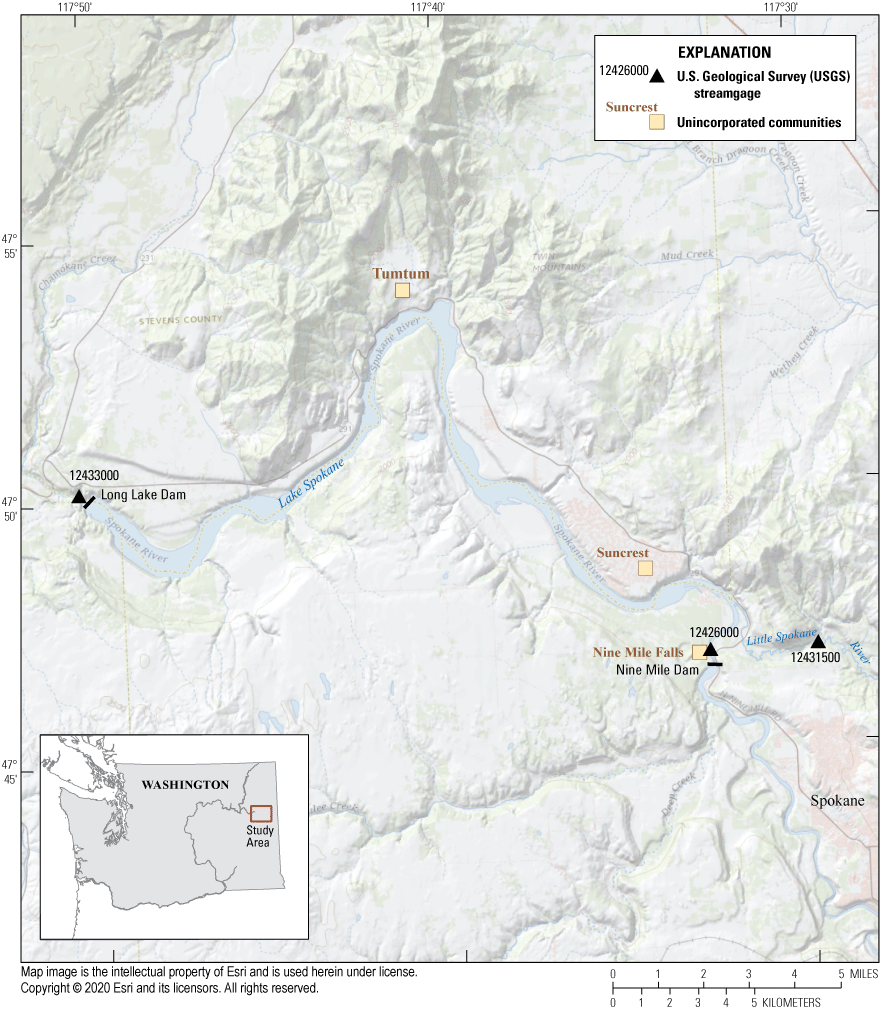
U.S. Geological Survey streamgages used in this study and nearby unincorporated communities of interest, Lake Spokane, Spokane, Washington.
A series of reports characterizing Lake Spokane water quality were published in 1970s and 1980s, spanning a time when advanced measures were installed at the Spokane wastewater-treatment plant. The reports documented a large reduction of phosphorus loading from the Spokane River to Lake Spokane, which resulted in an improvement in the trophic status of the lake (Soltero and others, 1981). Despite the reductions in phosphorus loading from upstream, low DO conditions in the lake persisted. In response, the Washington State Department of Ecology (hereinafter “Ecology”) put Lake Spokane on the 303(d) list of impaired water bodies for low DO levels and developed a total maximum daily load (TMDL) for phosphorus in 1992. The TMDL was revised in 2010 because of continued algal blooms and water-quality concerns (Moore and Ross, 2010).
Recently, it has been suggested that phosphorus loading from groundwater could be more important than previously thought and further study of groundwater phosphorus delivery to the lake was warranted (GeoEngineers, Inc., 2011). Phosphorus in groundwater is partially retained by natural soils and soil media beneath septic system drain-fields via sorption and may be further attenuated by sorption along groundwater-flow paths toward the lake. However, there is a growing concern that the retention capacity of sediments in residential areas of Lake Spokane to bind phosphorus over time has been exceeded, allowing phosphorus in regional groundwater and septic system effluent to migrate greater distances along groundwater-flow paths and potentially discharge to the lake (HDR, 2007; GeoEngineers, Inc., 2009, 2010, and 2011). As a result, groundwater has been identified as a potential and possibly substantial source of phosphorus to Lake Spokane based on the coarse sediments (low sorption capacity) in the area and the high density of septic system use in some areas.
Soltero and others (1992) calculated some of the first estimates of groundwater phosphorus delivery to the lake and showed it comprised 1–5 percent of the annual loading to the lake with a range in soluble reactive phosphorus concentrations in nearby wells from 6 to 650 micrograms per liter (µg/L). Ecology used estimates of regional groundwater phosphorus concentrations to derive their groundwater allocation for total phosphorus of 25 µg/L to the lake for their DO TMDL model (Moore and Ross, 2010). To date, the only detailed study of shallow groundwater nutrient chemistry at Lake Spokane was completed by the U.S. Geological Survey (USGS) in 2015 (Gendaszek and others, 2016). In that study by Gendaszek and others, shallow groundwater was sampled in March and April 2015 from 30 piezometers driven into the nearshore (“nearshore” was defined as the area within 50 feet of shore) of Lake Spokane and focused around the Suncrest residential area on the north shore. Nitrate plus nitrite concentrations in groundwater downgradient of undeveloped areas were significantly lower than those measured downgradient of both nearshore and terrace residential development. However, orthophosphate concentrations in groundwater were not significantly different with respect to upgradient land use. Median values of shallow groundwater orthophosphate were 44 micrograms of phosphours per liter (µg P/L), higher than the estimates used in the current DO TMDL. Gendaszek and others (2016) provided some important background data on shallow groundwater nutrient concentrations; however, they did not quantify groundwater flux (flow) into the lake from the nearshore areas where these samples were collected. Additionally, because samples were collected during a single season (spring 2015), temporal variability in shallow groundwater concentrations was unknown. The temporal variability in nearshore groundwater nutrients was further explored by sampling a subset of wells from the USGS study (Gendaszek and others, 2016) from March through August 2015 (Plastino, 2016). Plastino (2016) concluded that seasonal variability across the study (March–August) was not statistically significant.
This report builds on the work of Gendaszek and others (2016) and Plastino (2016) by expanding the spatial and temporal scope of nutrient sampling and by including estimates of groundwater flow into the lake to calculate groundwater nutrient loads to Lake Spokane. Direct estimates of nutrient loading to Lake Spokane from discharging groundwater have not been determined to date but are needed to inform management decisions for the reduction of sources of phosphorus to the lake and its biota.
Purpose and Scope
The objective of this study was to improve understanding of nutrient loading by estimating the groundwater input of nitrogen and phosphorus to Lake Spokane, measure the concentration of these nutrients in shallow groundwater near the lakeshore, and estimate groundwater discharge (seepage) fluxes. Groundwater nutrient concentrations and seepage flux estimates were measured quarterly for 2 years to estimate seasonal variations in nutrient loading along the north shore of Lake Spokane. This work was followed by a smaller-scale study on the south side of the lake where groundwater sampling and discharge estimates were made in summer and autumn 2019.
Study Area
The impoundment of the Spokane River at Long Lake Dam forms a 24-mile-long, 5,000-acre reservoir called Lake Spokane (also known as Long Lake) with 243,000 acre-feet of water and 54 mi of shoreline (fig. 1). Above Nine Mile Dam, which is immediately upstream of Lake Spokane, the Spokane River drains 5,220 square miles of northeastern Washington and northern Idaho including the cities of Spokane and Coeur d’Alene, Idaho. Mean monthly discharge into Lake Spokane from water year 1947 to 2019 at the Spokane River below Nine Mile Dam at Spokane, Washington (USGS streamgage station 12426000), ranged from a high of 26,600 cubic feet per second (ft3/s) in May during snowmelt to a low of 1,200 ft3/s in August during summer baseflow. Several unregulated tributaries flow into Lake Spokane, the largest of which is the Little Spokane River, which enters Lake Spokane about 2 miles downstream of Nine Mile Dam. Mean monthly discharge from water years 1947 to 2019 at the Little Spokane River near Dartford, Washington (USGS streamgage station 12431500), ranged from 1,050 ft3/s in May to a low of 382 ft3/s in August and September. Discharge of the Spokane River is regulated at Long Lake Dam, which was completed in 1915 for hydroelectric power generation by Avista Utilities. From water years 1938 to 2019, mean monthly discharge of the Spokane River at Long Lake, Washington (USGS streamgage 12433000) ranged from a high of 18,700 ft3/s in May to a low of 1,760 ft3/s in August.
The pool elevation of Lake Spokane is held at approximately 1,535 feet (ft) above mean sea level for most of the year except for short periods of winter drawdown intended to increase storage capacity during the wet season and to manage pervasive aquatic plants by exposing them to freezing conditions in shallow margins of the lake. Lake Spokane is shallowest at the outlet of Nine Mile Dam and is deeper towards Long Lake Dam, where maximum water depths approach 180 ft. For the study summarized in this report, most sample events took place when the lake was near the maximum stage (fig. 2).
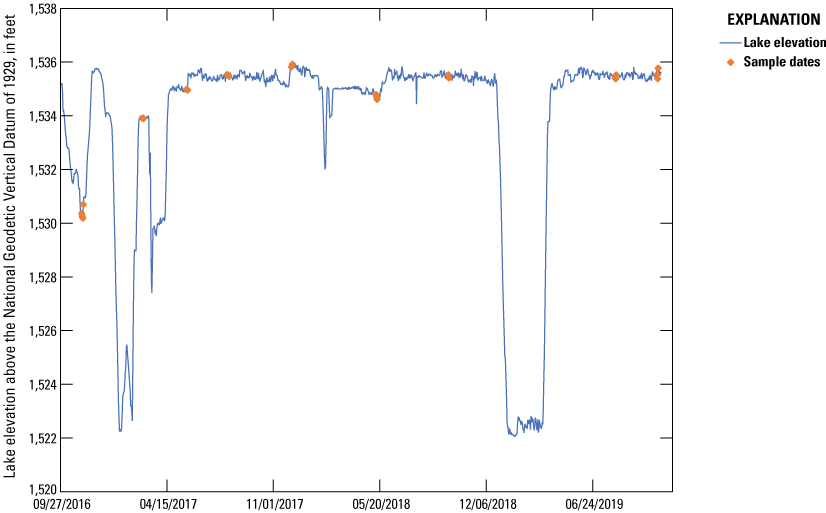
Lake Spokane surface elevation at U.S. Geological Survey streamgage 12432500 (Long Lake at Long Lake, WA), Spokane, Washington, October 2016–October 2019. Individual points represent days that shallow groundwater and groundwater flux were measured.
The predominant land covers surrounding Lake Spokane are undeveloped ponderosa pine (Pinus ponderosa) forest, farmland, and rural residential development within the three unincorporated communities of Nine Mile Falls, Suncrest, and TumTum (fig. 1), Washington. Residential development near Lake Spokane occurs along the shoreline of Lake Spokane and on 300-foot-high terraces created during large outburst floods of Glacial Lake Missoula at the end of the Pleistocene Epoch. The resulting aquifer is low in fine-grained sediment, which can result in less sorption of phosphorus during groundwater transport to the lake. Sewage from houses and businesses is typically managed by on-site septic systems throughout the area surrounding Lake Spokane.
Methods of Investigation
Field data were collected in two phases beginning in October 2016 and ending in October 2019. During phase one, shallow nearshore groundwater and estimates of groundwater discharge were collected along the north shore of Lake Spokane in Stevens County. Sampling during phase one took place quarterly for 2 years (November 2016 to September 2018). During phase two, a smaller-scale field data collection effort took place focused on the south shore of the lake in Spokane County. Sampling of shallow nearshore groundwater and discharge in phase two took place two times, once in August 2019 and once in October 2019.
Description of Sample Locations
Groundwater samples were collected from shallow (less than 1-meter below the lakebed), temporary piezometers installed within 50 ft of the lake shoreline. During phase one, 20–30 samples of shallow nearshore groundwater were collected quarterly from autumn 2016 until autumn 2018 from 15 sites the north shore. For phase two, 10–15 nearshore groundwater samples were collected in August and October 2019 from 6 sites the south shore. Sample locations were chosen to span a range of upland land uses, from higher-density, nearshore residential sites to sites adjacent to agricultural fields to sites in undeveloped areas.
Primary sites and secondary sites were sampled in this study. Primary sites were areas where both shallow groundwater samples were collected and groundwater seepage was measured using manual seepage meters. Secondary sites were locations where just shallow groundwater was collected. At the primary sites, three to five groundwater samples were collected within 100 ft of each other along the shoreline, whereas the secondary sites only included a single point sample. This approach provided estimates of site variability in groundwater chemistry at the primary locations where seepage numbers were measured, whereas the secondary sites allowed a greater spatial coverage of the nearshore to be characterized. In total, 6 primary sites and 15 secondary sites were sampled for this project (fig. 3; table 1).
Table 1.
Summary of sample sites from shallow groundwater piezometers along the nearshore of Lake Spokane, Spokane, Washington, October 2016–October 2019.[Abbreviations: AGR, agricultural site; LRP, Lake Ridge Park; LSC, Lake Spokane Campground; NMF, Nine Mile Falls; WBR, Willow Bay Resort; NSD, Nearshore Developed; TRD, terraced residential development; UND, undeveloped; SCW, Suncrest west; SCM, suncrest middle; USGS, U.S. Geological Survey]
The six primary sites spanned a range of land use adjacent to their nearshore sampling locations: one non-irrigated undeveloped site (UND), one irrigated agricultural site (AGR), and four nearshore developed sites (NSD) that included both year-round occupancy and summertime-only use. The Lake Spokane Campground (LSC) site was just east of the swimming beach surrounded by undeveloped land upgradient of the study area. Willow Bay Resort (WBR) was located within the camping area of the recreational vehicle and tent camping area of the summer resort and downgradient of the resort’s restroom and shower facility. Suncrest west (SCW) was sampled along the swimming beach and east towards the boat launch of Suncrest Park, a private park available exclusively to Suncrest residents The site was characterized by high summer use and located near the restroom upgradient of the swimming beach. Although this site was actively used during the study, the residential development upgradient of the park was considered low density. Lake Ridge Park (LRP) was a private park located at the eastern end of the unincorporated community of Suncrest. Sampling took place along the swimming beach and the vicinity of their boat docks. Upgradient of LRP, land use was high-density residential. On the south side of the lake, nearshore sampling took place from Nine Mile Falls campground (NMF) along the swimming beach and picnic area and a site adjacent to an irrigated agricultural field (AGR).
In order to compare data across sites with similar land use, each of the primary and secondary sites were classified into agricultural land (AGR), NSD, and terraced residential development (TRD) groups. The TRD sites, first described by Gendaszek and others (2016), were located along the lake and below high terraces where residential dwellings were located.
In addition to the nearshore sample locations, surface water (lake) samples were collected at each primary site during each visit, and a one-time sample of 15 nearby drinking water wells was collected. This allowed for comparisons between nearshore groundwater, deep regional groundwater, and the lake.
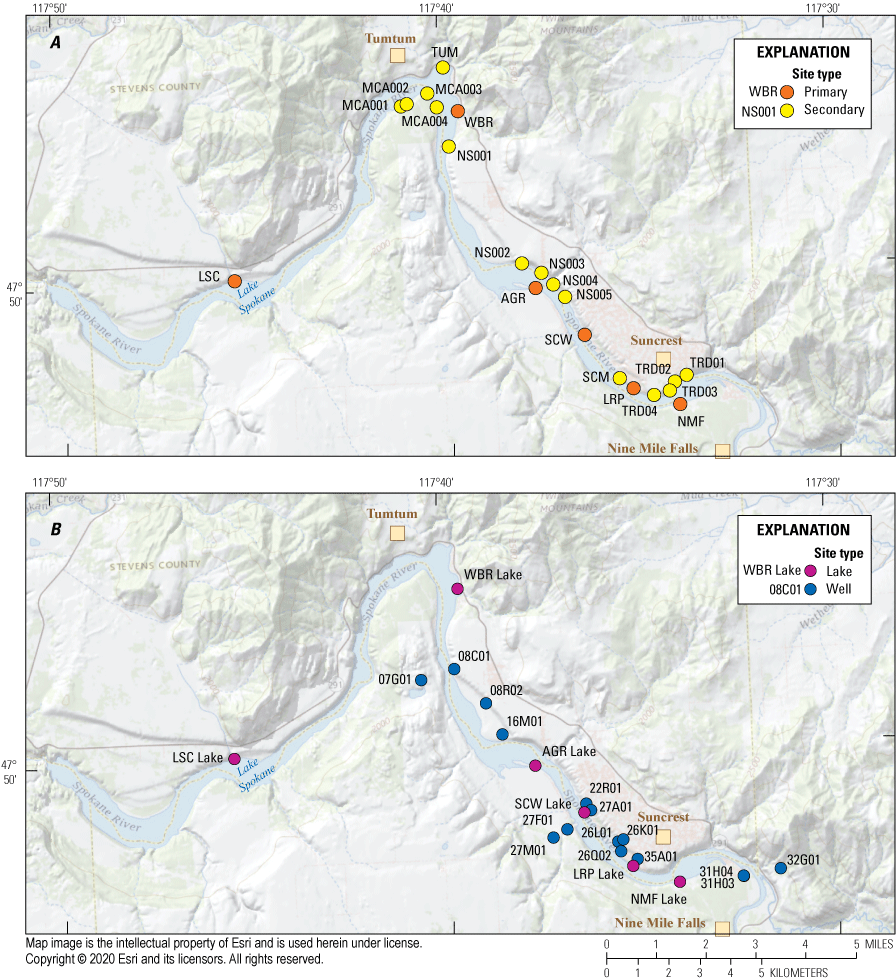
Locations of all sites sampled for nitrogen, phosphorus, and other select constituents, Lake Spokane, Spokane, Washington. (A) Primary and secondary sites, sampled approximately quarterly from October 2016 to October 2019. (B) Lake and well sample locations; lake sites were sampled during each site visit, and well sites were sampled a single time in October 2019.
Shallow Nearshore Groundwater Data Collection
Samples were taken with piezometers, which consisted of 5- to 6-foot-long rigid lengths of polypropylene tubing with a 6-inch-long sample tips made of a rigid stainless steel screen (0.0057-inch [in.] mesh) (fig. 4a). At each sample location, a solid steel three-fourth-in. diameter rod was hammered into the lakebed to make a pilot hole for the sampler. A 3-foot-long section of hollow three-fourth-in. diameter pipe with a loose-fitted bolt on one end was inserted into the pilot hole. This hollow pipe was then tapped into the lakebed until it was secure (typically about 2–3 ft below the lakebed). Once in place, the sample tube with attached sample tip was inserted into the hollow section of pipe and the pipe was removed, leaving the sampler in place in the lakebed and the bolt left in the subsurface and not recovered. A section of the sample tubing remained above the surface of the lake in order to extract the shallow groundwater sample (fig. 4b).
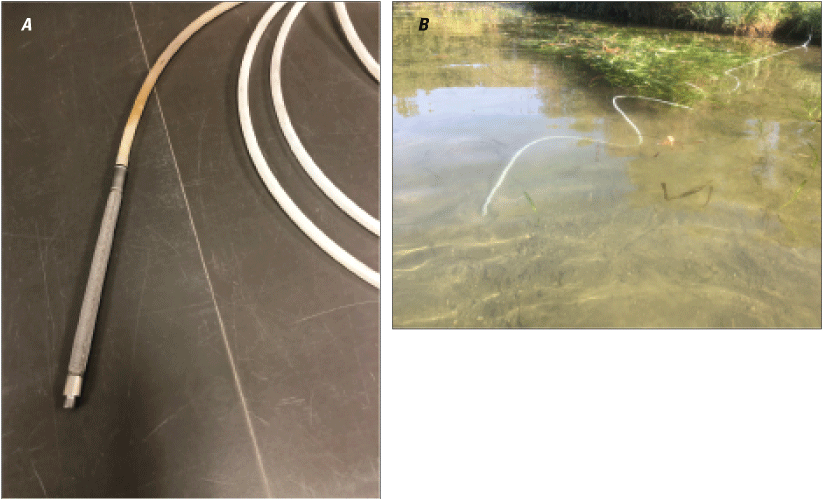
Components and installation of sampler used to collect shallow nearshore groundwater, Lake Spokane, Spokane, Washington. (A) Polypropylene tubing with stainless steel sample tip. (B) Final installation of the sample tip in the lakebed with sample tubing sticking out of the lakebed and towards the shore for pumping. All photos taken by Rich Sheibley, U.S. Geological Survey.
After installation, water was pumped out of the sample piezometer at a slow rate (less than 100 milliliters per minute) to minimize air bubbles in the line and to ensure sample water was being collected from the vicinity of the screened sample tip and not being drawn down from the lake surface. Field readings of temperature, DO, pH, and specific conductivity of the shallow groundwater were determined using a field multimeter (YSI EXO2 or InSitu Aqua Troll 600) with a flow-through chamber. Field parameters were recorded after at least three well volumes were removed and readings had stabilized. Field parameters were used to ensure that the water being sampled was not lake water because lake water and groundwater typically unique values of DO and specific conductance. After recording field parameters, samples for dissolved nutrients were collected by filtering the water through a 0.45-micron disk filter. All bottles were triple rinsed with filtrate before sample collection. Nutrient parameters included ammonia (NH3), as N; nitrite (NO2), as N; nitrite plus nitrate (NO2+NO3), as N; and orthophosphate (PO4), as P.
To identify the source of nutrients in the water being collected, samples were also analyzed for dissolved boron and stable isotope ratios of nitrogen and oxygen of nitrate ion. Boron indicates the presence of washing detergent, which moves conservatively during transport in groundwater (Bussey and Walter, 1996; Senior and Cinotto, 2007). Therefore, high values of dissolved boron (usually greater than 1520 µg/L; Senior and Cinotto, 2007) imply that the water being sampled is from a household source. Additionally, the relative abundance of 15N and 18O of the nitrate ion can indicate the general source of water being collected. The ratio of nitrogen isotopes 15N to 14N is commonly expressed as δ15N (delta nitrogen-15) and reported in units of parts per thousand, or per mil (‰). Mathematically, δ15N = [(Rsample – Rreference)/Rreference] × 1,000, where R is 15N/14N and reference is atmospheric N2 (Sulzman, 2007). For δ 18O, the same formula holds, but R is 18O/16O and reference is from the Vienna Standard Mean Ocean Water (Sulzman, 2007). The source of nitrate in water can be determined by plotting δ 18O and δ 15N of the nitrate ion against each other and comparing the data to published rages of these isotope ratios from sources such as the atmosphere, precipitation, soils, fertilizers, and human and animal wastes (Kendall, 1998). Generally, this is an empirical approach, and if data fall within one of these known source “boxes,” the water probably originated from that source.
Samples for nutrients and boron were sent on ice overnight to the USGS National Water Quality Lab in Lakewood, Colorado, and nitrate isotope samples were shipped frozen to the Washington State University (WSU) stable isotope lab in Pullman, Washington; all laboratory analysis followed standard procedures (Fishman, 1993; Patton and Kryskalla, 2011; Coplen and others, 2012). During each sample trip, at least one field replicate and one field blank were collected to assess data quality and variability of the data by sampling for all parameters measured at the laboratory.
After collecting water-quality samples, an estimate of vertical hydraulic gradient (VHG) was determined using a field manometer (fig. 5) following the procedures of LaBaugh and Rosenberry (2008). The VHG provides an estimate of the potential direction and magnitude of groundwater flow in the vicinity of the well screen where the samples were collected. A positive value of VHG indicates that the head pressure is greater at depth than in the surface and that vertical flow direction is from the subsurface into the lake. A negative value for VHG indicates that the head pressure is lower at depth and that vertical flow direction is from the lake to the subsurface. A neutral VHG indicates that there is no vertical flow in the vicinity of the well screen.
To estimate the VHG, the groundwater sample tubing was connected to one side of the manometer board, and the other side of the manometer was connected to tubing submersed in the lake. Water was drawn into the manometer from each side using a field peristaltic pump to remove air bubbles and sealed to allow the groundwater and lake to come to equilibrium with each other (fig. 5). A single VHG estimate would last from 5 to 30 minutes with several measurements of head difference recorded until the system came to equilibrium.
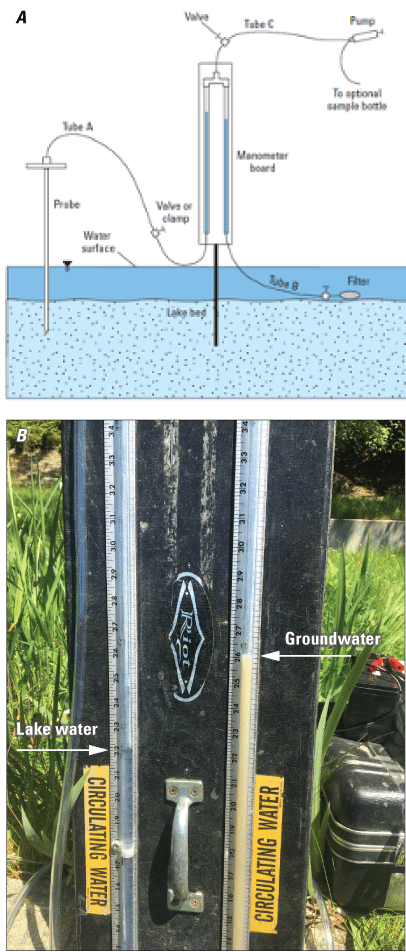
(A) Diagram of a field manometer used to determine vertical hydraulic gradients in the nearshore of Lake Spokane (from LaBaugh and Rosenberry, 2008) and (B) photograph of manometer at a study site. Photograph by Rich Sheibley, U.S. Geological Survey.
Surface Water and Regional Groundwater Data Collection
A limited set of surface water and regional groundwater samples were collected during the study in order to compare shallow groundwater chemistry to lake chemistry and nearby drinking water wells. Surface water samples were collected from each primary sample site each site visit. Lake water was collected directly from the surface using a field peristaltic pump and analyzed for nutrients, boron, and 15N and 18O isotope ratios, following the same procedures as the shallow groundwater samples. A one-time sample of 15 regional drinking water wells was conducted near the end of the study. Wells were sampled using standard USGS protocols (Kozar and Kahle, 2013; U.S. Geological Survey, 2006) and analyzed for dissolved nutrients, total phosphorus, and 15N and 18O isotope ratios.
Estimating Groundwater Discharge in the Nearshore
At primary sample sites, groundwater seepage rates (flux) were determined using manual seepage meters (Rosenberry and LaBaugh, 2008). Seepage meters are devices that isolate a small area of the lakebed and measure the flow of water across that area (fig. 6). A known volume of water is put into a flexible volume capture bag, which is housed in a small plastic container to minimize errors from wind and waves. This capture bag is attached to the end of a 6-ft-long section of garden hose that is attached to the seepage meter and a valve opened to begin recording seepage rates. By keeping the collection bag in a plastic container and away from the seepage meter, errors from wave action and people walking too close to the seepage meter are reduced (Rosenberry and others, 2020). The volume capture bag is left to sit for the collection time (15 minutes to 2 hours) and a final volume recorded. The change in volume over time is calculated and represents the net groundwater flux across the sediment-water interface. At each primary site, three to five seepage meters were installed and measured to assess site variability in groundwater flux during each site visit.
Seepage meters underestimate the actual flux across the sediment-water interface due to frictional flow loss within the meter, restrictions of flow through fittings, resistance from movement of the capture bags, and from people walking nearby (Rosenberry and LaBaugh, 2008). As a result, a correction factor can be applied to the measured seepage flux to better approximate actual flow conditions. For this study, we used a correction factor of 1.05, which was determined by Rosenberry (2005) for the same seepage meter setup that we used. Namely, a thin-walled capture bag, large-diameter tubing and fittings, extended-length hoses that minimize the presence of people walking nearby, and a capture-bag enclosure that reduces pressure waves from the surrounding water. All the original and corrected seepage flux data for this project is provided in a companion data release (Foreman and Sheibley, 2020).
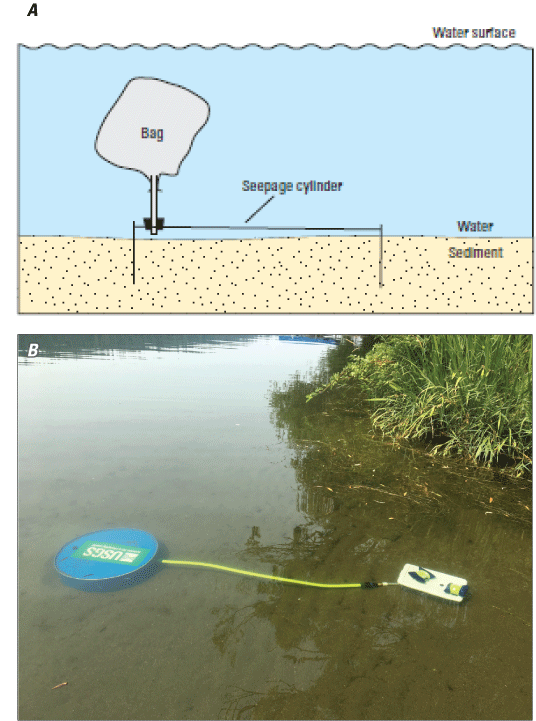
(A) Cross-section (from Rosenberry and LaBaugh, 2008) and (B) photograph of a seepage meter placed in a lake. Photograph by Rich Sheibley, U.S. Geological Survey.
Calculating Nutrient Load from Groundwater
Nutrient loads (measured in mass per time) were determined by multiplying the measured nutrient concentration and estimated groundwater seepage flux at each primary site. These site-level loads were scaled up using a representative area of groundwater discharge to determine areal nutrient fluxes along the length of Lake Spokane using geographical information system (GIS) methods similar to Simonds and others (2008) and Sheibley and others (2014). Briefly, a 50-foot-wide buffer area was delineated along the entire length of the north and south shore of the lake by copying the shoreline shapefile and offsetting it into the lake by 50 ft (fig. 7). This buffer was extended along the entire north and south shore but did not include either of the dams. Multiple widths were used to determine the most representative distance from the shoreline by comparing the shaded buffer area to aerial images of the primary sample locations. From this process, it was determined that a 50-foot-wide buffer was most inclusive of all the locations sampled for this project. Furthermore, groundwater seepage primarily occurs near the shoreline and tends to decrease with distance from shoreline (McBride and Pfannkuch, 1975; Pfannkuch and Winter, 1984), so maintaining a 50-foot buffer of the shoreline was warranted.
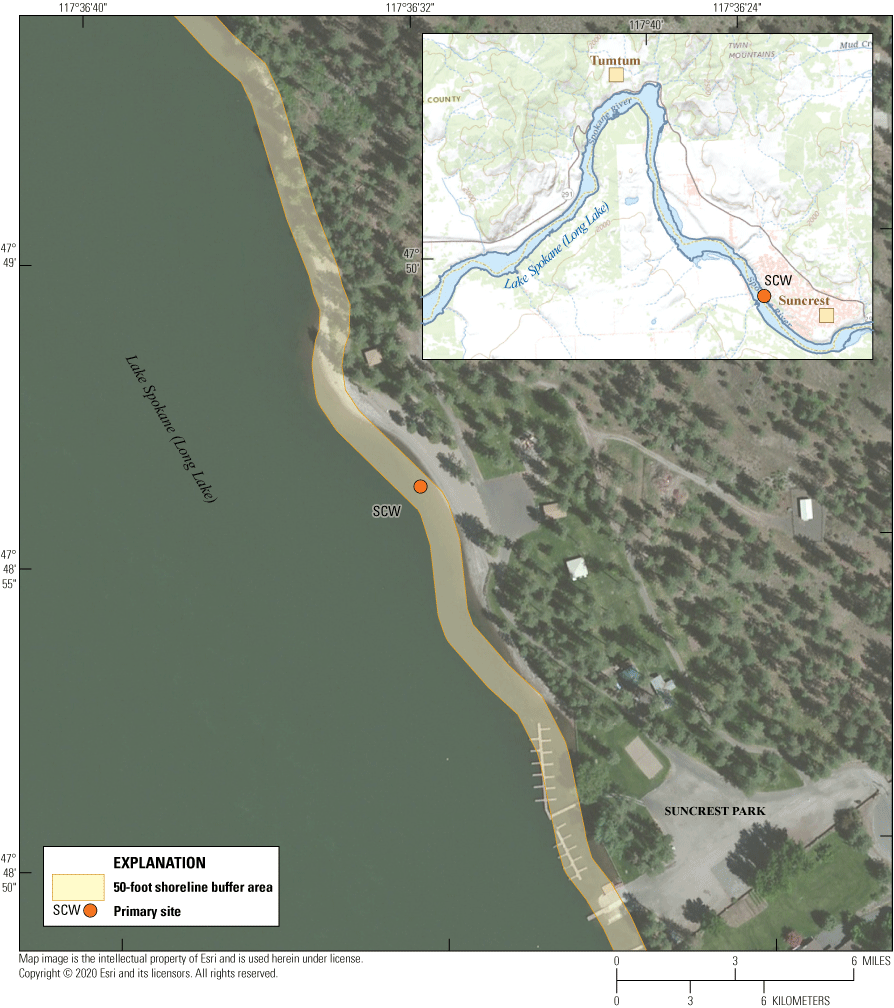
Shaded area showing the 50-foot-wide buffer at the Suncrest west (SCW) primary site, Lake Spokane, Spokane, Washington. Inset map shows the buffer (thin blue line) along the entire lake.
Methods of Data Analysis
Nutrient and seepage flux data were compared across seasons, site types (primary, secondary, lake, and well), and site groups (UND, NSD, TRD, AGR, Lake, and Well) using a non-parametric Kruskal-Wallis test for the analysis of variance across each treatment. These comparisons were combined with a post hoc Friedman’s least significant difference test to test what treatment categories were statistically different from each other (at a p-value of 0.05). The same statistical tests were used to determine if the direction of the vertical hydraulic gradient (VHG) from field manometer measurements influenced nutrient concentrations. All statistical analysis was performed using R (version 3.6.1) and RStudio (version 1.2.1335).
Analysis of Data Quality
When evaluating the data quality of a project, there are three aspects to consider: (1) quality assurance (QA) elements, (2) quality control (QC) data, and (3) overall quality assessment (Mueller and others, 2015). The QA elements refer to the procedures used to sample; for example, sampling the correct time and place, using established collection and analysis methods, and using the proper equipment for the samples being collected. The QC data are those generated from the collection and analysis of QC samples (blanks, replicates, reference materials) used to assess the error and variability of collected samples. Lastly, quality assessment is the overall evaluation of data quality based on the QA and QC elements of the project.
Quality assurance was achieved by following established USGS protocols for the preparation, collection, and processing of samples for water-quality investigations published in the National Field Manual (U.S. Geological Survey, 2018). Additionally, procedures in the QA plan of the USGS Washington Water Science Center were followed (Conn and others, 2017). Conn and others (2017) outline details for project management, periodic project reviews, data management and archiving, as well as methods for collecting and analyzing water-quality samples. For non-routine sample data collection, previously established methods were followed for the collection of shallow groundwater using temporary piezometers (Simonds and others, 2008; Moran and others, 2012; Sheibley and others, 2014) and methods for determining groundwater flux through the sediment water interface using seepage meters (Rosenberry and LaBaugh, 2008). Lastly, all laboratory methods followed standard procedures for the analysis of nutrients, boron, and nitrate isotopes (Fishman, 1993; Patton and Kryskalla, 2011; Coplen and others, 2012).
Quality-control samples taken to assess possible contamination and bias and to assess the variability during collection of field samples was measured using field blanks, field replicates, and standard reference materials. Blanks are samples prepared with water that is free of measurable concentrations of the analytes that will be analyzed by the laboratory. They are used to measure bias caused by contamination, the unintentional introduction of target analyte into the sample. Field blanks are done in the field and are used to assess possible contamination from sources through the whole process of sample collection, processing, shipping, and laboratory analysis. Field blanks were collected during each sample trip for this study using lab-certified inorganic blank water sourced from the USGS National Water Quality Laboratory. For each field blank, the same sampling setup (rigid tubing with screen mesh sample tip) that was used in the shallow piezometers was inserted into a freshly opened bottle of blank water and pumped through the tubing filtered and processed identical to environmental samples. A total of eight field blanks were collected for dissolved constituents over the course of this project (table 2), and not a single detection was recorded. This gives a high degree of confidence that contamination is less than the reporting levels and that all parameter detections in environmental samples are free of contamination bias.
Table 2.
Summary of selected constituent data in field blanks collected from October 2016 to October 2019 from shallow groundwater piezometers along the nearshore of Lake Spokane, Spokane, Washington.[Abbreviations: mg/L, milligrams per liter; N, nitrogen; P, phosphorus; ug/L, micrograms per liter]
Field replicates were also collected approximately once per field visit for a total of sevent to eight replicates analyzed for each parameter throughout the project. A field replicate is a set of two samples that are collected, processed, and analyzed such that they are considered to be the same sample and to measure the variability of the whole sample collection and analysis life cycle. Field replicates collected for this project were sequential replicates, meaning they were collected one after another and therefore included sources of variability from sample collection and processing as well as any possible temporal changes in the shallow groundwater environment (Mueller and others, 2015). A statistical evaluation of replicate variability was determined based on the standard deviation of replicate pairs. For each replicate pair, the standard deviation was determined, and an average value for each parameter over the duration of the project was calculated. This average standard deviation was then used to determine an upper and lower confidence limit based on methods of Mueller and others (2015). The 90th percentile confidence interval for all parameters was low, indicating an overall low amount of variability in the environmental data that was collected (table 3).
Table 3.
Summary of field replicate data for sampled constituents from October 2016 to October 2019 from shallow groundwater piezometers along the nearshore of Lake Spokane, Spokane, Washington.[Abbreviations: mg/L, milligrams per liter; N, nitrogen; P, phosphours; per mil, parts per thousand relative to known standard; ug/L, micrograms per liter]
Finally, the potential bias from the laboratory analysis of the stable isotope ratios of nitrate was assessed through the submission of blind standard reference samples (SRMs) submitted to the laboratory. Similar to a field blank, an SRM is used to estimate the positive or negative bias in the laboratory analysis of a given parameter to assess method performance and laboratory capability (Mueller and others, 2015). Certified SRMs were acquired from the USGS Reston Stable Isotope Laboratory (RSIL) for determination of the isotope ratios δ15N and δ 18O of nitrate in July of 2017 and again in January 2020. Two different SRMs representing different values of isotope ratios of δ 15N and δ 18O were assessed. Nitrate solutions were prepared from the SRM material at the USGS Washington Water Science Center Laboratory in Tacoma, Washington. In order to test the range of concentrations of nitrate observed in the field, two to three levels of nitrate concentrations were prepared and tested. Three replicates of all solutions made from the SRMs were sent to the WSU stable isotope lab as a blind sample to look at laboratory performance with respect to precision and bias. At the end of the project a split from some of the SRMs were also sent to the RSIL for comparison to WSU.
Stable isotope results from the WSU stable isotope lab showed good precision, with standard deviations ranging from 0.03 to 0.3 per mil in δ15N and from 0.15 to 0.67 per mil for δ18O across all SRM analyses (table 4). Comparing the lab data to the expected values from the certified SRM showed that lab values for δ15N were generally off by 1–1.5 per mil for the low-value SRM (sample USGS34) but within 0.1 per mil for the high-value SRM (sample USGS35) (table 4). For δ 18O, lab values were off by 1–2 per mil for the low-value SRM (sample USGS34) and within 1 per mil for the high value SRM (sample USGS35) (table 4). When compared to the known values of the SRMs, RSIL was closer to the expected values for the low-level SRM (sample USGS34) than it was to WSU, but for the high level SRM (sample USGS35), results were mixed. The WSU laboratory was closer to expected value than RSIL for the δ 15N values and RSIL closer for the δ 18O value. The purpose of the isotope data for this project was to compare it to published ranges in isotope values for identifying general sources of nitrate as described in Kendall (1998). Therefore, despite the 1–2 per mil bias in results from the analytical laboratory used for this project, the bias in the data is small compared to these published ranges and will not affect the interpretation of the nitrate source for this project.
Table 4.
Summary of analysis of stable isotopes ratios from Washington State University stable isotope laboratory for standard reference materials for delta 15N and delta 18O of nitrate, Lake Spokane, Spokane, Washington.[Values for 15N and 18O for USGS34 are 1.8 per mil and 27.8 per mil, respectively. Values for 15N and 18O for USGS35 are 2.7 per mil and 57.5 per mil, respectively. Abbreviations: mg/L as N, milligrams per liter as nitrogen; δ, delta]
Results
All original data (field parameters, nutrients, boron, and nitrate isotopes) are stored in the National Water Information System (NWIS) database (U.S. Geological Survey, 2021). The final dataset, which includes all water-quality data, seepage meter measurements, and values of VHG used in this report, is available as a companion data release in ScienceBase (Foreman and Sheibley, 2020).
Overall, a total of 197 samples were collected for this project across 21 different nearshore groundwater locations, 6 lake locations, and 15 nearby drinking water wells. Nutrients were detected in most samples, with the exception of ammonia, which showed up below the laboratory reporting limit of 0.01 milligrams of nitrogen per liter in 73 percent of samples. Therefore, ammonia data are not discussed further in this report. A total of 96 independent measurements of vertical hydraulic gradient (VHG) were determined in this study. Of these, 62 had positive values indicating upwelling of groundwater, 27 had negative values indicating downwelling, and 7 were neutral. There was no significant difference in median values for nitrite, orthophosphate, and boron when compared across the direction of the VHG measurement. Therefore, all the data were treated the same for the remainder of the analyses in this report.
Across all samples collected from the 21 nearshore groundwater sites, nitrate plus nitrite concentrations ranged from <0.04 to 7.60 milligrams of nitrogen per liter (table 5). Lake samples were generally lesser and drinking water wells were greater for mean and median nitrate plus nitrite concentrations when compared to nearshore groundwater (table 5). Nearshore groundwater orthophosphate concentrations ranged from <0.004 to 0.381 milligrams of phosphorus per liter, and mean and median concentrations were greater than those found in drinking-water wells and the lake surface (table 6). Boron ranged from 2.0 to 35.3 µg/L across all nearshore samples and was similar to lake samples in most cases (table 7); no boron samples were collected from the drinking water wells.
Table 5.
Summary statistics across sites for nitrate plus nitrite in milligrams of nitrogen per liter, Lake Spokane, Spokane, Washington, October 2016–October 2019.[Field identification: AGR, agricultural site; LRP, Lake Ridge Park; LSC, Lake Spokane Campground; MCA, McLellan Conservation Area; NA, not applicable; NMF, Nine Mile Falls; NS, north shore; WBR, Willow Bay Resort; NSD, Nearshore Developed; TRD, terraced residential development; UND, undeveloped; SCW, Suncrest west; SCM, suncrest middle; TUM, Tumtum. Symbol: <, less than]
Table 6.
Summary statistics across sites for orthophosphate in milligrams of phosphorus per liter, October 2016–October 2019, Lake Spokane, Spokane, Washington.[Abbreviations: AGR, agricultural site; LRP, Lake Ridge Park; LSC, Lake Spokane Campground; MCA, McLellan Conservation Area; NMF, Nine Mile Falls; NS, north shore; WBR, Willow Bay Resort; NSD, Nearshore Developed; TRD, terraced residential development; UND, undeveloped; SCW, Suncrest west; SCM, suncrest middle; TUM, Tumtum. Symbol: <, less than]
Table 7.
Summary statistics across sites for dissolved boron in micrograms per liter, October 2016–October 2019.[Abbreviations: AGR, agricultural site; LRP, Lake Ridge Park; LSC, Lake Spokane Campground; MCA, McLellan Conservation Area; NMF, Nine Mile Falls; NS, north shore; WBR, Willow Bay Resort; NSD, Nearshore Developed; TRD, terraced residential development; UND, undeveloped; SCW, Suncrest west; SCM, suncrest middle; TUM, Tumtum; —, not applical]
Seasonality of Nearshore Groundwater Data
Multiple nearshore groundwater samples were collected at each primary site during quarterly field visits in order to assess the seasonal variability of the water-quality data being collected. Data from each sampling trip was assigned a specific season as follows: October through December—autumn; January through March—winter, April through June—spring, and July through September—summer. When possible, sampling took place in the middle month of each seasonal category in order to avoid possible early or late changes in weather, which could complicate this type of categorical analysis.
Nitrate plus nitrite concentrations in nearshore groundwater did not show any seasonal variation during this study at four of the six primary sites. Sites WBR, SCW, NMF, and AGR showed no statistical differences across seasons (fig. 8). There were subtle differences in nitrate plus nitrite concentrations across seasons for LRP, with spring being statistically different from summer; however, all seasons were generally comparable, with median nitrate plus nitrite concentrations all near 0.5 milligrams of nitrogen per liter or less. There was a stronger seasonal signal in nitrate plus nitrite concentration at LSC where winter concentrations were greater than and significantly different from summer and autumn. Spring concentrations were statistically similar to all other seasons, but much closer to summer and autumn in terms of concentration values (fig. 8).
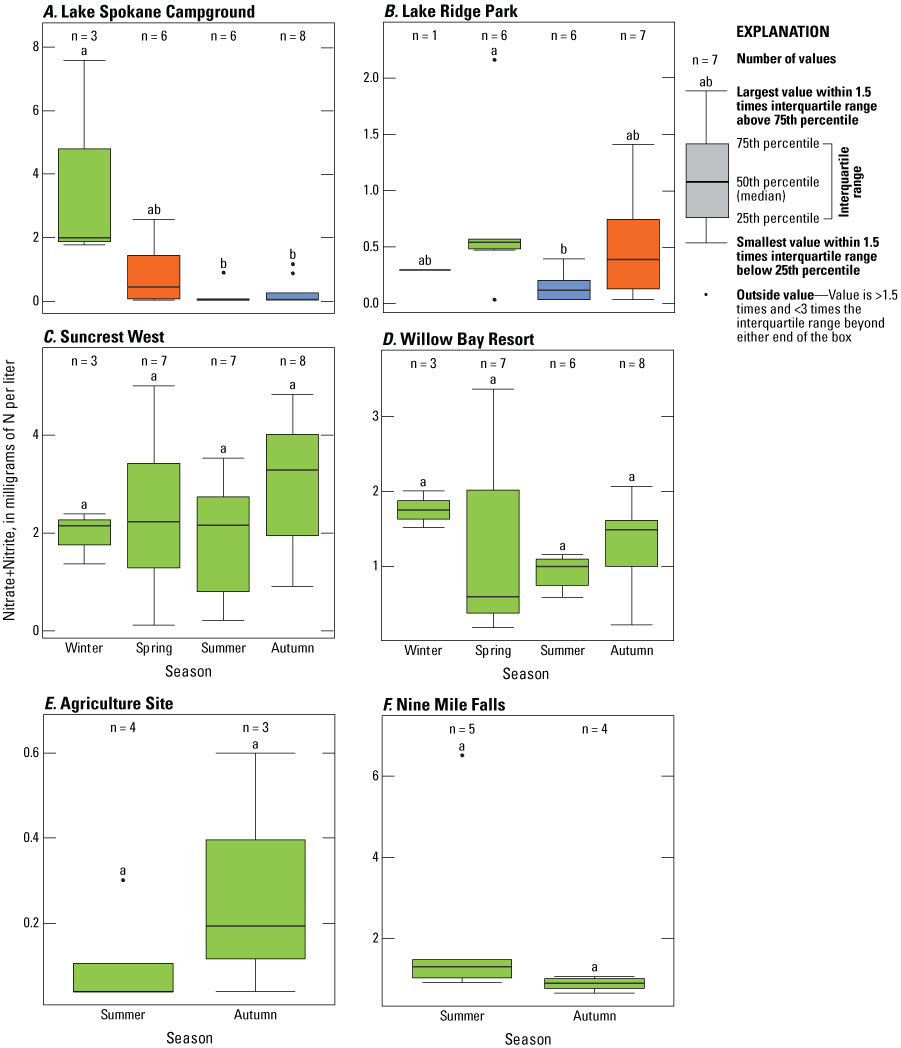
Seasonal variation of nitrate plus nitrite concentrations by season across all six primary sites, Lake Spokane, Spokane, Washington, October 2016–October 2019. Letters and colors that are the same indicate there is no statistical difference between those categories. Site locations are shown in figure 3.
For orthophosphate, nearshore groundwater concentrations were not statistically different across season at five of the six primary sites (fig. 9). WBR was the only site with any variation across season for orthophosphate, but these differences are not conclusive. For example, summer orthophosphate was different compared to autumn, but across all four seasons, there is no strong seasonal pattern.
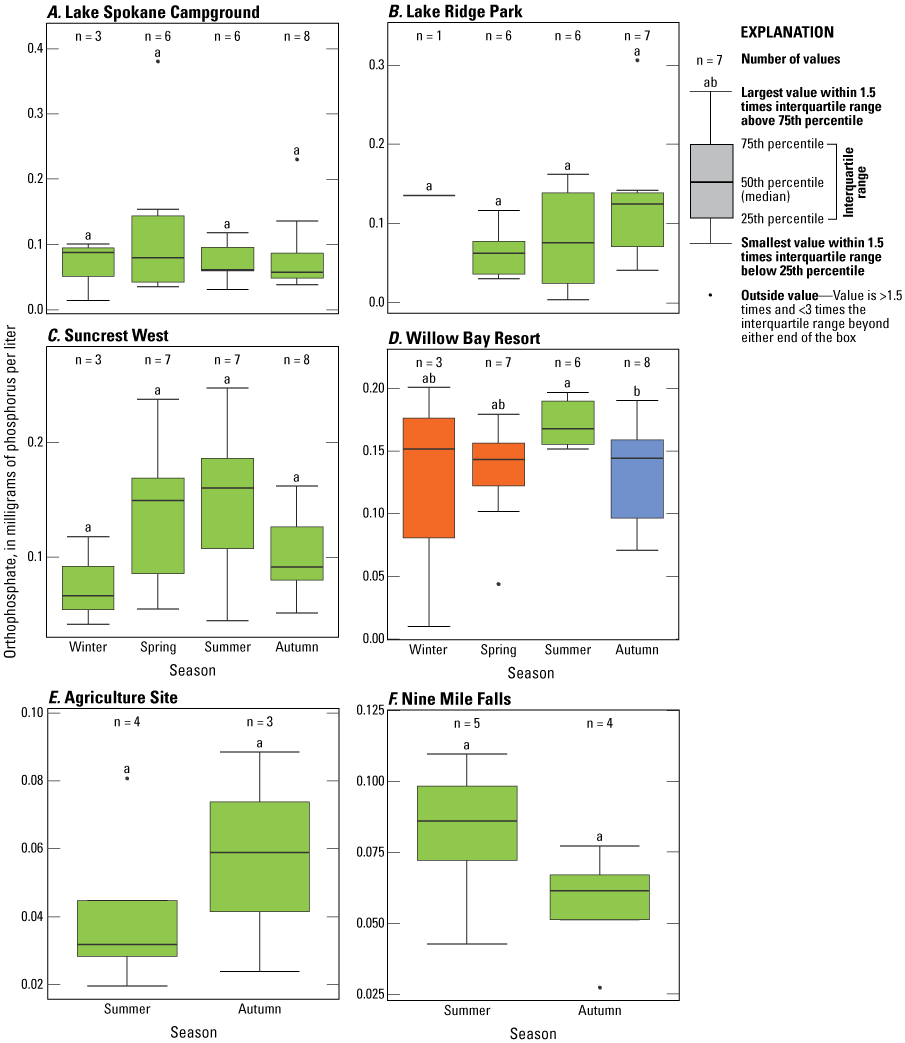
Seasonal variation of orthophosphate concentrations by season across all six primary sites, Lake Spokane, Spokane, Washington, October 2016–October 2019. Letters and colors that are the same indicate there is no statistical difference between those categories. Site locations are shown in figure 3.
Dissolved boron showed seasonal variability in nearshore groundwater at four of the six primary sites with summer concentrations being consistently higher than other seasons at those four locations (fig. 10). LRP and LSC were the only two sites that showed no seasonal variation in dissolved boron concentration of nearshore groundwater.
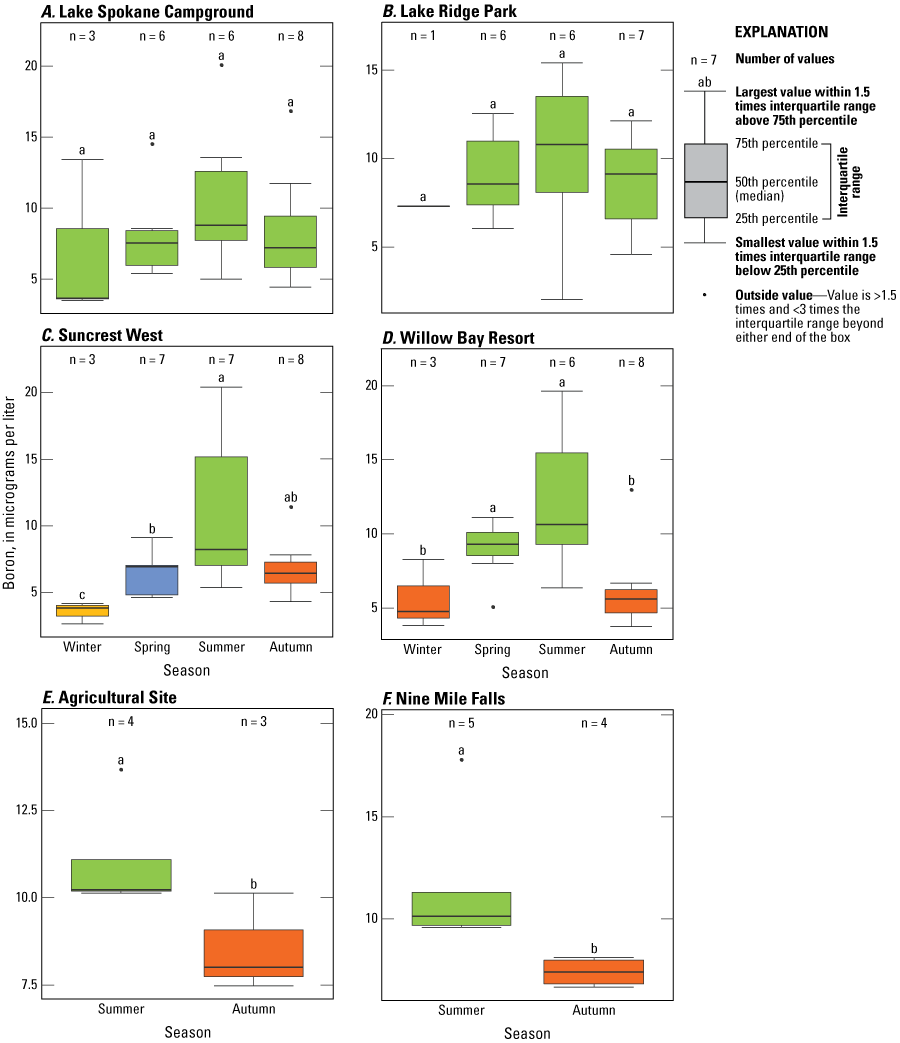
Seasonal variation of dissolved boron concentrations by season across all six primary sites, Lake Spokane, Spokane, Washington, October 2016–October 2019. Letters and colors that are the same indicate there is no statistical difference between those categories. Site locations are shown in figure 3.
Comparison of Nearshore Groundwater Data Across Site Types
Because seasonal patterns of nutrient concentrations in nearshore groundwater were absent or weak within each primary site, data from each primary site were lumped together to analyze differences across sites. For this analysis, an additional sample location from the middle of the Suncrest community (SCM) was included with the six primary sites previously summarized. Site SCM was chosen because it contained interesting data with respect to nutrients and boron, it was the only location directly adjacent to a residential bulkhead, and it had good connectivity with the groundwater. Therefore, it was assumed that SCM was a good representative of other nearshore residential areas that could not be sampled.
Nearshore groundwater nitrate plus nitrite concentrations were variable across sites (fig. 11A). Suncrest Middle and Suncrest west, the two most residential sites, were statistically greater than all other sites. The AGR site, LRP, LSC were all statistically similar and had the lowest nitrate plus nitrite concentrations. Nine Mile Falls and Willow Bay had concentrations that were between these two groups. When the data are grouped by their site group (table 1; fig. 11B), nitrate plus nitrite values are highest in the NSD group and similar to data collected from nearby drinking water wells. Samples from TRD, UND, and AGR sites, and lake sites, were all similar to each other.
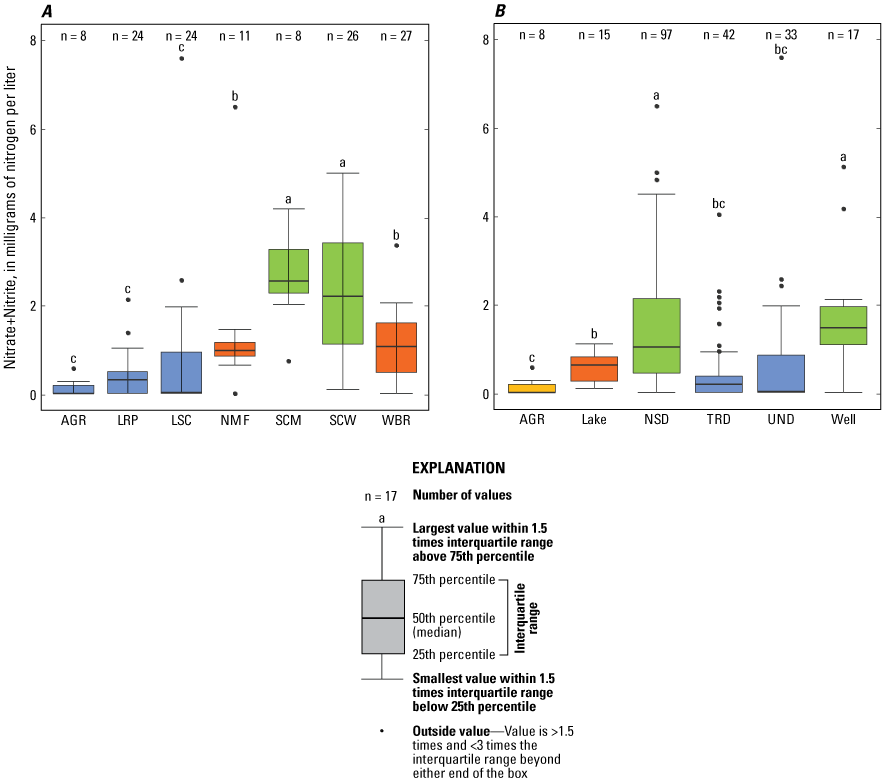
Overall comparison of nitrate plus nitrite concentrations across (A) all six primary sites and Suncrest Middle (SCM) and (B) across all site groups, Lake Spokane, Spokane, Washington, October 2016–October 2019. Letters and colors that are the same indicate there is no statistical difference between those categories. Site locations are shown in figure 3.
For orthophosphate, concentrations at SCW and WBR were similar to data from SCM but statistically greater than the other four primary sites (fig. 12A). Comparing orthophosphate across site groups, the sites located adjacent to NSD were statistically greater than all other categories (fig. 12B). Lake orthophosphate concentrations were the lowest across site groups, and data from nearby drinking water wells and terraced residential sites were statistically similar. Orthophosphate samples from undeveloped land uses was similar to those collected adjacent to agricultural land.
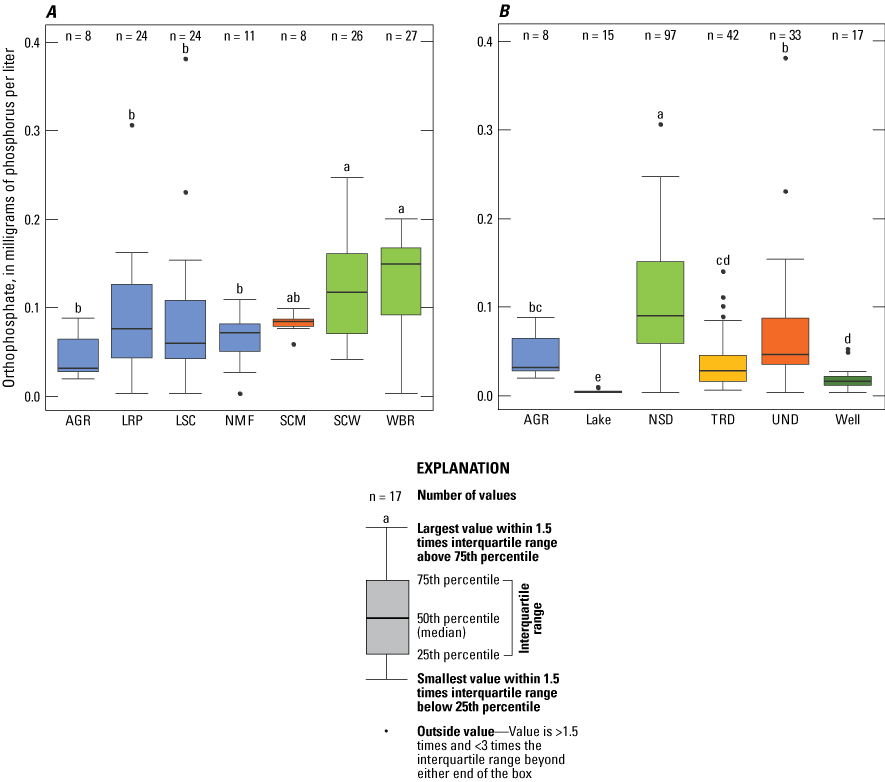
Overall comparison of orthophosphate concentrations across (A) all six primary sites and Suncrest Middle (SCM) and (B) across all site groups, Lake Spokane, Spokane, Washington, October 2016–October 2019. Letters and colors that are the same indicate there is no statistical difference between those categories. Site locations are shown in figure 3.
Dissolved boron also varied across sites with the location at Suncrest Middle being statistically greater than all other sites (fig. 13A). Boron at SCW and WBR were the lowest with all other sites being statistically similar. Interestingly, when boron data were lumped by site groups, the patterns are not clear (fig. 13B), and all groups show a similar pattern in boron concentrations. Dissolved boron concentrations from the lake are similar to concentrations in the UND, NSD, and TRD sites.
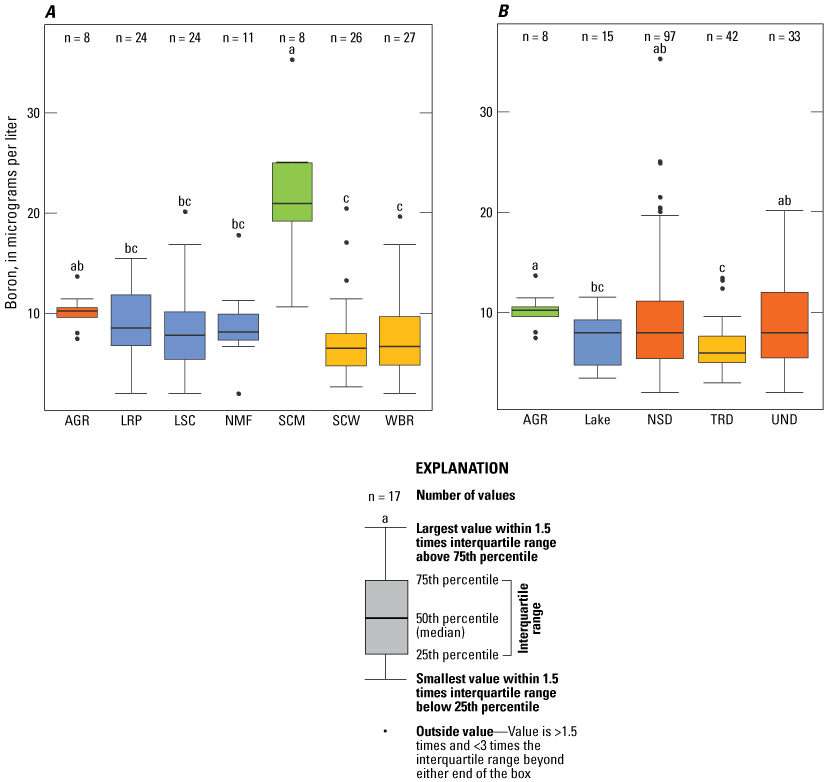
Overall comparison of dissolved boron concentrations across (A) all six primary sites and Suncrest Middle (SCM) and (B) across all site groups, Lake Spokane, Spokane, Washington, October 2016–October 2019. Letters and colors that are the same indicate there is no statistical difference between those categories. Site locations are shown in figure 3.
Sources of Nearshore Groundwater
It is evident from the boron data that some of the nearshore groundwater sampled came from a household waste stream, particularly at the SCM. For the six primary sites and the SCM, all the isotope data fall into the same general regions (fig. 14). The red box indicates the region where nitrate likely originated from animal or human waste, and most of our data fall within this area. However, this region overlaps with the area typical for soil nitrogen sources (black box). Data that spreads to the top right corner of the red box are indicative of nitrogen from animal or human waste streams that are undergoing denitrification, or conversion from nitrate to nitrogen gas.
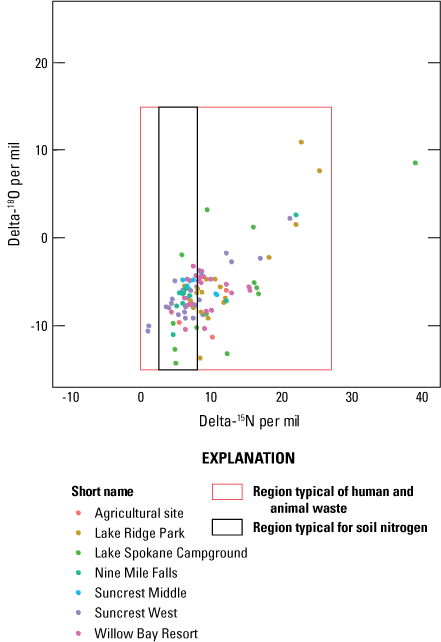
Nitrogen stable isotope data for the six primary sites and middle Suncrest, Lake Spokane, Spokane, Washington, October 2016–October 2019. The red box represents the region typical of human and animal waste, and the black box represents the region typical for soil nitrogen. AGR, Agricultural site; LRP, Lake Ridge Park; LSC, Lake Spokane Campground; NMF, Nine Mile Falls; SCM, Suncrest Middle; SCW, Suncrest west; WBR, Willow Bay Resort.
When including all the isotope data that were collected for this study and categorizing data by site group, the data fall within the same regions (fig. 15). Median values for the well and TRD sites group closely together. Additionally, UND and AGR sites also group closely. Data from the NSD and UND sites trend to higher values for 15N and to the top right corner of the red box, which is typical of an animal or human waste stream undergoing denitrification.
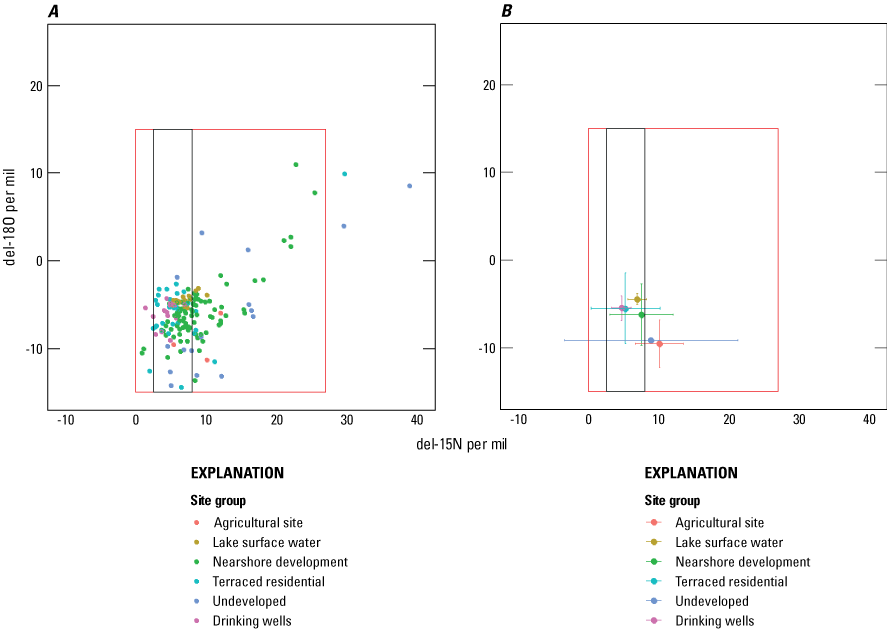
Nitrogen stable isotope data grouped by land use adjacent to samples Lake Spokane, Spokane, Washington, October 2016–October 2019. (A) All raw data from this study; (B) median values for each site group. The red box represents the region typical of human and animal waste, and the black box represents the region typical for soil nitrogen. AGR, agriculture site; Lake, lake surface water; NSD, nearshore development; TRD, terraced residential; UND, undeveloped; Well, drinking wells. Site locations are shown in figure 3.
Nearshore Groundwater Flow
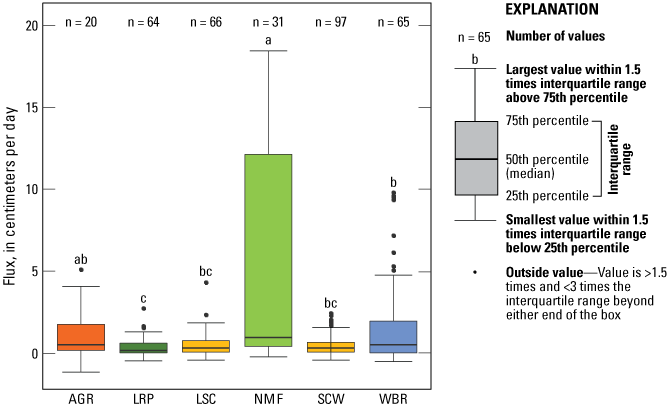
Nearshore groundwater discharge (seepage) into the lake was determined at each of the six primary sites. Seepage rates were variable within and across sites, with multiple cases where there were both positive and negative measurements were determined across the replicate meters within the same site. Generally, median flux through the lakebed was low across all sites and seasons, with most data falling below 1 cm/d and similar to the global average for lakes (Rosenberry and others, 2015). Similar to the nutrient concentration data, seasonal patterns in flux were weak, with four of the six primary sites showing only subtle statistical differences across seasons (fig. 16). At WBR, seepage rates in spring were significantly different than at other times of the year and had the highest median flux across all sites and seasons. At the AGR site, summer flux was greater than autumn, but without more data at the site it was hard to determine if this pattern would hold across multiple years.
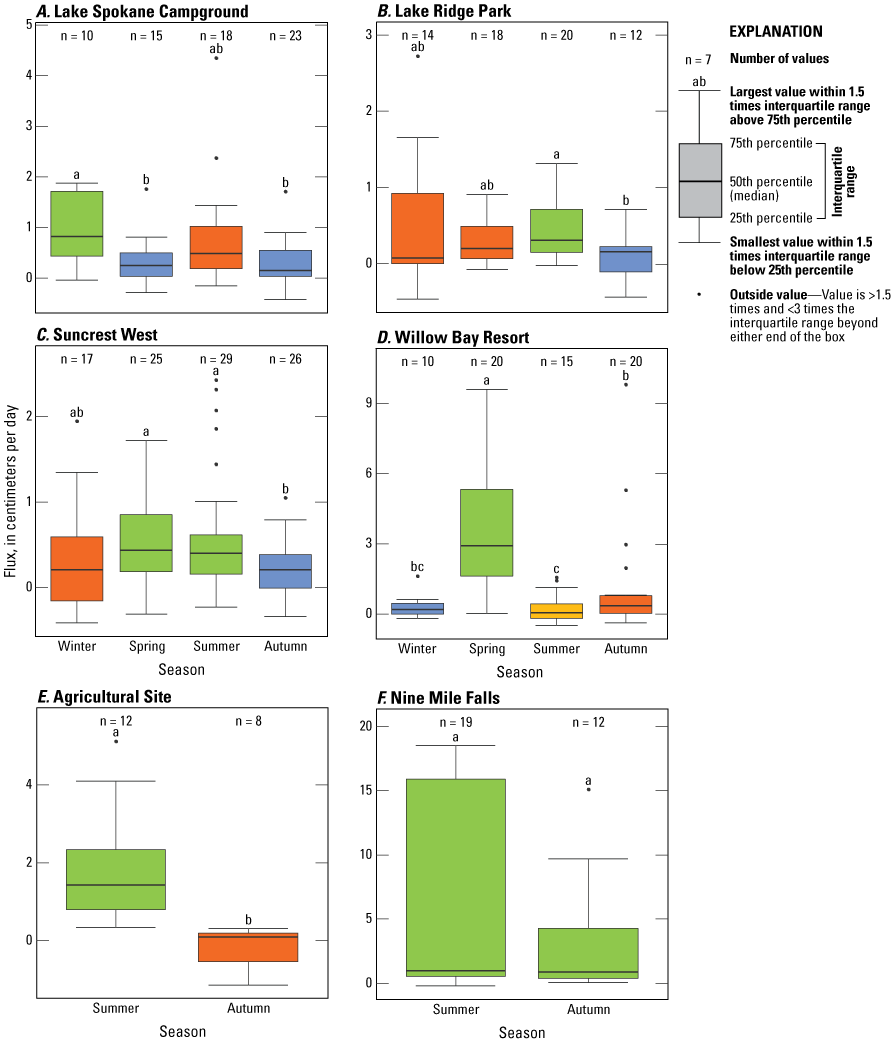
Seasonal comparison of nearshore groundwater flux determined using seepage meters at the six primary locations, Lake Spokane, Spokane, Washington, October 2016–October 2019. Letters and colors that are the same indicate there is no statistical difference between those categories. Site locations are shown in figure 3.
Cross-site comparisons of seepage rates showed that NMF was statistically similar to the AGR site, but greater than all other sites (fig. 17). Median seepage rates were less than 1.0 cm/d across all sites, and the site medians ranged from 0.19 cm/d at LRP to 0.95 cm/d at NMF (table 8). Overall, there were 343 independent measurements of seepage, with an overall median of 0.36 cm/d and a maximum value measured at NMF of 18.5 cm/d.
Table 8.
Summary statistics for nearshore groundwater seepage across the six primary sites, Lake Spokane, Spokane, Washington, October 2016–October 2019.[Abbreviations: AGR, agricultural site; LRP, Lake Ridge Park; LSC, Lake Spokane Campground; NMF, Nine Mile Falls; WBR, Willow Bay Resort; NSD, Nearshore Developed; UND, undeveloped; SCW, Suncrest West]
Comparison of nearshore groundwater flux determined using seepage meters across the six primary locations, Lake Spokane, Spokane, Washington, October 2016–October 2019. Letters and colors that are the same indicate there is no statistical difference between those categories. Site locations are shown in figure 3.
Nutrient Load Estimates
The 50-ft buffer along the shoreline of the study area was estimated using GIS to be 14,517,750 square feet. All seepage meter measurements were made within this region at the primary sample locations. Using this area and the median groundwater flux rate of 0.36 cm/d, the corresponding instantaneous median flux rate of groundwater discharge is 2.0 cubic ft3/s. A maximum flux rate of 18.5 cm/d would correspond to a discharge rate of 102 ft3/s. Nutrient loads were determined from the product of groundwater flow and a characteristic nutrient concentration. Using the median seepage flux of 2.0 ft3/s, the orthophosphate load ranged from a median load of 0.7 to a maximum load of 4.0 pounds of phosphorus per day based on the median and maximum orthophosphate concentrations, respectively (table 9). For nitrate plus nitrite, loads ranged from a median load of 6.0 to a maximum load of 80.4 pounds of nitrogen per day (table 9).
Table 9.
Nutrient load estimates from groundwater along the north and south shores of Lake Spokane using the median seepage flux, Spokane, Washington, October 2016–October 2019.[Median seepate flux: This flux combined with buffer area of 14,527,750 square feet is equivalent to 2.0 cubic feet per second. Abbreviations: cm/day, centimeters per day; mg/L, milligrams per liter; pounds/day, pounds per day]
Estimates of maximum values for nitrogen and phosphorus loads were also determined by substituting the median seepage flux with the maximum value of seepage flux from NMF. Maximum orthophosphate loads ranged from 37 to 207 pounds of phosphorus per day, and maximum nitrate plus nitrite loads ranged from 311 to 4,140 pounds of nitrogen per day based on the median and maximum concentrations from the study (table 10). The buffer areas for the north and south shore were almost the same, each contributing about 50 percent to the total buffer area. The similar loading from the north and south shores combined with nutrient concentrations being similar on both the north and south shores imply that nutrient loads do not differ greatly between the two shorelines. However, the north shore portion of the study included a longer time period and more primary sample sites, so if additional sampling on the south shore takes place in the future this might change.
Table 10.
Nutrient load estimates from groundwater along the north and south shores of Lake Spokane using the maximum seepage flux, Spokane, Washington, October 2016–October 2019.[Maximum seepage flux: This flux combined with buffer area of 14,527,750 square feet is equivalent to 102 cubic feet per second. Abbreviations: cm/day, centimeters per day; mg/L, milligrams per liter; pounds/day, pounds per day]
Discussion
To date, this study was the most complete attempt at characterizing nearshore groundwater nutrient concentrations in Lake Spokane. Previous work assumed groundwater nutrient concentrations entering the lake were equal to concentrations in nearby deep wells (Soltero and others, 1992). The USGS completed a recent study of nearshore groundwater sampling but was limited to a one-time sample during the spring (Gendaszek and others, 2016). Furthermore, no study has attempted to make any direct measurements of groundwater flow through the lakebed, a necessary variable for estimating groundwater nutrient loading to the lake. The current study addresses these shortcomings by sampling seasonally over a 3-year period with the inclusion of groundwater flow estimates using direct measurements from seepage meters.
Overall, there was a lack of strong seasonal variation in nitrate plus nitrite and orthophosphate concentrations in this study. Although there were subtle differences across seasons at a few primary sampling locations, these patterns were not consistent. Plastino (2016) made a similar finding, extending the spring nearshore groundwater sampling of Gendaszek and others (2016) through the summer months and finding no strong differences in nutrient concentrations at a number of locations. Overall, median nearshore groundwater nitrate plus nitrite concentration was 0.57 milligrams per liter nitrogen, and median nearshore orthophosphate concentration was 0.068 milligrams per liter phosphorus. The mean and median concentrations were lower for nitrate plus nitrite and higher for orthophosphate in this study compared to the previous study conducted by Gendaszek and others (2016), but both studies generally showed comparable data overall (tables 5 and 6).
Dissolved boron showed some seasonal differences across a few of the primary sampling sites. At WBR and SCW, summer dissolved boron concentrations were higher than other seasonal concentrations. These were two locations categorized with nearshore developed land adjacent to their sample sites. As mentioned previously in this report, boron can be used as an indicator of household waste because it is found in detergents and can move conservatively in groundwater (Bussey and Walter, 1996; Senior and Cinotto, 2007). Senior and Cinotto (2007) suggested that dissolved boron concentrations over 15–20 µg/L may indicate that groundwater is from household waste. The one location where dissolved boron was consistently in this range was at a site within the Suncrest community (SCM; fig. 13). This site was located in an area of nearshore residential properties and just lakeward of a bulkhead and had the highest boron concentration of the study, exceeding 30 µg/L. At this site, nitrate plus nitrite was significantly greater than it was at the primary sampling locations (fig. 11), but orthophosphate was comparable or lower than at the primary sampling locations (fig. 12). Taken together, those two characteristics suggest that groundwater near areas of residential development is potentially reaching the lake and carrying elevated loads of nitrate plus nitrite, but not necessarily phosphorus. This behavior is not surprising since nitrate is mobile in groundwater, whereas phosphorus tends to attach to particles, thus slowing its transport in groundwater systems. Additionally, the seasonal response of boron at several of the NSD sites implied that, as use of these areas increases in spring and summer, groundwater discharge can reach the lake relatively fast.
Besides dissolved boron, stable isotopes of nitrate (15N and 18O) were used to identify the source of the nearshore water that was collected. Scatter plots of these isotopes are often used to identify the water source based on known published ranges from different nitrate endpoints. For this study, the isotope approach showed that most of the samples collected were typical of either soil nitrogen or human and animal wastes. No single sample location or type of sample (residential, undeveloped) stood out from the rest of the data. However, isotope data from TRD sites and from deep drinking water wells were comparable and indicated they share a common source (fig. 15).
Over 300 independent measurements of groundwater seepage flux were made across the six primary study locations. Similar to nearshore nutrient concentrations, the groundwater seepage flux did not show strong seasonal patterns across most of the locations (fig. 16). Spring seepage flux at WBR was significantly greater than all other seasons, with a median flux of 2.93 cm/d. Spring is a time of year when regional groundwater tables are higher because of seasonal rain and snow (and snowmelt) patterns. If the groundwater table rises, it can lead to a greater potential for increased seepage through the lakebed. Higher local groundwater tables could also explain the subtle seasonal pattern observed at Suncrest West, where both spring and summer seepage fluxes were higher than autumn and winter fluxes, although these differences were not always statistically significant. Additionally, both WBR and SCW showed increased dissolved boron during the spring/summer, which indicated that the seepage flux may be carrying household wastewater. However, even though there was evidence that seepage flux in spring can lead to an increase in household wastewater in summer, groundwater does not appear to be carrying elevated nutrients, as seasonal patterns in nitrate plus nitrite and orthophosphate are not evident at these two locations (figs. 8 and 9).
For the AGR site, summer seepage flux was significantly greater than autumn flux. The increased seepage flux at the AGR site could be related to irrigation patterns where higher growing season irrigation could result in a temporary increase in the local water table, which can translate into increased flux through the neighboring lakebed. However, this site was only sampled for two seasons, so it is unclear if this pattern would continue if sampling was conducted for a full water year. Similar to SCW and WBR, the increase in summer flux at the AGR site did not carry increased nutrient loads (figs. 8 and 9).
Using a 50-ft-wide shoreline buffer for the entire north and south shorelines, the median groundwater seepage flux was determined to be 2.0 ft3/s, with a maximum value of 102 ft3/s. Compared to the inflow from the Spokane River or the Little Spokane River, this maximum seepage rate is comparatively less. Summer low flows in the Little Spokane River can be as small as 350–400 ft3/s, which is three to four times greater than the estimated maximum groundwater seepage flux of 102 ft3/s, while the flow in the Spokane River entering the lake is an order of magnitude or more greater throughout the year. Additionally, the method used to scale seepage flux from our primary sample locations assumes that (1) the groundwater seepage flux is constant in time and (2) that groundwater seepage is occurring everywhere within a 50-ft-wide buffer of the entire lake. Both of these assumptions are unrealistic; in fact, Soltero and others (1992) described no-flow regions of the shoreline where bedrock was present when they developed the first nutrient budget for the lake. From their study, it was determined that approximately 14 percent of the total shoreline (north and south shores combined) was characterized as having no-flow. Therefore, nutrient loads from this study could be corrected downwards based on the no-flow conditions presented in Soltero and others (1992); however, by maintaining the two assumptions listed above, load estimates for the current study allow for a “worse-case” scenario for determining the impacts from groundwater nutrient loads.
Loads of nitrogen in the form of nitrate plus nitrite ranged from 6.0 to 80.4 pounds of nitrogen per day based on the median groundwater seepage flux of 2.0 ft3/s. For phosphate, the orthophosphate load ranged from 0.7 to 4.0 pounds per day based on the median groundwater seepage flux. These values are within the range of groundwater nutrient loads in Vancouver Lake in southwestern Washington where the monthly average load of nitrogen was 18 pounds of nitrogen per day and 4 pounds per day for phosphorus (Sheibley and others, 2014). Using the maximum value for seepage flux and the maximum measured concentration, limits on the maximum nutrient load were 4,140 pounds of nitrogen per day and 207 pounds of phosphorus per day.
Ecology collects water-quality samples year-round at the Little Spokane River (station 55B070) and the Spokane River below Nine Mile Dam (station 45A090). During the same time period as the current study (October 2016–October 2019), nitrate plus nitrite concentrations at Little Spokane River ranged from 0.55 to 1.33 milligrams per liter and ranged from 0.56 to 1.75 milligrams per liter below Nine Mile Dam on the Spokane River. For orthophosphate, the Ecology data at Little Spokane River ranged from 0.006 to 0.033 milligrams of phosphorus per liter and from 0.003 to 0.030 milligrams per liter phosphorus at the Spokane River below Nine Mile Dam. These data are comparable and within the range of nutrient concentrations of the shallow groundwater from this study. Furthermore, mean summer discharge of the Little Spokane River at USGS streamgage 12431000 (Little Spokane River at Dartford, WA) is 450 ft3/s and at USGS streamgage 1242600 (Spokane River below Nine Nine Mile Dam at Spokane, WA) is 5,400 ft3/s. This These flows correspond to mean summer nutrient loads of 14–79 pounds of phosphorus per day and 1,324–3,200 pounds of nitrogen per day for the Little Spokane River and mean summer nutrient loads ranged from 86–866 pounds per day of phosphorus and 16,200–50,500 pounds of nitrogen per day for the Spokane River below Nine Mile Dam. For context, the load allocation for total phosphorus for the Little Spokane River from the 2010 TMDL ranged from 32 to 102 pounds per day of phosphorus (Moore and Ross, 2010).
Median values of shallow groundwater nutrient load from the current study are only a few percent of the summer load from the Little Spokane River and less than a percent of the nutrient load from the Spokane River below Nine Mile Dam. Additionally, shallow groundwater nutrient loads of phosphorus from this study are 3 percent or less of the loads allocated to the Little Spokane River for the 2010 TMDL (Moore and Ross, 2010).
To date, there are only two known studies of nutrient loading to Lake Spokane; a comprehensive nutrient budget completed by Soltero and others (1992) and the final TMDL report used to establish load allocations of phosphorus to the lake (Moore and Ross, 2010). In both of these studies, phosphorus loads were presented in terms of total phosphorus. In the current study, loads were determined based on orthophosphate, which does not include particulate or organic phosphorus because groundwater transport of nutrients is primarily in the inorganic, non-particulate form. Additionally, this study design was based on the installation of temporary piezometers, which are prone to include particulate material when groundwater is collected. Lastly, the inorganic form of phosphorus is used for plant and algae growth, so estimating loads based on inorganic nutrient forms was important. In order to reconcile the difference between load estimates using total phosphorus from Soltero and others (1992) and the 2010 TMDL and the current study, a comparison of total phosphorus to orthophosphorus was determined from the well samples that were collected in October 2018. These sites were long-term “stable” drinking water wells so disruption of the soil matrix around the well screen when sampling should be minimized, resulting in a lower chance of pulling mobile particles into the sample leading to an artificial increase in total phosphorus. For the nearshore groundwater piezometers, installation of the sampler is disruptive and, even though water was sampled at a slow flowrate and not collected until the water cleared, it was not possible to eliminate newly mobile soil/sediment particles from samples. The drinking well data showed close agreement between total phosphorus and orthophosphate, with only one sample falling far from the one to one line (fig. 18). Addtionally, Gendaszek and others (2016) analyzed their nearshore groundwater samples for both orthophosphate and total dissolved phosphate, and most of their samples showed these two parameters were similar. Therefore, we assumed that the orthophosphate loads determined in this study closely matches the total phosphorus load and are comparable to past studies (Soltero and others, 1992; Moore and Ross, 2010).
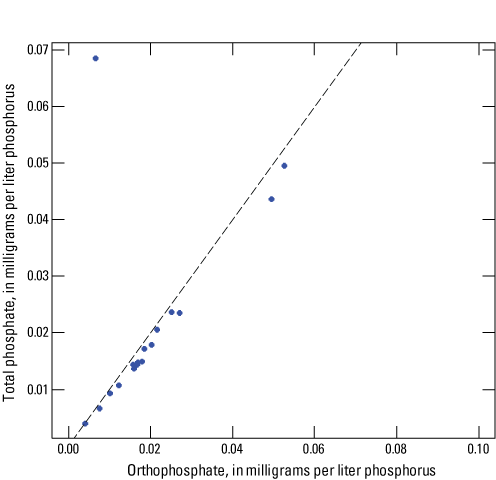
Comparison of total phosphorus and orthophosphate in drinking-water wells, Lake Spokane, Spokane, Washington, October 2018. The dashed line represents the one-to-one line where the two values are equal.
Soltero and others (1992) used hydraulic gradients and water sampling from a series of deep (~20–60 ft) wells that were installed around the lake. They combined this information with estimates for the subsurface area of groundwater flow from the landscape to the lake across 41 different lake shoreline segments. Their overall annual average groundwater flow to the lake was estimated to be 111 ft3/s. Well data for total phosphorus ranged from 0.023 to 0.654 milligrams per liter of phosphorus and from 0.23 to 14.0 milligrams per liter of nitrogen for nitrate. These data translated into a load of 14–388 pounds per day of phosphorus and 136–8,312 pounds per day of nitrogen (table 11). These values are greater than those determined using the median seepage flux in the current study but are comparable to the calculated loads using the maximum seepage flux.
Table 11.
Comparison of groundwater nutrient loads across studies, Lake Spokane, Spokane, Washington.[Abbreviations: ft3/s, cubic feet per second; mgN/L, milligrams of nitrogen per liter; mgP/L, milligrams of phosphorus per liter]
| Study | Groundwater discharge (ft3/s) |
Nitrate concentration (mgN/L) |
Daily nitrate load (pounds/day) |
Total phosphorus concentration (mgP/L) |
Daily phosphorus load (pounds/day) |
|---|---|---|---|---|---|
| Soltero and others (1992) | 1111 | 0.23–14.0 | 136–8,312 | 0.023–0.654 | 14–388 |
| Moore and Ross (2010) | 180–5882 | — | — | 0.025 | 24–79 |
| This study (median flow) | 2.0 | 0.57–7.60 | 6.0–80.4 | 0.068–0.3813 | 0.7–4.0 |
| This study (maximum flow) | 102 | 0.57–7.60 | 311–4,140 | 0.068–0.3813 | 37–207 |
The DO TMDL was designed to limit total phosphorus concentrations in the lake to 50µg P/L, with a special condition that the average euphotic zone concentration of the lake is less than 25 µg P/L. For comparison, DO samples of the lake collected for the current study from the euphotic zone ranged from 4 to 10 µg P/L (table 6). The groundwater load allocation to the lake was determined by setting a limit on groundwater phosphorus concentration to 25 µg P/L and balancing the hydrologic budget from the model by adjusting the groundwater inflow and outflow terms. The TMDL study did not focus on nitrogen, so only comparisons to phosphorus loads are made here. Additionally, the TMDL model only focused on the growing season from May through October, and the TDML study presented loads based on three key time periods: the average of March–May, June only, and the average of July–October. Modeled groundwater inflow to the lake was 588 ft3/s from March to May, 225 ft3/s in June, and 180 ft3/s from July through October. These modeled values are much greater than the median groundwater seepage flux (1.9 ft3/s) and two times greater or more than the maximum seepage flux (97 ft3/s) determined in the current study.
Total phosphorus loads ranged from 24 to 79 pounds of phosphorus per day from the TMDL model and were much greater than those from the loads using median seepage flux (table 11). However, the TMDL phosphorus loads are comparable, or even less than those determined from the maximum seepage flux in the current study. The main reason for this close comparison at higher seepage flux is related to concentration; the median nearshore groundwater concentration in this study (0.068 milligrams of phosphorus per liter) is almost three times greater than the limit set in the TMDL model (0.025 milligrams of phosphorus per liter).
Summary
Nearshore groundwater nutrients and seepage flux were determined for a 3-year period along the shoreline of Lake Spokane. Overall, there was not a strong seasonal pattern in nutrient concentration or seepage flux during this study. However, where there were seasonal increases in groundwater flux, this groundwater did not consistently carry elevated nutrients. Dissolved boron at a site located within the Suncrest community showed strong evidence that some household wastewater was reaching the lake, but there was no concomitant increase in phosphorus at the site. Nutrient loading from groundwater to the lake was variable but generally lower than previous estimates from past loading studies. Taken together, the data show that groundwater is contributing nutrients to the lake but, for now, not at levels comparable to other nutrient sources. The estimates from this study could be improved by conducting additional investigations during spring to summer at more locations to help better establish limits on groundwater seepage and nutrient concentrations. Because some have speculated that the soil retention capacity of phosphorus has not reached its limit in areas sampled in this study, continued periodic nearshore groundwater sampling would help inform resource managers if nutrient-load characteristics in the groundwater system around Lake Spokane changes through time.
Acknowledgments
We thank several individuals that helped make this project a success: Karin Baldwin at the Department of Ecology for managing this project in the earlier stages; Charlie Kessler from Steven County Conservation District for help and support throughout the project; Walt Edelen for facilitating the additional work on the south shore; Fred Mashtare for providing access to the lake at Suncrest Park throughout the study; members of Lake Ridge Park Association and Willow Bay Resort for allowing access to sample sites; and John Ashley from the State of Washington Parks and Recreation Commission for help accessing sample locations on Lake Spokane, especially in the off season. The authors also thank I.M. Fletcher for his continual support and assistance behind the scenes throughout the project. Finally, the authors thank U.S. Geological Survey personnel Steve Cox, Don Rosenberry, and Kathy Conn for their thorough reviews of the draft of this report.
References Cited
Conn, K.E., Huffman, R.L., and Barton, C., 2017, Quality-assurance plan for water-quality activities in the U.S. Geological Survey Washington Water Science Center: U.S. Geological Survey Open-File Report 2017–1044, 66 p., https://doi.org/10.3133/ofr20171044.
Bussey, K.W., and Walter, D.A., 1996, Spatial and temporal distribution of specific conductance, boron, and phosphorus in a sewage-contaminated aquifer near Ashumet Pond, Cape Cod, Massachusetts: U.S. Geological Survey Open-File Report 96–472, 56 p., https://doi.org/10.3133/ofr96472.
Coplen, T.B., Qi, H., Révész, K., Casciotti, K., and Hannon, J.E., 2012, Determination of the δ15N and δ18O of nitrate in water; RSIL lab code 2900, chap. 17 of Stable isotope-ratio methods, sec. C of Révész, K., and Coplen, T.B. eds., Methods of the Reston Stable Isotope Laboratory (slightly revised from version 1.0 released in 2007): U.S. Geological Survey Techniques and Methods, book 10, 35 p., available only at https://pubs.usgs.gov/tm/2006/tm10c17/. (Supersedes version 1.0 released in 2007.)
Fishman, M.J., ed., 1993, Methods of analysis by the U.S. Geological Survey National Water Quality Laboratory—Determination of inorganic and organic constituents in water and fluvial sediments: U.S. Geological Survey Open-File Report 93–125, 217 p., https://doi.org/10.3133/ofr93125.
Foreman, J.R and Sheibley, R.W., 2020, Water quality and seepage estimates collected at Lake Spokane, Washington, 2016–19: U. S. Geological Survey data release, https://doi.org/10.5066/P95IQ8HH.
Gendaszek, A.S., Cox, S.E., and Spanjer, A.R., 2016, Preliminary characterization of nitrogen and phosphorus in groundwater discharging to Lake Spokane, northeastern Washington, using stable nitrogen isotopes: U.S. Geological Survey Open-File Report 2016–1029, 22 p., https://doi.org/10.3133/ofr20161029.
Kendall, C., 1998, Tracing nitrogen sources and cycling in catchments, in Kendall, C., and McDonnell, J.J., eds., Isotope tracers in catchment hydrology: Amsterdam, Elsevier Science, p. 519–576., https://doi.org/10.1016/B978-0-444-81546-0.50023-9.
Kozar, M.D., and Kahle, S.C., 2013, Quality-assurance plan for groundwater activities, U.S. Geological Survey, Washington Water Science Center: U.S. Geological Survey Open-File Report 2013–1151, 88 p., https://pubs.usgs.gov/ofr/2013/1151/.
Moran, P.W., Cox, S.E., Embrey, S.S., Hufffman, R.L., Olsen, T.D., and Fradkin, S.C., 2013, Sources and sinks of nitrogen and phosphorus to a deep, oligotrophic lake, Lake Crescent, Olympic National Park, Washington: U.S. Geological Survey Scientific Investigations Report 2012–5107, 56 p., https://pubs.usgs.gov/sir/2012/5107/.
Mueller, D.K., Schertz, T.L., Martin, J.D., and Sandstrom, M.W., 2015, Design, analysis, and interpretation of field quality-control data for water-sampling projects: U.S. Geological Survey Techniques and Methods, book 4, chap. C4, 54 p., https://dx.doi.org/10.3133/tm4C4.
Pfannkuch, H.O., and Winter, T.C., 1984, Effect of anisotropy and groundwater system geometry on seepage through lakebeds—1. Analog and dimensional analysis—Amsterdam: Journal of Hydrology (Amsterdam), v. 75, nos. 1-4, p. 213–237, https://doi.org/10.1016/0022-1694(84)90051-9.
Rosenberry, D.O., 2005, Integrating seepage heterogeneity with the use of ganged seepage meters: Limnology and Oceanography, Methods, v. 3, no. 2, p. 131–142, https://doi.org/10.4319/lom.2005.3.131.
Rosenberry, D.O., and LaBaugh, J.W., 2008, Field techniques for estimating water fluxes between surface water and ground water: U.S. Geological Survey Techniques and Methods 4-D2, 128 p., https://doi.org/10.3133/tm4D2.
Rosenberry, D.O., Lewandowski, J., Meinikmann, K., and Nützmann, G., 2015, Groundwater – the disregarded component in lake water and nutrient budgets. Part 1—Effects of groundwater on hydrology: Hydrological Processes, v. 29, no. 13, p. 2895–2921, https://doi.org/10.1002/hyp.10403.
Rosenberry, D.O., Duque, C., and Lee, D.R., 2020, History and evolution of seepage meters for quantifying flow between groundwater and surface water—Part 1–Freshwater settings: Earth-Science Reviews, v. 204, p. 103167, https://doi.org/10.1016/j.earscirev.2020.103167.
Senior, L.A., and Cinotto, P.J., 2007, Effect of on-site wastewater disposal on quality of ground water and base flow—A pilot study in Chester County, southeastern Pennsylvania, 2005: U.S. Geological Survey Open-File Report 2007–1253, 50 p., https://doi.org/10.3133/ofr20071253.
Simonds, F.W., Swarzenski, P.W., Rosenberry, D.O., Reich, C.D., and Paulson, A.J., 2008, Estimates of nutrient loading by ground-water discharge into the Lynch Cove area of Hood Canal, Washington: U.S. Geological Survey Scientific Investigations Report 2008–5078, 54 p., https://doi.org/10.3133/sir20085078.
Soltero, R.A., Sexton, L.M., Wargo, L.L., Geiger, D.D., Robertson, K.J., and Bolstad, K.E., 1992, Assessment of nutrient loading sources and macrophyte growth in Long Lake (Lake Spokane), WA and the feasibility of various control measures: Cheney, Washington, Eastern Washington State College, 753 p.
Sulzman, E.W., 2007, Stable isotope chemistry and measurement—A Primer, in Michener, R., and Lajtha, K., eds., Stable isotopes in ecology and environmental science 2nd ed.: Malden, Massachusetts, Blackwell Publishing, p. 1–18., https://doi.org/10.1002/9780470691854.ch1.
U.S. Geological Survey, 2018, General introduction for the “National Field Manual for the Collection of Water-Quality Data” (ver. 1.1, June 2018): U.S. Geological Survey Techniques and Methods, book 9, chap. A0, 4 p., https://doi.org/10.3133/tm9A0.
U.S. Geological Survey, 2006, Collection of water samples: U.S. Geological Survey Techniques of Water Resources Investigations, book 9, chap. A4, 33 p., https://doi.org/10.3133/twri09A4.
U.S. Geological Survey, 2021, National water information system: U.S. Geological Survey, web interface, accessed April 5, 2020, at http://dx.doi.org/10.5066/F7P55KJN.
Conversion Factors
U.S. customary units to International System of Units
International System of Units to U.S. customary units
Datums
Vertical coordinate information is referenced to the North American Vertical Datum of 1988 (NAVD 88).
Horizontal coordinate information is referenced to the North American Datum of 1983 (NAD 83).
Elevation, as used in this report, refers to distance above the vertical datum.
Supplemental Information
Specific conductance is given in microsiemens per centimeter at 25 degrees Celsius (µS/cm at 25 °C).
Concentrations of chemical constituents in water are given in either milligrams per liter (mg/L) or micrograms per liter (µg/L).
Abbreviations
AGR
agriculture site or agricultural land use
DO
dissolved oxygen
GIS
Geographic Information System
LRP
Lake Ridge Park
LSC
Lake Spokane Campground
NMF
Nine Mile Falls
NSD
nearshore developed
NWIS
National Water Information System
QA
quality assurance
QC
quality control
RSIL
Reston Stable Isotope Laboratory
SCM
Suncrest middle
SCW
Suncrest west
SRM
standard reference material
TMDL
total maximum daily load
TRD
terraced residential development
UND
undeveloped
USGS
U.S. Geological Survey
VHG
vertical hydraulic gradient
WBR
Willow Bay Resort
WSU
Washington State University
Publishing support provided by the U.S. Geological Survey
Science Publishing Network, Tacoma Publishing Service Center
For more information concerning the research in this report, contact the
Director, Washington Water Science Center
U.S. Geological Survey
934 Broadway, Suite 300
Tacoma, Washington 98402
Suggested Citation
Sheibley, R.W., and Foreman, J.R., 2021, Nitrogen and phosphorus loads from groundwater to Lake Spokane, Spokane, Washington, October 2016–October 2019: U.S. Geological Survey Scientific Investigations Report 2021–5023, 34 p., https://doi.org/10.3133/sir20215023.
ISSN: 2328-0328 (online)
Study Area
| Publication type | Report |
|---|---|
| Publication Subtype | USGS Numbered Series |
| Title | Nitrogen and phosphorus loads from groundwater to Lake Spokane, Spokane, Washington, October 2016–October 2019 |
| Series title | Scientific Investigations Report |
| Series number | 2021-5023 |
| DOI | 10.3133/sir20215023 |
| Year Published | 2021 |
| Language | English |
| Publisher | U.S. Geological Survey |
| Publisher location | Reston, VA |
| Contributing office(s) | Washington Water Science Center |
| Description | Report: vii, 34 p.; Data Release |
| Country | United States |
| State | Washington |
| Other Geospatial | Lake Spokane |
| Online Only (Y/N) | Y |
| Google Analytic Metrics | Metrics page |