

Using Microbial Source Tracking To Identify Fecal Contamination Sources in Patchogue and Bellport Bays on Long Island, New York
Links
- Document: Report (1.81 MB pdf) , HTML , XML
- Companion File: Scientific Investigations Report 2021–5033 - Overview and Methodology for a Study To Identify Fecal Contamination Sources Using Microbial Source Tracking in Seven Embayments on Long Island, New York
- Database: USGS National Water Information System database - USGS water data for the nation
- Download citation as: RIS | Dublin Core
Acknowledgments
The authors wish to thank members of the Bureau of Shellfisheries at the New York State Department of Environmental Conservation Division of Marine Resources for their field efforts, and the Suffolk County Department of Health Public and Environmental Health Laboratory for coordinating with field crews and sample analysis.
Executive Summary
The U.S. Geological Survey worked collaboratively with the New York State Department of Environmental Conservation to assess the potential sources of fecal contamination entering seven estuarine embayments across Long Island, New York, from June 2018 to July 2019. Water samples are routinely collected by the New York State Department of Environmental Conservation in Long Island embayments and analyzed for fecal coliform bacteria, an indicator of fecal contamination, to determine the closure of shellfish beds for harvest and consumption. Concentrations of fecal coliform signify the potential for pathogenic (disease-causing) bacteria to be present.
Indicator bacteria alone cannot determine either the biological or geographical sources of contamination. Microbial source tracking is a method used to determine these sources of contamination. Microbial source tracking laboratory techniques can ascertain whether genetic material obtained from Bacteroides or Helicobacter bacteria in water or sediment is consistent with humans, canines (dogs), ruminants (deer, sheep), or waterfowl. Bacteroides and Helicobacter are genera of bacteria found in the gut of most warm-blooded animals. These techniques can also quantify the concentration of genetic markers found.
Information such as the sample location, weather and season, surrounding land use, and additional water-quality data for the location where the sample was collected help determine the geographical source and conveyance of land-based water to the embayment. The presence of genetic material and fecal coliform bacteria in samples collected at the same time is important to show that the fecal coliform is likely from the host source detected. It is possible for waters with waste infiltration to have genetic material present but no fecal indicators, such as disinfected water from a wastewater treatment plant or from groundwater that has passed through a sandy aquifer.
Water samples were collected in the summer and winter seasons. In each of the two seasons, one sample was collected in dry weather, and one, after substantial rainfall. Groundwater and sediment samples were also collected throughout the study. Surface-water source sites sampled for Patchogue Bay include Corey Creek near Middle Road, Patchogue River Mouth, Patchogue River near Division Street, Swan Lake Culvert, and Swan River Mouth. Surface-water source sites sampled for Bellport Bay include the Culvert at Beaverdam Creek, Carmans River near Beaverdam Road, Carmans River at Montauk Highway, and Carmans River at Sandy Point.
Canine and waterfowl fecal contributions to Patchogue and Bellport Bays were frequently detected across the landscape. Among the potential sources of fecal-contaminated water contributing to Patchogue Bay—groundwater, pond and wetland drainage, stormwater, marinas (boats), and the Patchogue wastewater treatment plant—stormwater from municipal separate storm sewer system conveyances was found to be the most likely transport mechanism of fecal contamination along with pond and wetland drainage contributing waste from wildlife and canines in Patchogue Bay. Among the potential sources of fecal-contaminated water contributing to Bellport Bay—stormwater, pond and wetland drainage, marinas (boats), and groundwater—stormwater runoff and wetland drainage with contributions from wildlife and canines were found to be the most likely transport mechanisms of fecal contamination to Bellport Bay.
The most substantial source of fecal contamination to Patchogue Bay was found to be from stormwater and the subsequent draining of ponds and wetlands into the major tributaries, with the major tributaries sampled being Corey Creek, Swan River and Patchogue River. Sample results were consistent in upstream and downstream sites for all tributaries. In general, and considering the available data, fecal coliform concentrations were higher in the summer season and in wet weather. Corey Creek contributed substantial fecal coliform bacteria to Patchogue Bay, even in the winter months. Evidence of human markers was only observed during the winter in source samples collected at Patchogue Bay. Canine markers were twice as prevalent as human markers, with positive detections in both seasons and weather conditions.
On the basis of the results of the microbial source tracking analyses, Bellport Bay was heavily influenced by canine and waterfowl waste and not by human wastewater (in the entire embayment, only one sample had a detection of the human marker). Microbial source tracking results did not indicate influence from residential onsite wastewater disposal systems, and groundwater did not contribute to fecal coliform bacteria loads.
None of the groundwater samples collected at the Corey Beach or Miramar Beach in Patchogue Bay, the Bellport Bay Yacht Club, or the Shirley Beach in Bellport Bay sites showed evidence of any microbial source tracking markers or fecal coliform bacteria. This finding indicates that there is limited transport of bacteria in the subsurface groundwater through the sandy aquifer material, which is consistent with results throughout Long Island. Sediment sampled at the Mud Creek Dog Park site in Patchogue Bay and the Bellport Bay Yacht Club and Shirley Beach sites in Bellport Bay did not contain any microbial source tracking markers and is unlikely to act as a source of fecal coliform bacteria during resuspension events, such as an ebbing (outgoing) tide, storm-driven waves (particularly at low tide), and boat wakes; however, sediment samples were not analyzed for fecal coliform bacteria.
A classification scheme was developed that considered conditions such as high fecal coliform bacteria concentrations (particularly during dry weather samples) and contributions from human and canine waste based on detection of microbial source tracking markers. The sites were assessed to assist stakeholders and resource managers in prioritizing which source sites are consistently contributing fecal coliforms to the Patchogue and Bellport Bays throughout the year. The top three locations sampled (per embayment) that contribute a substantial source of fecal contamination were identified as the Swan Lake Culvert, Corey Creek near Middle Road, and Patchogue River near Division Street sites for Patchogue Bay and the Carmans River at Montauk Highway, Carmans River near Beaverdam Road, and Culvert at Beaverdam Creek sites for Bellport Bay.
Introduction
To better understand fecal contamination sources in coastal embayments of Long Island, New York, microbial source tracking (MST) and fecal coliform bacteria (FC) data were collected from seven embayments from June 2018 to July 2019 (U.S. Geological Survey, 2020a). The objective of this research is to identify the different pathogen sources, both the host organism (such as human, mammals, or birds) and geographic origin (such as urban and storm runoff and submarine groundwater discharge), to embayments with fecal contamination. The embayments selected represent a mix of sewered and unsewered areas, differing levels of impervious land cover, varying population density, and a variety of land-use types to transfer what is learned to other areas beyond the seven embayments studied. In total, 353 samples were collected in the 7 embayments on Long Island. These were primarily surface-water samples but also included 17 groundwater, 11 sediment, 2 wastewater influent, and 8 fecal samples.
The presence of fecal contamination in Patchogue and Bellport Bays and resulting hazards posed to marine resources and human health are of increasing concern. Recreational uses of the bays, including shellfishing and public bathing, are frequently restricted due to high counts of FC, which are used as indicators for when pathogens may be present. Pathogen loads can be influenced by watershed land-use, proximity to point sources such as municipal separate storm sewer systems, as well as tidal exchange and circulation transporting pathogens from outside the study area (Gao and others, 2015), sediment resuspension (O’Mullan and others, 2019), and human recreation (including boating). Wastewater treatment plants can also act as point sources (through effluent discharge) for pathogens when standard operations and procedures for disinfection are compromised. Nonpoint sources may include shallow groundwater discharge, as much of the area, aside from a part of Patchogue Village, still rely on onsite wastewater disposal systems, such as cesspools and septic systems. Through routine FC monitoring, the New York Department of Environmental Conservation (NYSDEC) has identified fecal contamination as a concern in Patchogue and Bellport Bays. Microbial source tracking techniques are necessary to determine the dominant source (human, canine, ruminant, waterfowl) and geographic origin of FC using land use, topography, and hydrology to establish a framework. The success of future pathogen-control measures may be measured in the decline in FC concentrations.
Site Description
Patchogue Bay is a natural embayment of Great South Bay on the southern shore of Long Island, New York, in the town of Brookhaven, Suffolk County. Several tributaries, including Corey Creek, Patchogue River, Swan River, and Mud Creek, flow into Patchogue Bay (fig. 1). Areas surrounding these tributaries are a mix of residential and commercial land use, including marinas. A large part of the waterfront is bulkheaded. Residential areas adjacent to Main Street in Patchogue Village are serviced by the Patchogue wastewater treatment plant, which discharges treated effluent into Patchogue River. The remainder of Patchogue Village and surrounding areas rely on onsite wastewater disposal systems for wastewater treatment. Potential contamination sources include stormwater runoff draining to tributaries and the bay, groundwater discharge, and effluent from the Patchogue wastewater treatment plant.
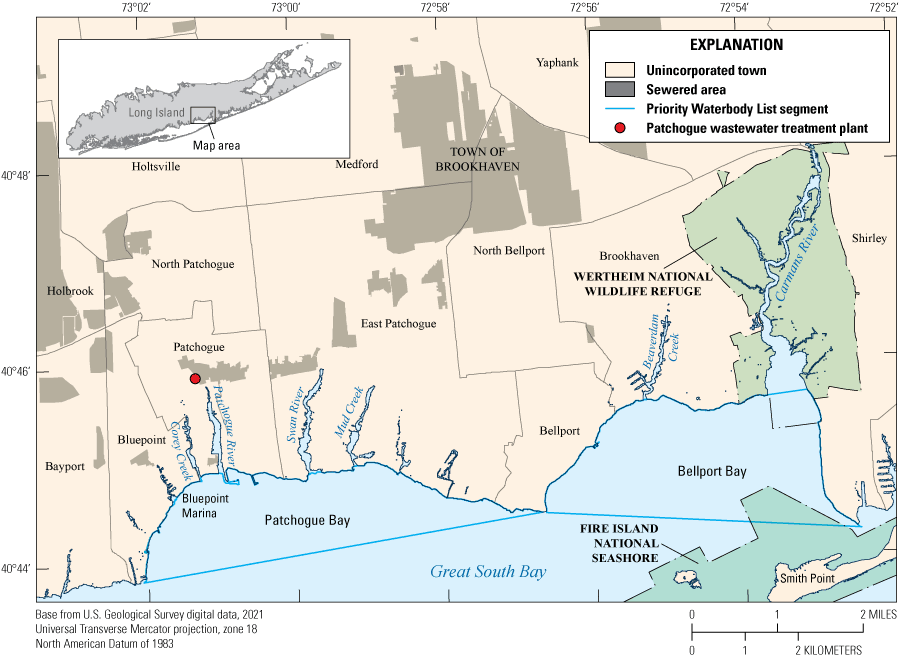
Map showing the extent of the priority waterbody list segments for Patchogue Bay and Bellport Bay on Long Island, New York, as designated by the New York State Department of Environmental Conservation (2020). Areas that are not sewered are served by cesspools or septic tanks.
Bellport Bay is a natural embayment of Great South Bay just to the east of Patchogue Bay on the southern shore of Long Island in the town of Brookhaven. The shoreline of Bellport Bay consists of unsewered residential properties with bulkheaded shorefronts and tidal wetlands. There are three tributaries to Bellport Bay, the largest two being Beaverdam Creek and Carmans River (fig. 1). These tributaries have primarily natural shorelines, with Carmans River running through the Wertheim National Wildlife Refuge, home to a multitude of waterfowl and wildlife. Potential contamination sources include stormwater runoff, groundwater discharge, and discharge from coastal ponds, creeks, and wetlands.
Patchogue Bay
-
• Water from Corey Creek discharges directly into Patchogue Bay. The Corey Creek near Middle Road sampling site (fig. 2; tables 1.1 and 2.1) has a mixture of natural and hardened shoreline that is lined with docked boats. There is parkland at the head of the creek, with the remaining land use being residential through the mouth of the creek at the Bluepoint marina. Potential contamination sources to Corey Creek are stormwater outfalls, direct runoff, onsite wastewater disposal systems, and marinas (boats).
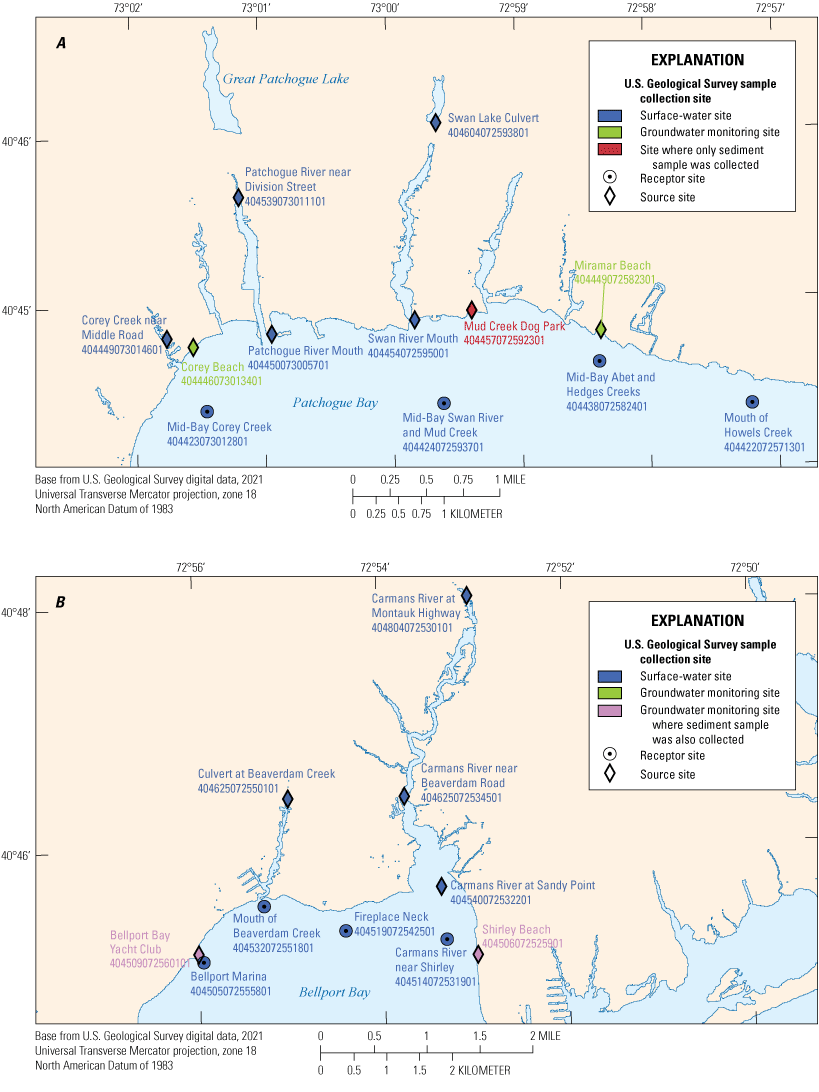
Figure 2. Map showing the locations where surface-water, groundwater, and sediment samples were collected by the U.S. Geological Survey for microbial source tracking in A, Patchogue Bay and B, Bellport Bay on Long Island, New York.
-
• The Patchogue River near Division Street sampling site drains Great Patchogue Lake and is downstream from the Patchogue wastewater treatment plant (fig.1; fig. 2; tables 1.1 and 2.1). Potential contamination sources include the wastewater treatment plant, stormwater outfall at the site, and direct stormwater runoff.
-
• The Patchogue River Mouth sampling site captures contamination sources south of the Patchogue River near Division Street sampling site and discharges into Patchogue Bay (fig. 2; tables 1.1 and 2.1). This length of river has a hardened shoreline that is lined with restaurants and marinas, leading to land use that is primarily commercial. Potential contamination sources include direct stormwater runoff, stormwater outfalls, marinas (boats), and the Patchogue wastewater treatment plant.
-
• The Swan Lake Culvert sampling site directs water from Swan Lake to Swan River (fig. 2; tables 1.1 and 2.1). The lake has a natural shoreline and is surrounded by residential and commercial land uses. There is a small park with walking trails on the southern side of the lake. Potential contamination sources include stormwater runoff, onsite wastewater disposal systems, canines, and wildlife.
-
• The Swan River Mouth sampling site captures contamination sources from the length of the river that is primarily fed by water from Swan Lake and discharges into Patchogue Bay (fig. 2; tables 1.1 and 2.1). The shoreline of Swan River is made up primarily of residential properties buffered by wetlands. There are a handful of small marinas along the length of the river. Potential contamination sources include drainage from Swan Lake and wetlands, stormwater outfalls, direct stormwater runoff from road ends, marinas (boats), and residential onsite wastewater disposal systems.
Bellport Bay
-
• The Culvert at Beaverdam Creek sampling site is at Beaverdam Road (fig. 2; tables 1.1 and 2.1). Samples from this site are used to measure contamination from the headwaters of Beaverdam Creek, a tributary to Bellport Bay. This section of the creek has a natural shoreline that buffers the creek from low-density residential properties. Potential contamination sources include residential onsite wastewater disposal systems and wildlife.
-
• The Carmans River at Montauk Highway sampling site is near Southaven County Park and is the furthest upstream site for this river (fig. 2; tables 1.1 and 2.1). The shoreline is natural and is surrounded by recreational parkland. Carmans River is the largest tributary to Bellport Bay and is a New York State-designated Wild and Scenic River. Potential contamination sources include stormwater runoff and wildlife.
-
• The Carmans River near Beaverdam Road sampling site is on a road end, midway down the river reach within the Wertheim National Wildlife Refuge. There is a large boat basin adjacent to this sampling site. Potential contamination sources include stormwater runoff from the road end, wetland drainage, wildlife, and illicit boat discharge.
-
• The Carmans River at Sandy Point sampling site is near the mouth of the Carmans River where it enters Bellport Bay (fig. 2; tables 1.1 and 2.1). Potential contamination sources include stormwater runoff, wetland drainage, wildlife, and illicit boat discharge.
Approach and Methods
Sampling Methods
Sampling methods used for this study are detailed in Tagliaferri and others (2021). Surface-water samples (June 2018 to June 2019), groundwater samples (May 2019) and sediment samples (June 2019) were collected at selected sites in Patchogue and Bellport Bays. All water-quality and sediment data collected in the field and those analyzed in laboratories as part of this study are available from the U.S. Geological Survey (USGS) National Water Information System (NWIS) database (U.S. Geological Survey, 2020a).
Wet conditions were defined as more than 0.25 inch of precipitation in 24 hours or 0.50 inch in 48 hours (table 1). Dry conditions were defined as less than 0.25 inch of precipitation in 72 hours. Rainfall values were obtained from Islip Long Island MacArthur Airport (National Oceanic and Atmospheric Administration, 2021).
Table 1.
Summary of wet weather sampling dates and the associated rainfall totals for Patchogue and Bellport Bays on Long Island, New York.[X, sample collected; —, no sample collected]
From June 2018 to May 2019, 9 sites were sampled within Patchogue Bay (fig. 2A), yielding 39 surface-water samples (including 2 replicates and 1 blank sample), 2 groundwater samples, and 1 sediment sample. Of the surface-water sites, five were considered to be source sites (waters flowing directly into Patchogue Bay from the land), and four were considered to be receptor sites (the bay itself). Twenty surface-water samples were collected under wet conditions, and 19 under dry conditions; 18 surface-water samples were collected in the summer, and 21, in the winter.
From June 2018 to June 2019, 10 sites were sampled within Bellport Bay (fig. 2B), yielding 32 surface-water samples (including 1 replicate sample and 1 blank sample), 4 groundwater samples (including 1 replicate sample and 1 blank sample), and 2 sediment samples. Of the surface-water sites, four were considered to be source sites (waters flowing directly into Bellport Bay from the land), and four were considered to be receptor sites (the bay itself). Seventeen surface-water samples were collected under wet conditions, and 15 under dry conditions; 15 surface-water samples were collected in the summer, and 17, in the winter.
Laboratory Methods
Laboratory methods used for this study are detailed in Fisher and others (2020) and Tagliaferri and others (2021). Samples for fecal coliforms were analyzed at the Suffolk County Department of Health Services Public Environmental Health Laboratory (PEHL) and the NYSDEC Marine Laboratory. Additional information was either observed or compiled to facilitate interpretation of data. Precipitation measurements from the Islip Long Island MacArthur Airport weather gage, which is approximately 7.5 and 10.5 miles (mi) from the centers of Patchogue and Bellport Bays, respectively (National Oceanic and Atmospheric Administration, 2021). Quality assurance for samples collected at MacArthur Airport weather gage is available in Menne and others (2012). Relative tide stage as noted by USGS field personnel and verified based on tidal predictions available (National Oceanic and Atmospheric Administration, undated) was documented along with the sample information in NWIS (U.S. Geological Survey, 2020a). Land-cover and sewer district geographic information system coverages (Nassau County, 2015; Suffolk County, 2020; U.S. Geological Survey, 2020b) were used for data interpretation. These data support the MST results to increase confidence in the geographical source of the water and likely transport mechanisms of fecal contamination to Patchogue and Bellport Bays.
Results
Results of MST and FC were assessed based on concentrations, presence or absence, and relative abundance of host markers with respect to surface-water source and receptor sites. Differences in MST markers and FC concentrations were also compared seasonally and conditionally (that is, wet or dry), with dry weather discharges with high FC concentrations from stormwater-affected source sites being of particular concern.
Microbial Source Tracking
In Patchogue Bay, the canine-associated Bacteroides (BacCan) marker was the most frequently detected marker, with 50 percent of surface-water source samples containing BacCan. Waterfowl-associated Helicobacter (GFD) and human-associated Bacteroides (HF183) markers were detected in 6 and 5 of 20 total source samples, respectively. There was only one sample with a detection of the ruminant-associated Bacteroides (Rum2Bac) marker in Patchogue Bay, which was collected at the Swan River Mouth (source) site during the dry winter season. The low frequency of ruminant marker detections in samples collected at both source and receptor sites suggests minimal contribution from the resident deer population. There were no positive detections for MST markers in samples collected at the receptor sites in Patchogue Bay, except for two GFD detections from samples collected at the Mid-Bay Corey Creek site during the wet and dry winter sampling events. Overall, there were eight samples with detections for the waterfowl marker that were collected during both wet and dry sampling conditions, with three collected during the summer and five collected during the winter (table 2). All samples with positive detections for HF183 were winter source samples, indicating a seasonal flux of fecal contamination entering Patchogue Bay from the surrounding landscape. For BacCan, all samples with positive detections were collected at source sites, and no samples collected from receptor sites had positive detections, potentially indicating minimal transport of upgradient canine-associated contamination to the receptor sites. Samples with BacCan detections were collected equally during wet and dry weather (28 percent), suggesting canine influence may not be related to weather events in this area.
Table 2.
Summary of microbial source tracking results in surface-water samples for sites sampled in Patchogue and Bellport Bays on Long Island, New York.[Ratios are number of samples with detections greater than reporting limit per total number of samples. Reporting limits vary due to analytical processes and matrix interferences. HF183, human-associated Bacteroides marker; Rum2Bac, ruminant-associated Bacteroides marker; GFD, waterfowl-associated Helicobacter marker; BacCan, canine-associated Bacteroides marker]
Throughout Bellport Bay, the human marker was detected in only one surface-water sample, which occurred during the wet summer sampling event at Fireplace Neck (receptor). The ruminant marker was not detected in any samples collected from Bellport Bay during the length of this study. There were eight detections for the waterfowl marker that were evenly split between sampling conditions (wet and dry), suggesting that fecal contamination was unrelated to weather events. There was a similar percentage of waterfowl marker detections at source and receptor sites, 29 and 25 percent, respectively. Seven waterfowl marker detections were during the winter, and only one, during the summer, implicating seasonal avian fecal contamination throughout the embayment. The canine marker was detected in the highest frequency in Bellport Bay relative to other markers, with 13 positive detections of the 30 surface water samples (43 percent). BacCan was detected in 50 percent of the winter samples and 36 percent of the summer samples (table 2). Canine marker detections in samples collected during wet and dry weather were similar (44 percent and 43 percent, respectively), suggesting canine influence is unrelated to weather events and is a year-round occurrence. Of the 13 positive canine marker detections, 7 also contained waterfowl markers.
Host Specific Markers
Reporting limits for the three predominant MST markers (human, canine, and waterfowl) detected in Patchogue and Bellport Bays varied slightly because of analytical processes, such as dilutions required because of matrix interferences. Understanding occurrence of the predominant MST markers in Patchogue and Bellport Bays can help prioritize locations for additional investigation and infrastructure improvement and provide a baseline for host contributions when prioritizing sites of concern for assessing FC and after total maximum daily load implementation.
HF183
In Patchogue Bay, the human marker was detected in 5 of 20 surface water source samples, all of which were during the winter season (fig. 3). Three of five samples with positive human marker detections (1,800, 5,900, and 12,000 copies per 100 milliliters [copies/100 mL]) were in dry sampling conditions, and the remaining two samples (630 and 2,300 copies/100 mL) were collected during wet sampling conditions (table 1.2; U.S. Geological Survey, 2020a). The only surface-water source site without detections of the human marker in samples was Swan Lake Culvert. The highest concentration of HF183 was observed in a sample collected at the Patchogue River near Division Street site (12,000 copies/100 mL) and was associated with low FC (45 most probable number per 100 milliliters [MPN/100 mL]; table 1.2). There were no positive detections of the human marker in samples collected at receptor sites, in groundwater samples collected at the Corey Beach and Miramar Beach sites, or in the sediment collected at the Mud Creek Dog Park site.
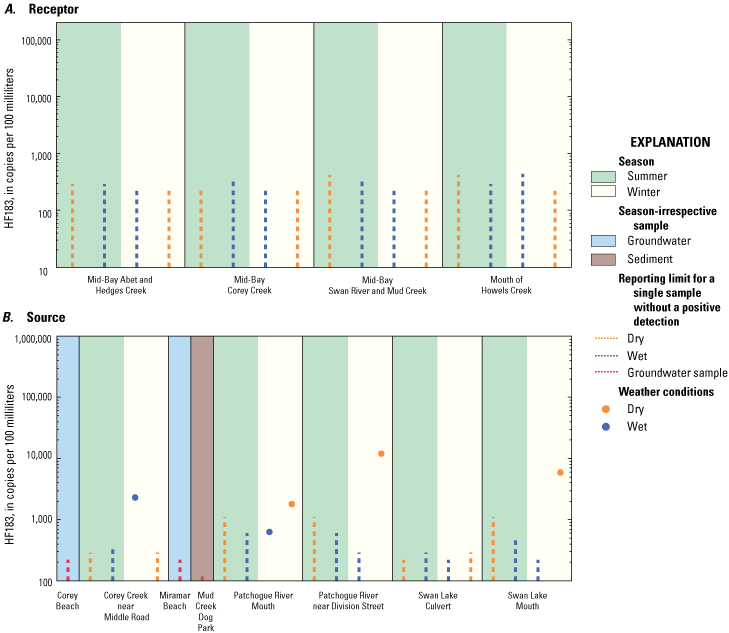
Graph showing the concentrations of the human-associated Bacteroides (HF183) marker, in copies per 100 milliliters, from A, receptor and B, source sites in Patchogue Bay on Long Island, New York, under various surface-water sample conditions. Dashed lines indicate reporting limit for a single sample without a positive detection. Scales for marker concentrations are fixed to allow for easy comparison with other embayment study areas on Long Island.
In Bellport Bay, the human marker was detected only once in surface-water samples during the wet summer sampling event (table 2.2; U.S. Geological Survey, 2020a). The low detection frequency of the human marker in samples collected at Bellport Bay receptor sites is indicative of minimal to no human-associated Bacteroides inputs from inland sources or sources from within the receptor (including boats and marinas). Additionally, there were no positive detections of the human marker in the groundwater or sediment samples collected at the Bellport Bay Yacht Club or Shirley Beach sites (fig. 4).
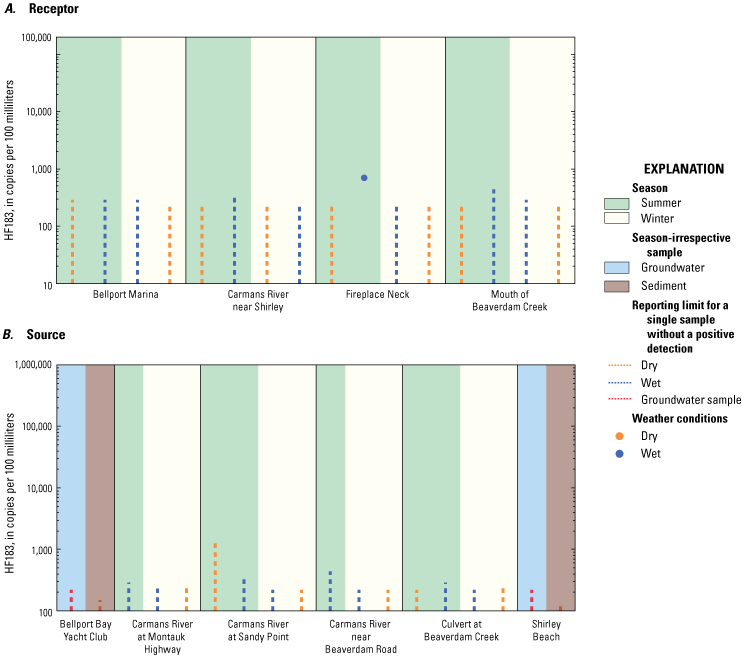
Graph showing the concentrations of the human-associated Bacteroides (HF183) marker, in copies per 100 milliliters, from A, receptor and B, source sites in Bellport Bay on Long Island, New York, under various surface-water sample conditions. Dashed lines indicate reporting limit for a single sample without a positive detection. Scales for marker concentrations are fixed to allow for easy comparison with other embayment study areas on Long Island.
BacCan
In Patchogue Bay, the canine marker was the most frequently detected marker, with 10 total surface water samples with positive detections and at least 1 detection at each of the 5 samples collected at source sites and no positive detections in receptor samples. The concentration of BacCan in all samples was of the same order of magnitude (thousands of copies per 100 milliliters [mL]; table 1.2; U.S. Geological Survey, 2020a). Samples with positive canine marker detections at the source sites were evenly split between dry and wet sampling conditions, with two more positive detections in the summer than in winter (fig. 5). The relatively even split of samples with detections of the canine marker between sampling conditions (wet versus dry) and season (summer versus winter) suggests year-round canine influence across the Patchogue Bay landscape (table 2). BacCan concentrations were highest in the sample collected at the Swan Lake Culvert site during wet summer conditions (5,600 copies/100 mL); this sample was also associated with the second highest FC concentration observed in Patchogue Bay during this study (500 MPN/100 mL; table 1.2; U.S. Geological Survey, 2020a). The highest FC concentrations were observed in the samples collected at the Patchogue River near Division Street and Corey Creek near Middle Road sites, both in the wet summer sample (800 MPN/100 mL) at each site. There were no detections of the canine marker in the groundwater samples collected at the Corey Beach and Miramar Beach sites or in the sediment at the Mud Creek Dog Park site.
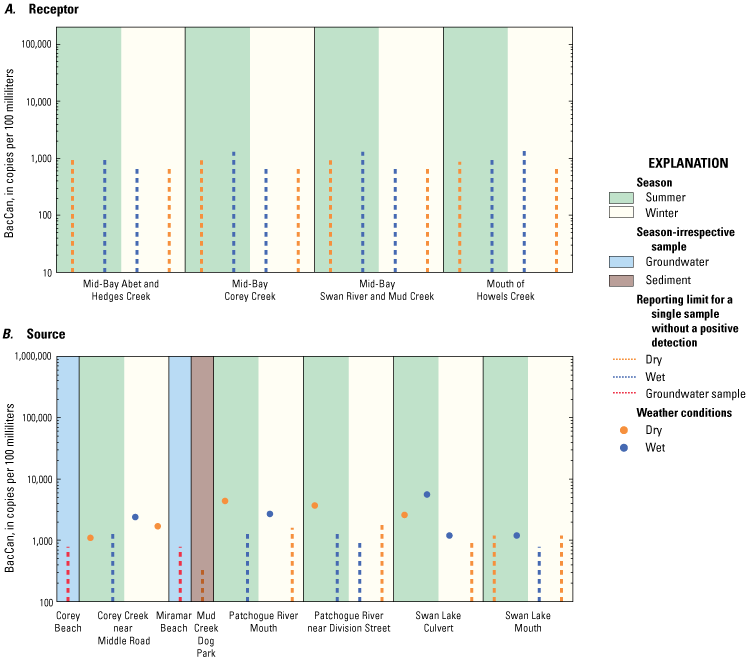
Graph showing the concentrations of the canine-associated Bacteroides (BacCan) marker, in copies per 100 milliliters, from A, receptor and B, source sites in Patchogue Bay on Long Island, New York, under various surface-water sample conditions. Dashed lines indicate reporting limit for a single sample without a positive detection. Scales for marker concentrations are fixed to allow for easy comparison with other embayment study areas on Long Island.
In Bellport Bay, BacCan was the most frequently detected marker, with 13 total detections, 8 at source sites and 5 at receptor sites (table 2). The concentration of BacCan in all samples was on the same order of magnitude (thousands of copies per 100 mL), except at the Carmans River near Montauk Highway site (hundreds of copies per 100 mL). Source sites positive for the canine marker were evenly split between dry and wet sampling conditions (four detections each), with only two of these detections in summer and six in winter (fig. 6). The similar occurrence of positive canine marker detections between wet and dry condition samples suggests continuous canine influence across the Bellport Bay landscape. The Carmans River at Sandy Point site was the only surface-water source site with no positive canine marker detections. Of all receptor samples, concentrations of BacCan were highest at the Mouth of Beaverdam Creek site, with concentrations of 4,100 copies/100 mL in the winter, wet weather sample and 3,800 copies/100 mL in the summer, dry weather sample. The Culvert at Beaverdam Creek site was the only source site where BacCan was detected in all four samples, with a median concentration of 3,300 copies/100 mL. The wet summer sample taken at the Culvert at Beaverdam Creek site had the highest FC concentration (1,700 MPN/100 mL), while the dry winter sample at the site had the highest BacCan concentration (17,000 copies/100 mL; table 2.2; U.S. Geological Survey, 2020a). There were no positive detections of the canine marker in the groundwater or sediment samples collected at the Bellport Bay Yacht Club or Shirley Beach sites.
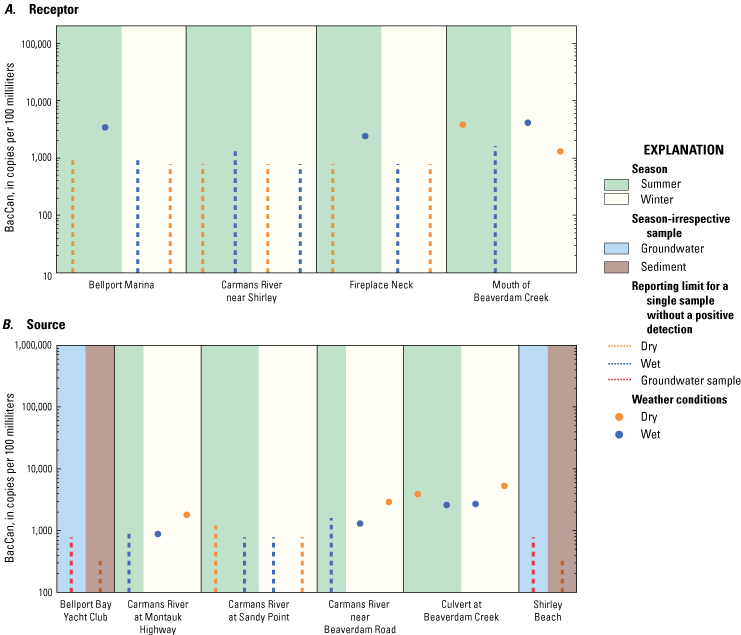
Graph showing the concentrations of the canine-associated Bacteroides (BacCan) marker, in copies per 100 milliliters, from A, receptor and B, source sites in Bellport Bay under various surface-water sample conditions. Dashed lines indicate reporting limit for a single sample without a positive detection. Scales for marker concentrations are fixed to allow for easy comparison with other embayment study areas on Long Island.
GFD
The waterfowl marker was the second most frequently detected marker in Patchogue Bay with eight total surface-water detections, just after the canine marker with 10 total surface-water detections. All positive detections were of varying orders of magnitude (between hundreds and tens of thousands of copies per 100 mL; table 1.2; U.S. Geological Survey, 2020a). Six of eight positive detections were in samples collected at source sites, three at the Corey Creek near Middle Road site, two at the Swan Lake Culvert site, and one at the Patchogue River Mouth site (fig. 7). The waterfowl marker does not appear to be influenced by weather given that positive waterfowl marker detections were split evenly between wet and dry sampling conditions (table 2). The only positive detection of the waterfowl marker at a receptor site (Mid-Bay Corey Creek) was in wet and dry summer samples. The highest concentrations of GFD were in samples collected at two different source sites and were both during wet, winter weather, the Corey Creek near Middle Road (18,000 copies/100 mL) and Patchogue River Mouth (16,000 copies/100 mL) sites. The highest frequency of positive detections of the waterfowl marker were in samples collected at the Corey Creek near Middle Road site, with positive detections in three of four samples. There were no positive detections of the waterfowl marker in the groundwater samples collected at the Corey Beach and Miramar Beach sites or in the sediment sample at the Mud Creek Dog Park site.
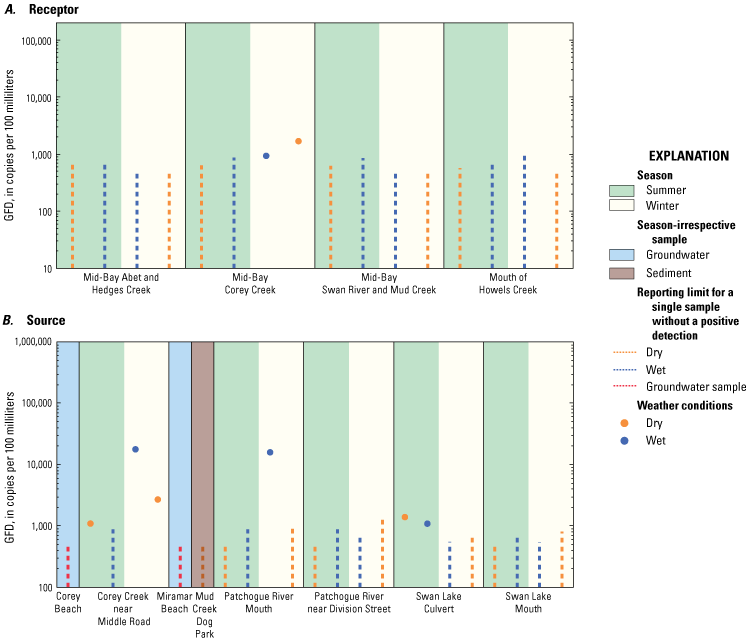
Graph showing the concentrations of the waterfowl-associated Helicobacter (GFD) marker, in copies per 100 milliliters, from A, receptor and B, source sites in Patchogue Bay on Long Island, New York, under various surface-water sample conditions. Dashed lines indicate reporting limit for a single sample without a positive detection. Scales for marker concentrations are fixed to allow for easy comparison with other embayment study areas on Long Island.
The waterfowl marker was the second most frequently detected marker in Bellport Bay with eight total surface-water detections, just after the canine marker with 13 total surface water detections (fig. 8). Positive detections of the waterfowl marker were evenly split between source and receptor sites (four detections each; table 2). All waterfowl marker detections at surface water sites in Bellport Bay were approximately of the same order of magnitude (hundreds to thousands of copies per 100 mL; table 2.2; U.S. Geological Survey, 2020a). The Carmans River at Sandy Point (source) and Carmans River near Shirley (receptor) sites were the only surface water sites with no positive waterfowl marker detections. The Carmans River near Beaverdam Road and Mouth of Beaverdam Creek sites each had two detections for the waterfowl marker, both in wet and dry winter samples. The increase in positive detections of the waterfowl marker during the winter (seven of eight positive GFD samples were in the winter months) suggests a seasonal influx of migratory birds to the area; however, these seven winter samples are not associated with high FC concentrations (45 MPN/100 mL or below). The groundwater sample from the Bellport Bay Yacht Club site was positive for the waterfowl marker in a replicate sample (550 copies/100 mL, just above the reporting limit of 540 copies/100 mL; not shown in fig. 8) and was associated with an FC concentration below the reporting limit (less than 18 MPN/100 mL; table 2.2; U.S. Geological Survey, 2020a).
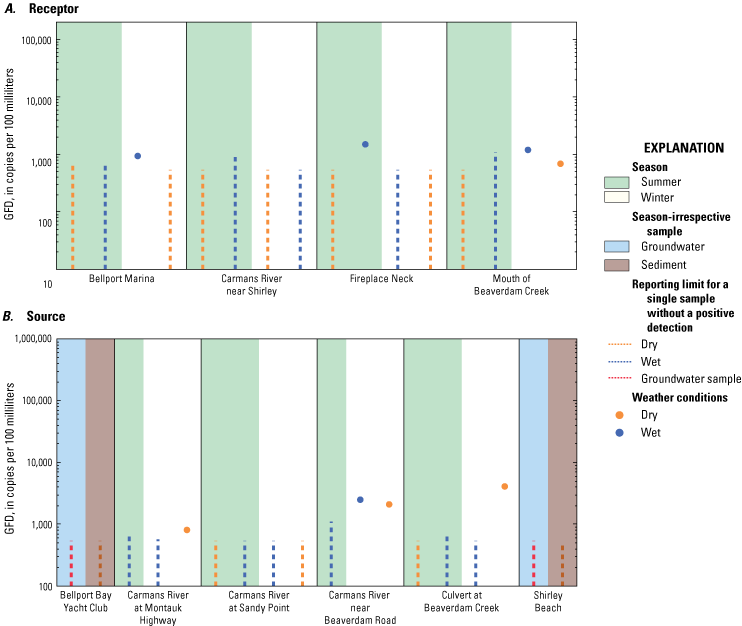
Graph showing the concentrations of the waterfowl-associated Helicobacter (GFD) marker, in copies per 100 milliliters, from A, receptor and B, source sites in Bellport Bay on Long Island, New York, under various surface-water sample conditions. Dashed lines indicate reporting limit for a single sample without a positive detection. Scales for marker concentrations are fixed to allow for easy comparison with other embayment study areas on Long Island.
Fecal Coliform Bacteria
Patchogue Bay
All but four samples collected at receptor sites for fecal coliform in Patchogue Bay were less than the 3, 18, and 20 MNP/100 mL reporting limits for FC (table 1.2; U.S. Geological Survey, 2020a). Fecal coliform concentrations were 800 MPN/100 mL in the two wet, summer samples, one at the Corey Creek near Middle Road site and the other at the Patchogue River near Division Street site; neither site was associated with any MST marker detections. Of the 16 surface-water source samples with available FC data, 11 had concentrations that were above 49 MPN/100 mL, the 90-percentile concentration determined by the NYSDEC as part of the National Shellfish Sanitation Program (NSSP) closure criteria (U.S. Food and Drug Administration, 2019). Of the 11 surface-water source samples with available FC data collected in the summer, 9 had concentrations that were above 49 MPN/100 mL; in the winter, 2 of 6 surface-water source samples with available FC data had concentrations that were above 49 MPN/100 mL. The Corey Creek near Middle Road and Patchogue River Mouth sites were the only two sites with positive detections for three markers: human (2,300 and 630 copies/100 mL, respectively), waterfowl (18,000 and 16,000 copies/100 mL, respectively), and canine (2,400 and 2,700 copies/100 mL, respectively); all these detections were in samples collected during wet winter conditions. The associated FC concentration for the Corey Creek near Middle Road sample was 130 MPN/100 mL; there are no associated FC data available for the Patchogue River Mouth site.
Bellport Bay
Fecal coliform counts were generally lower at receptor sites, with the median receptor site FC concentration being 20 MPN/100 mL as opposed to 68 MPN/100 mL in samples collected at source sites. Concentrations in samples from receptor sites with available data were at or below the reporting limit in four of six samples, with the highest concentration being 110 MPN/100 mL in one summer sample from the Bellport Marina site under wet weather conditions (table 2.2; U.S. Geological Survey, 2020a). Four of 10 surface-water samples collected at source sites with available data had concentrations at or below the reporting limit for fecal coliform and reached 1,700 MPN/100 mL in one summer sample, in wet weather conditions at the Culvert at Beaverdam Creek site (table 2.2; U.S. Geological Survey, 2020a). During this study, concentrations for 6 of 10 source samples with available data in Bellport Bay and only 1 receptor sample collected at the Bellport Marina site were above 49 MPN/100 mL (U.S. Food and Drug Administration, 2019).
FC concentrations in the sample collected at the Culvert at Beaverdam Creek site were high during the summer (80 and 1,700 MPN/100 mL), whereas FC concentrations for the Mouth of Beaverdam Creek site (downstream from the Culvert at Beaverdam Creek site) were low to below the reporting limit year-round. These two sites also exhibited the highest frequency and concentrations of the canine marker observed in Bellport Bay, which may indicate transportation, degradation, and dilution of both FC and BacCan in the receptor.
The relation between FC and marker detection is not straightforward. Fecal coliform and specific host-associated markers may decay at different rates and be present in different abundances. Host-associated markers were shown to decay more rapidly than FC in Drozd and others (2013) and Rogers and others (2011). In general, high FC concentrations were observed in samples collected during the summer season and in wet weather.
Nonpoint Sources of Fecal Coliform Bacteria
Potential, major nonpoint contributors of fecal coliform to the Patchogue and Bellport Bays include groundwater seepage, wetland drainage, and direct stormwater runoff not conveyed by the municipal separate storm sewer systems, particularly to tributaries of the bays. Fecal coliforms were not detected in groundwater samples collected at the Corey Beach, Miramar Beach, Bellport Bay Yacht Club, and Shirley Beach sites (table 2.2; U.S. Geological Survey, 2020a). The waterfowl marker was detected at the Bellport Bay Yacht Club site in shallow groundwater (within 10 feet below land surface) in a replicate sample at 550 copies/100 mL, just above the reporting limit of 540 copies/100 mL. Where groundwater seepage would contribute FC to Bellport Bay, these results indicated that waterfowl could serve as a contamination source; however, the lack of positive detections for FC in groundwater samples collected throughout Long Island for the larger MST study strongly suggests that direct groundwater seepage is an unlikely contributor of FC in all embayments, including Bellport Bay.
No human, waterfowl, or canine markers were detected in the sediment samples collected at the Bellport Bay Yacht Club and Shirley Beach sites in Bellport Bay and the Mud Creek Dog Park site in Patchogue Bay, indicating minimal to no fecal contamination from these sources to the bays through the sandy shoreline sediment. Fecal coliform concentrations were not measured in the sediment samples collected in this study; however, recent research (O’Mullan and others, 2019; Hassard and others, 2016) indicates that resuspension of sediment along natural shorelines could cause a spike in fecal indicator bacteria in the water column. Therefore, it is possible that, during conditions that result in high wave energy, sediment (particularly organic-rich material) can act as a source of FC when resuspended in the water column as a result of tidal movement, storms, or boat activity.
Classification of Source Sites
The sites in Patchogue and Bellport Bays were assessed to better understand geographical sources and transport mechanisms to surface-water receptor sites and the relation between FC and MST marker presence and abundance (table 3). Source sites were assigned a numeric classification as described in Tagliaferri and others (2021) to aid in conceptualizing the degree of contamination potential (table 4). Classifications are based on a sliding scale, with class 1 sites being the most contaminated and class 5 sites being the least contaminated.
Table 3.
Geographical sources of water for sample locations in Patchogue and Bellport Bays on Long Island, New York, and the potential for these sites to have contributed to the fecal coliform concentrations observed in the samples.[FC, fecal coliform; MST, microbial source tracking; X, potential contributor, —, not a likely contributor based on current data]
Table 4.
Sample results for fecal coliform and microbial source tracking markers, by source site type, at Patchogue and Bellport Bays on Long Island, New York.[Proposed classification considers concentrations of fecal coliform (FC) above 49 most probable number per 100 milliliters (MPN/100 mL), dry weather discharges, and influences of human wastewater and canine waste. A fecal coliform concentration of 49 MPN/100 mL is the 90-th percentile concentration determined by the New York State Department of Environmental Conservation as part of the National Shellfish Sanitation Program closure criteria (U.S. Food and Drug Administration, 2019). HF183, human-associated Bacteroides marker; BacCan, canine-associated Bacteroides marker; —, no data]
Corey Creek Near Middle Road—Class 1
The Corey Creek near Middle Road site flows continuously and is suspected of contributing high FC concentrations to Patchogue Bay related to stormwater, canines, and wildlife, particularly during the summer season. The samples collected at the Corey Creek near Middle Road site had some of the highest concentrations of waterfowl and canine markers in Patchogue Bay and exhibited FC concentrations consistently at or above 130 MPN/100 mL and even as high as 800 MPN/100 mL in the wet, summer sample. Of the 36 surface-water samples collected for MST in Patchogue Bay, there were only 5 positive human marker detections, 1 of which was at the Corey Creek near Middle Road site. Waterfowl and canine markers were detected in three of four samples ranging from 1,100 copies/100 mL in the dry summer sample to 18,000 copies/100 mL in the wet winter sample. The high frequency of waterfowl and canine markers in conjunction with year-round FC detections is likely reflective of a prominent bird population and presence of dogs in the residences lining the creek. Although high FC concentrations were detected at this site year-round, wet summer samples generally had higher FC concentrations than dry summer samples, suggesting that stormwater runoff is an important contributor of FC to Corey Creek.
Patchogue River Near Division Street—Class 1
The Patchogue River near Division Street site is south of the Patchogue wastewater treatment plant and north of the commercial properties and marinas that line the remainder of the river. This site is a consistent source of FC in the summer season in both wet and dry conditions. Only human and canine markers were detected, each measured only in dry weather conditions. The one human marker detection at this site was relatively high (12,000 copies/100 mL) and corresponded to the lowest observed FC concentration observed at this site (45 MPN/100 mL). This could be explained by effluent from the wastewater treatment plant upstream where FC has been effectively removed during treatment. The highest FC concentration at this site (800 MPN/100 mL) was in the wet summer season and corresponded to a sample that has no detections of any MST markers. The canine marker was detected once at a concentration of 3,660 copies/100 mL in the dry summer sample and had an associated FC concentration of 110 MPN/100 mL. A dry winter replicate sample was positive for the canine marker at a concentration of 2,400 copies/100 mL, close to the reporting limit of 1,900 copies/100 mL. The original sample was below the reporting limit. Fecal coliform was higher in the summer (110 and 800 MPN/100 mL) than in the winter (45 MPN/100 mL), which may be explained by an increase in human, canine, and waterfowl populations in the summer season. The higher FC concentration in the summer wet sample compared with the summer dry sample suggests influence from stormwater conveyances and runoff from impervious surfaces.
Swan River Mouth—Class 1
The Swan River mouth captures drainage from Swan Lake and upstream wetlands, stormwater outfalls, stormwater runoff from road ends, marinas, and residential onsite wastewater disposal systems by groundwater, which flows directly into Patchogue Bay. All fecal coliform concentrations were above the reporting limit and ranged from 45 to 300 MPN/100 mL. Human markers were detected in the dry winter sample on the order of thousands of copies per 100 mL, similar to concentrations at other source sites. Both FC samples taken in dry winter conditions at the Swan River Mouth and Swan Lake Culvert sites (upgradient) were considered low at 45 MPN/100 mL. The wet and dry summer samples at the Swan River Mouth site exhibited FC concentrations of 170 and 300 MPN/100 mL, respectively, whereas the sample taken upstream at the Swan Lake Culvert site had concentrations of 500 and 110 MPN/100 mL respectively, suggesting high FC throughout the length of the river in all weather conditions during the summer. These data indicate that the Swan River is a source of FC to Patchogue Bay, particularly during the summer; the elevated FC concentrations are attributed primarily to the increased presence of canine and waterfowl to the surrounding area.
Culvert at Beaverdam Creek—Class 2
The summer wet sample from the Culvert at Beaverdam Creek site had the highest FC concentration (1,700 MPN/100 mL) of all source sites contributing fecal coliform to Bellport Bay. The summer dry sample FC was 80 MPN/100 mL, suggesting that wet weather contributes to elevated FC concentrations. The wet winter sample was below detection (less than 18 MPN/100 mL), indicating a seasonality to elevated FC contamination. FC data are unavailable for the winter dry sample. Canine-associated markers were detected in every sample at this site, alluding to persistent canine contribution originating from residences upstream from the sample location.
Swan Lake Culvert—Class 2
The Swan Lake culvert continuously discharges water from Swan Lake into Swan River and is suspected of contributing high FC concentrations to the river related to stormwater runoff, canines, and wildlife. Fecal coliform concentrations were highest (500 MPN/100 mL) in the wet summer sample. Canine markers were detected in both summer samples, and the wet summer sample had the highest canine marker concentration detected in all Patchogue Bay samples (5,600 copies/100 mL), corresponding to the highest FC detected at Swan Lake Culvert. No markers were detected in the dry winter sample, and associated FC was low (45 MPN/100 mL). Because the FC concentration was higher in the wet summer sample than the dry summer sample, stormwater is most likely flushing canine waste from the park and surrounding residential communities into Swan Lake. Higher fecal coliform concentrations in the summer than in the winter may reflect heavier use of the park for dog walking and habitat for waterfowl in warmer months.
Carmans River at Montauk Highway—Class 3
The Carmans River’s course crosses Montauk Highway as it flows through the Wertheim National Wildlife Refuge, approximately 3 mi upstream from the discharge point into Bellport Bay. The concentrations of fecal coliform in the two samples available with FC data were 68 and 220 MPN/100 mL. Canine markers were detected twice in winter samples, and waterfowl markers once in the dry winter sample. The summer wet sample had the highest FC concentration observed at this site (220 MPN/100 mL) and was negative for all MST markers. No summer dry sample was collected for comparison. There were no positive ruminant marker detections despite the proximity to a wildlife refuge.
Carmans River Near Beaverdam Road—Class 3
The Carmans River near Beaverdam Road site is proximal to a small boat docking facility and is less than 1 mi upstream from Bellport Bay. The wet summer sample exhibited a high FC concentration (600 MPN/100 mL) but had no MST marker detections. The wet winter sample had a low FC concentration (20 MPN/100 mL) and was positive for canine and waterfowl markers. No FC data were available for dry weather samples to compare wet and dry weather at this site; however, MST data suggest fecal contamination is not originating from humans.
Carmans River at Sandy Point—Class 5
The Carmans River at Sandy Point site is at the mouth of the Carmans River to Bellport Bay. This site is a culmination of potential contamination sources, including wetland drainage, stormwater runoff, and boat septic. The concentration of fecal coliform ranged from below detection (less than 18 and less than 20 MPN/100 mL) to 110 MPN/100 mL. No MST markers were detected in any sample at this site. The highest FC concentration was measured in the wet summer sample (110 MPN/100 mL), whereas the dry summer sample and the wet winter sample had no detection of FC. FC data for the dry winter sample are unavailable for comparison. Data from the Carmans River at Sandy Point site are consistent with the two sites upstream, Carmans River near Beaverdam Road and Carmans River at Montauk Highway, where FC concentrations are highest in the summer season during wet weather and lower in the winter season, according to available data (U.S. Geological Survey, 2020a).
Patchogue River Mouth—Class 5
The Patchogue River mouth directs all waters from the length of the river into Patchogue Bay. Concentrations of fecal coliform were above the reporting limit in two of three samples with available data, one in the dry winter sample (45 MPN/100 mL) and one in the wet summer sample (130 MPN/100 mL). Fecal coliform was not detected in the dry summer sample, suggesting that the elevated FC concentrations in the river are primarily affected by stormwater. Human, canine, and waterfowl markers were present in the wet winter sample; the dry winter sample contained only human markers, and the dry summer sample contained only canine markers. No markers were detected in the wet summer sample, although, this sample exhibited the highest FC concentration observed at this site. Additionally, the wet winter sample had the second highest waterfowl marker concentration in Patchogue Bay (16,000 copies/100 mL).
Groundwater—Class 5
The lack of positive detections for FC in groundwater throughout the study suggests that direct groundwater seepage is an unlikely contributor of FC to Patchogue and Bellport Bays. No positive human MST markers were detected at the Corey Beach, Miramar Beach, Shirley Beach, and Bellport Bay Yacht Club sites during this study, suggesting that septic waste is not a contributor of FC to these embayments.
Sediment—Class 5
Recent research (O’Mullan and others, 2019; Hassard and others, 2016) shows that resuspension of sediment along natural shorelines can cause a spike in FC concentrations. Therefore, it is likely that, during conditions that result in high wave energy, sediment can act as a source of FC when resuspended in the water column as a result of tidal movement, storms, or boat activity. Fecal coliform concentrations were not measured for sediment samples collected at the Shirley Beach, Bellport Bay Yacht Club, or Mud Creek Dog Park sites; however, the samples from these sites appeared to be low in organic matter and therefore less likely to retain bacteria (Lee and others, 2006). No human, waterfowl, or canine markers were detected in these samples, indicating minimal to no fecal contamination to Patchogue and Bellport Bays through the sediment.
Summary
The U.S. Geological Survey, in collaboration with the New York State Department of Environmental Conservation, assessed the potential sources of fecal contamination entering Patchogue and Bellport Bays on Long Island, New York, from June 2018 to July 2019. Water samples are routinely collected by the New York State Department of Environmental Conservation in embayments on Long Island and analyzed for fecal coliform bacteria, an indicator of fecal contamination, to determine the closure of shellfish beds for harvest and consumption. Fecal indicator bacteria, such as fecal coliform, signify the potential for pathogenic (disease-causing) bacteria to be present.
Host sources of fecal contamination in Patchogue and Bellport Bays were assessed based on bacterial Bacteroides and Helicobacter microbial source tracking markers. Overall, canine-and waterfowl-associated bacterial contributions were prevalent in source samples in both bays. Human-associated markers were present in surface-water source samples and completely absent in receptor samples in Patchogue Bay. One receptor site in Bellport Bay, Fireplace Neck, had a human-associated marker present in the summer wet sample only. By evaluating the microbial source tracking markers alongside fecal coliform bacteria (FC) data and land-use information, geographical sources of fecal contamination discharging locations sampled as part of this study were better differentiated.
Among the potential sources of fecal-contaminated water-contributing sources to Patchogue and Bellport Bays—groundwater, pond and wetland drainage, stormwater (municipal separate storm sewer system), marinas (boats), and the Patchogue wastewater treatment plant—pond and wetland drainage and stormwater, direct and from stormwater conveyances, were the most likely transport mechanisms of fecal contamination into Patchogue and Bellport Bays. When considering Patchogue Bay as a whole and the data available, the most substantial source of fecal contamination was found to be under wet summer conditions, as evidenced by the higher fecal coliform concentrations in summer wet samples compared with summer dry samples at the Corey Creek near Middle Road, Patchogue River near Division Street, Patchogue River Mouth, and Swan Lake Culvert sample collection sites. However, the Corey Creek near Middle Road site exhibited FC concentrations above 100 most probable number per 100 milliliters year-round, in conjunction with detections of waterfowl- and canine-associated bacterial markers, suggesting a continuous source of FC contamination in Patchogue Bay unrelated to season or weather from this source site.
The most substantial source of fecal contamination to Bellport Bay was found to be discharge from sites draining ponds and wetlands. Fecal coliform at these site types is increased by stormwater runoff and flushing, which is another substantial source. Sites with high FC concentrations in the summer that are exacerbated by stormwater include the Carmans River at Sandy Point, Bellport Marina, and the Culvert at Beaverdam Creek sites. The lack of human-associated marker detections within Patchogue and Bellport Bays in summer source samples coupled with low to no detections of FC, especially where small marinas are present in creeks and tributaries, suggest that boats do not substantially contribute FC to the bays. The absence of FC in all groundwater samples indicates that water from septic systems does not contribute FC to the bays. Further, the sandy sediment alongside Patchogue and Bellport Bays is unlikely to contribute FC from the tested host organisms when resuspended in the water column through tidal shifts or boat activity. Future studies focused on monitoring and sample collection during multiple seasons may provide better insight into the conditions that contribute high FC concentrations to these embayments.
References Cited
Drozd, M., Merrick, N.N., Sanad, Y.M., Dick, L.K., Dick, W.A., and Rajashekara, G., 2013, Evaluating the occurrence of host-specific Bacteroidales, general fecal indicators, and bacterial pathogens in a mixed-use watershed: Journal of Environmental Quality, v. 42, no. 3, p. 713–725, accessed December 15, 2020, at https://doi.org/10.2134/jeq2012.0359.
Fisher, S.C., McCarthy, B.A., Kephart, C.M., and Griffin, D.W., 2020, Assessment of water quality and fecal contamination sources at Hook Pond, East Hampton, New York: U.S. Geological Survey Scientific Investigations Report 2020–5071, 58 p., accessed June 23, 2021, at https://doi.org/10.3133/sir20205071.
Gao, G., Falconer, R.A., and Lin, B., 2015, Modelling the fate and transport of faecal bacteria in estuarine and coastal waters: Marine Pollution Bulletin, v. 100, no. 1, p. 162–168, accessed June 23, 2021, at https://doi.org/10.1016/j.marpolbul.2015.09.011.
Hassard, F., Gwyther, C.L., Farkas, K., Andrews, A., Jones, V., Cox, B., Brett, H., Jones, D.L., McDonald, J.E., and Malham, S.K., 2016, Abundance and distribution of enteric bacteria and viruses in coastal and estuarine sediments—A review: Frontiers in Microbiology, v. 7, article 1692, 31 p., accessed June 23, 2021, at https://doi.org/10.3389/fmicb.2016.01692.
Lee, C.M., Lin, T.Y., Lin, C.-C., Kohbodi, G.N.A., Bhatt, A., Lee, R., and Jay, J.A., 2006, Persistence of fecal indicator bacteria in Santa Monica Bay beach sediments: Water Research, v. 40, no. 14, p. 2593–2602, accessed June 23, 2021, at https://doi.org/10.1016/j.watres.2006.04.032.
Menne, M.J., Durre, I., Vose, R.S., Gleason, B.E., and Houston, T.G., 2012, An overview of the Global Historical Climatology Network-daily database: Journal of Atmospheric and Oceanic Technology, v. 29, no. 7, p. 897–910, accessed November 30, 2021, at https://doi.org/10.1175/JTECH-D-11-00103.1.
Nassau County, 2015, Nassau County DPW sanitary sewer collection districts: Nassau County data, accessed March 30, 2021, at https://www.arcgis.com/home/item.html?id=26d010a660d047c495d2226df26af81a.
National Oceanic and Atmospheric Administration, 2021, Daily summaries station details—Islip LI MacArthur Airport, NY US: National Oceanic and Atmospheric Administration data, accessed April 12, 2021, at https://www.ncdc.noaa.gov/cdo-web/datasets/GHCND/stations/GHCND:USW00004781/detail.
National Oceanic and Atmospheric Administration, [undated], NOAA tide predictions: National Oceanic and Atmospheric Administration data, accessed 2020 at https://tidesandcurrents.noaa.gov/tide_predictions.html.
New York State Department of Environmental Conservation, 2020, Waterbody inventory/priority waterbodies list: New York State Department of Environmental Conservation data, accessed December 3, 2020, at https://www.dec.ny.gov/chemical/36730.html.
O’Mullan, G.D., Juhl, A.R., Reichert, R., Schneider, E., and Martinez, N., 2019, Patterns of sediment-associated fecal indicator bacteria in an urban estuary—Benthic-pelagic coupling and implications for shoreline water quality: The Science of the Total Environment, v. 656, p. 1168–1177, accessed June 23, 2021, at https://doi.org/10.1016/j.scitotenv.2018.11.405.
Rogers, S.W., Donnelly, M., Peed, L., Kelty, C.A., Mondal, S., Zhong, Z., and Shanks, O.C., 2011, Decay of bacterial pathogens, fecal indicators, and real-time quantitative PCR genetic markers in manure-amended soils: Applied and Environmental Microbiology, v. 77, no. 14, p. 4839–4848, accessed June 23, 2021, at https://doi.org/10.1128/AEM.02427-10.
Suffolk County, 2020, GIS viewer—Suffolk County: Suffolk County data, accessed March 30, 2021, at https://gisportal.suffolkcountyny.gov/gis/home/.
Tagliaferri, T.N., Fisher, S.C., Kephart, C.M., Cheung, N., Reed, A.P., and Welk, R.J., 2021, Methodology and quality-assurance for a study using microbial source tracking to identify contamination sources in fecal contaminated embayments on Long Island, New York: U.S. Geological Survey Scientific Investigations Report 2021–5033, 8 p., https://doi.org/10.3133/sir20215033.
U.S. Food and Drug Administration, 2019, National shellfish sanitation program—Guide for the control of molluscan shellfish—2019 revision: U.S. Food and Drug Administration, 502 p., accessed March 1, 2021, at https://www.fda.gov/food/federalstate-food-programs/national-shellfish-sanitation-program-nssp.
U.S. Geological Survey, 2020a, USGS water data for the nation: U.S. Geological Survey National Water Information System database, accessed July 31, 2020, at https://doi.org/10.5066/F7P55KJN.
U.S. Geological Survey, 2020b, National land cover database: U.S. Geological Survey data, accessed March 30, 2021, at https://www.usgs.gov/centers/eros/science/national-land-cover-database.
Appendix 1. Sample Collection in Patchogue Bay on Long Island, New York
Table 1.1.
Locations where samples were collected in Patchogue Bay on Long Island, New York, for bacterial genetic markers and fecal coliform analysis.[Data are from the National Water Information System (U.S. Geological Survey, 2020). Samples collected include blanks and replicates. Sample conditions of wet and dry indicate whether a sample was influenced by storm or nonstorm conditions, respectively. EST, eastern standard time; —, sample collected irrespective of wet or dry conditions]
Table 1.2.
Data summary of all samples collected in Patchogue Bay on Long Island, New York, for bacterial genetic markers and fecal coliform analysis.[Data are from the National Water Information System (U.S. Geological Survey, 2020). Samples collected include blanks and replicates. Bacterial genetic markers are human-associated Bacteroides (HF183), ruminant-associated Bacteroides (Rum2Bac), waterfowl-associated Helicobacter (GFD), and canine-associated Bacteroides (BacCan) markers. Bacteroides samples were analyzed by the U.S. Geological Survey Ohio Microbiology Laboratory. Fecal coliform samples were analyzed by the Suffolk County Department of Health Services Public and Environmental Health Laboratory unless denoted with a double asterisk (**), which indicates the sample was analyzed by the New York Department of Environmental Conservation Marine Laboratory. Bacterial genetic marker values in bold indicate that the concentration was greater than the reporting limit; values preceded by a less than (<) symbol indicate the reporting limit for a given assay when a nondetect occurred. EST, eastern standard time; copies/100 mL, copies per 100 milliliters; MPN/100 mL, most probable number per 100 milliliters; E, estimate; b, concentration was greater than the limit of quantification but less than the reporting limit; ~, duplicate qPCR results do not agree; *, measured in copies of genetic marker per gram dry weight; —, assay was not performed]
Reference Cited
U.S. Geological Survey, 2020, USGS water data for the nation: U.S. Geological Survey National Water Information System database, accessed July 31, 2020, at https://doi.org/10.5066/F7P55KJN.
Appendix 2. Sample Collection in Bellport Bay on Long Island, New York
Table 2.1.
Locations where samples were collected in Bellport Bay on Long Island, New York, for bacterial genetic markers and fecal coliform analysis.[Data are from the National Water Information System (U.S. Geological Survey, 2020). Samples collected include blanks and replicates. Sample conditions of wet and dry indicate whether a sample was influenced by storm or nonstorm conditions, respectively. —, sample collected irrespective of wet or dry conditions]
Table 2.2.
Data summary of all samples collected in Bellport Bay on Long Island, New York, for bacterial genetic markers and fecal coliform analysis.[Data are from the National Water Information System (U.S. Geological Survey, 2020). Samples collected include blanks and replicates. Bacterial genetic markers are human-associated Bacteroides (HF183), ruminant-associated Bacteroides (Rum2Bac), waterfowl-associated Helicobacter (GFD), and canine-associated Bacteroides (BacCan) markers. Bacteroides samples were analyzed by the U.S. Geological Survey Ohio Microbiology Laboratory. Fecal coliform samples were analyzed by the Suffolk County Department of Health Services Public and Environmental Health Laboratory unless denoted with a double asterisk (**), which indicates the sample was analyzed by the New York Department of Environmental Conservation Marine Laboratory. Bacterial genetic marker values in bold indicate that the concentration was greater than the reporting limit; values preceded by a less than (<) symbol indicate the reporting limit for a given assay when a nondetect occurred. copies/100 mL, copies per 100 milliliters; MPN/100 mL, most probable number per 100 milliliters; E, estimate; b, concentration was greater than the limit of quantification but less than the reporting limit; ~, duplicate qPCR results do not agree; *, measured in copies of genetic marker per gram dry sediment; —, assay was not performed]
Reference Cited
U.S. Geological Survey, 2020, USGS water data for the nation: U.S. Geological Survey National Water Information System database, accessed July 31, 2020, at https://doi.org/10.5066/F7P55KJN.
Supplemental Information
Concentrations of chemical constituents in water are given in milligrams per liter (mg/L).
Concentrations of fecal coliform bacteria are given in most probable number per 100 milliliters (MPN/100 mL).
Concentrations of microbial source tracking markers are given in marker copies per 100 milliliters (copies/100 mL) or marker copies per gram dry weight (copies/gdw).
Abbreviations
BacCan
canine-associated Bacteroides marker
FC
fecal coliform bacteria
GFD
waterfowl-associated Helicobacter marker
HF183
human-associated Bacteroides marker
MPN
most probable number
MST
microbial source tracking
NWIS
National Water Information System
NYSDEC
New York State Department of Environmental Conservation
Rum2Bac
ruminant-associated Bacteroides marker
USGS
U.S. Geological Survey
For more information, contact
Director, New York Water Science Center
U.S. Geological Survey
425 Jordan Road
Troy, NY 12180–8349
dc_ny@usgs.gov
or visit our website at
https://www.usgs.gov/centers/ny-water
Publishing support provided by the Pembroke Publishing Service Center
Disclaimers
Any use of trade, firm, or product names is for descriptive purposes only and does not imply endorsement by the U.S. Government.
Although this information product, for the most part, is in the public domain, it also may contain copyrighted materials as noted in the text. Permission to reproduce copyrighted items must be secured from the copyright owner.
Suggested Citation
Tagliaferri, T.N., Fisher, S.C., Kephart, C.M., Cheung, N., Reed, A.P., and Welk, R.J., 2022, Using microbial source tracking to identify fecal contamination sources in Patchogue and Bellport Bays on Long Island, New York: U.S. Geological Survey Scientific Investigations Report 2022-5007, 30 p., https://doi.org/10.3133/sir20225007.
ISSN: 2328-0328 (online)
Study Area
| Publication type | Report |
|---|---|
| Publication Subtype | USGS Numbered Series |
| Title | Using microbial source tracking to identify fecal contamination sources in Patchogue and Bellport Bays on Long Island, New York |
| Series title | Scientific Investigations Report |
| Series number | 2022-5007 |
| DOI | 10.3133/sir20225007 |
| Publication Date | March 30, 2022 |
| Year Published | 2022 |
| Language | English |
| Publisher | U.S. Geological Survey |
| Publisher location | Reston, VA |
| Contributing office(s) | New York Water Science Center |
| Description | Report: vii, 30 p.; Database |
| Country | United States |
| State | New York |
| Other Geospatial | Long Island, Patchogue Bay, Bellport Bay |
| Online Only (Y/N) | Y |
| Additional Online Files (Y/N) | N |