

Revisions to the Virginia Coastal Plain Hydrogeologic Framework Southwest of the James River
Links
- Document: Report (3.91 MB pdf) , HTML , XML
- Data Release: USGS data release - Shapefiles of hydrogeologic unit extents and top-surface altitude contours used in the revised hydrogeologic framework for the Virginia Coastal Plain Southwest of the James River
- Download citation as: RIS | Dublin Core
Acknowledgments
Special thanks should be given to Scott Bruce and Todd Beach of the Virginia Department of Environmental Quality for their efforts in drilling new boreholes, logging wells, collecting sediment cores and cuttings, and creating the preliminary sediment logs in the field. Thanks to Jason Pope (U.S. Geological Survey) and Andrew Staley (Maryland Geological Survey) for providing thorough colleague reviews of this report.
Abstract
New drilling information reveals that altitudes of some hydrogeologic units of the Virginia Coastal Plain aquifer system differ by as much as 50 feet (ft) from those previously known, namely the Aquia and Potomac aquifers, the Potomac confining zone, and the Nanjemoy-Marlboro and Saint Marys confining units. In addition, the lateral margins of some hydrogeologic units are located as much as several miles from previously estimated locations. The largest revisions to unit margins were for the Aquia aquifer and the Nanjemoy-Marlboro and Saint Marys confining units. Interpretation of new geophysical logs, sediment core, and cuttings as well as revised interpretations to existing data indicate channels and embayments are also preserved on eroded top surfaces of the shallowest hydrogeologic units including the Yorktown confining zone, Yorktown-Eastover aquifer, Saint Marys confining unit, Potomac confining zone, and Potomac aquifer.
Enhanced details on the configuration of part of the aquifer system southwest of the James River are provided by sediment cores and cuttings as well as geophysical logs from 36 recently drilled boreholes. These, along with reinterpretation of data from 93 preexisting boreholes, form the basis for revised top-surface altitudes and margins of hydrogeologic units beneath parts of Prince George, Surry, Sussex, Isle of Wight, and Southampton Counties and the cities of Franklin and Suffolk.
Groundwater withdrawals in the Virginia Coastal Plain cause widespread water-level declines, create the potential for saltwater intrusion, and contribute to regionwide land subsidence. A description of the aquifer system, termed a hydrogeologic framework, was developed by the U.S. Geological Survey in 2006 and provides information needed to base withdrawal-permitting decisions by the Virginia Department of Environmental Quality. This revision of part of the hydrogeologic framework southwest of the James River is based on interpretations of both new and previously analyzed borehole data. The revision is strictly confined to the study area extent and hydrogeologic units not found within the study area were not revised and are not discussed in this report. The newly determined hydrogeologic-unit altitudes and margins have implications for groundwater-withdrawal permitting. New interpretations have found that the Yorktown Eastover aquifer is absent in the southwestern part of the City of Suffolk, owing to what is most likely an isolated area of sediment-texture facies change. Most notably, the top-surface altitudes of the Aquia and Potomac aquifers have been lowered by as much as 50 ft from previous interpretations. This means that wells previously believed to be screened in the top of the Potomac aquifer could, based on these new interpretations, be screened in the bottom of the Aquia aquifer. These changes to aquifers in which wells are screened means that there is potentially more room in the groundwater withdrawal permitting for the Potomac aquifer, the largest and most productive aquifer in Virginia, and overpumping occurring in the Aquia aquifer.
Introduction
During 2000–04, a hydrogeologic framework of the Virginia Coastal Plain was developed by the U.S. Geological Survey (USGS) in cooperation with the Virginia Department of Environmental Quality (VA DEQ) (McFarland and Bruce, 2006). The framework was developed to be “an information resource for groundwater investigation and development by providing a geologic understanding of the Virginia Coastal Plain in a hydrologic context” (McFarland and Bruce, 2006). The framework was created to provide a sound scientific basis for resource management decisions in the Virginia Coastal Plain, and since its publication, has provided the scientific backbone to groundwater management in the Coastal Plain overseen by the VA DEQ.
The Virginia Coastal Plain is underlain by a layered series of unconsolidated sediments. The hydrogeologic framework describes the compositions, configurations, and other aspects of the aquifers and intervening confining units (McFarland and Bruce, 2006). As a result of sparse surface exposures, the aquifers and confining units were characterized almost entirely using information from boreholes. The thicknesses, altitudes, and geographic extents of aquifers and confining units were delineated by stratigraphically correlating geophysical logs and other borehole information. Because sediment composition varies laterally, the aquifers and confining units have varied extents that result in a complex and overlapping heterogeneous configuration. The margins of the aquifers and confining units are divergent, and none of the aquifers or confining units extend across the entire Virginia Coastal Plain. The hydrogeologic units relevant for this report are shown in a simplified stratigraphic column modified from McFarland and Bruce (2006) (fig. 1).
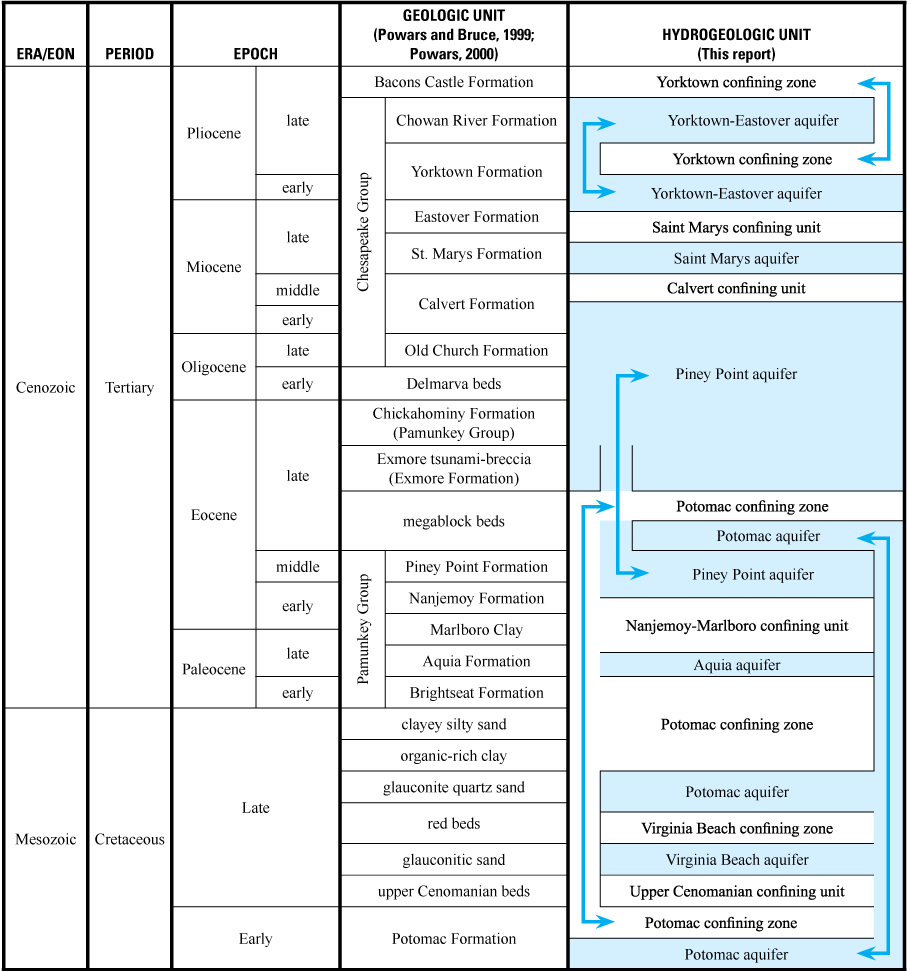
Stratigraphic correlations of hydrogeologic units of the Virginia Coastal Plain. Vertical arrows indicate major hydrologic associations that cross stratigraphic boundaries. Minor overlaps of hydrogeologic units among adjacent geologic formations are not depicted.
The hydrogeologic framework was developed primarily from geophysical logs. Geophysical logs are obtained at relatively low cost and record various sediment properties along the vertical borehole interval, but only indirectly reflect sediment composition. Interpretation of geophysical logs is subjective and heavily dependent upon additional direct observation of sediment composition in cores and cuttings collected during drilling, which is costly and labor intensive. Consequently, sediment composition has been directly observed in cores or cuttings at only 21 of the boreholes within the study area, which encompasses Sussex, Surry, Southampton, and Isle of Wight Counties as well as the cities of Franklin and Suffolk. Moreover, most geophysical logs were interpreted without corresponding sediment observations from the same borehole. Instead, sediment observations at the minority of boreholes were extrapolated as a basis to interpret geophysical logs from numerous additional boreholes in surrounding areas. Sediment observations used for the hydrogeologic framework, however, were not uniformly distributed geographically. Interpretations of geophysical logs located in proximity to sediment observations can be viewed with relatively strong confidence, whereas interpretations at greater distances are more uncertain.
Sediments were not originally directly observed in parts of eastern Sussex County, southern Surry County, northern Southampton County, or western and northern Isle of Wight County during the compilation of the 2006 framework. However, sediment observations from boreholes that were drilled since the 2006 hydrogeologic framework was developed now have implications for how geophysical logs from other boreholes were originally interpreted. The discrepancies observed between these new sediment samples and the original framework necessitated a revision to the existing framework for the area of the Coastal Plain that lies southwest of the James River. Thus, the USGS, in cooperation with the VA DEQ, conducted a study during 2019–20 to revise the existing framework southwest of the James River by reinterpreting geophysical logs used for the original framework in light of sediment observations and geophysical logs obtained from boreholes drilled since the original framework was conducted. This revision includes the original dataset from the 2006 framework, in addition to data from 36 new boreholes drilled since the original framework. The study area contains Isle of Wight, Prince George, Southampton, Surry, and Sussex Counties, as well as the cities of Franklin and Suffolk.
The changes made to the configuration of hydrogeologic units in this report will influence how VA DEQ manages permitted groundwater withdrawals from these units. This is important as groundwater withdrawals can be a mechanism for lateral saltwater intrusion and upconing of the freshwater-saltwater interface (Werner and others, 2013). This is a concern in Surry and Isle of Wight Counties, and the city of Suffolk, which all border the James River. The specific conductance of the James River at Black Point, Jamestown Island, varies from about 500 microsiemens per centimeter (μS/cm) during high stage events to about 14,000 μS/cm, roughly 10 times the upper limit for drinking water, at baseflow stage (Ladd, 2020). Furthermore, as the aquifers in the study area continue across much of the Coastal Plain, these changes will influence permitting outside of the study area, where multiple forms of saltwater intrusion (lateral intrusion, upconing, and so forth) are possible. VA DEQ uses aquifer top-surface altitudes to model allowable drawdown limits and determine maximum legal pump intake depths. Groundwater withdrawals contribute to land subsidence in the Virginia Coastal Plain and land subsidence is one element of a number of mechanisms that make the southern Chesapeake Bay region home to the highest rates of relative sea-level rise on the Atlantic Coast of the United Sates (Eggleston and Pope, 2013); this region includes all of the study area except Prince George and Sussex Counties,
Purpose and Scope
The 2019–20 study amends the observations and conclusions made in the 2006 framework based on information from sediment observations of 36 new boreholes in Surry, Sussex, Southampton, and Isle of Wight Counties, as well as the cities of Franklin and Suffolk southwest of the James River in the Coastal Plain of Virginia, and a reanalysis of the geographically relevant logs from the 2006 framework in the same area (fig. 2). This revision to the Virginia Coastal Plain hydrogeologic framework changes hydrogeologic unit margins and top-surface altitudes, which have implications for groundwater withdrawal permitting in the affected aquifers. New sediment cores and cuttings have been collected from 16 of the 36 new boreholes, 9 of which are in areas that previously lacked any sediment observations. Twenty-one out of the 36 new boreholes include geophysical logs and are located in the area southwest of the James River, specifically eastern Sussex County, southern Surry County, northern Southampton County, and western and northern Isle of Wight County (fig. 2). Thus, the analysis and revisions contained in this report are confined to the study area and any hydrogeologic units not found therein are not discussed. As this is a revision to an existing framework, much of the background and previous investigation geological work are described in the 2006 framework report (McFarland and Bruce, 2006) Additionally, the extent and top-surface altitude of the Potomac aquifer was revised in McFarland (2013). Discussion of hydrogeologic units is limited to differences from the original framework in unit extent, top and bottom altitudes, and characterization of sediment and hydrologic properties.
Description of Study Area
This revised framework composes an area of approximately 1,660 square miles (mi2) in Surry, Sussex, Southampton, and Isle of Wight Counties, as well as the cities of Franklin and Suffolk, southwest of the James River in the Coastal Plain of Virginia (fig. 2). McFarland and Bruce (2006) provide detail on climate, terrain, and rivers in the study area.
The study area is part of the Coastal Plain physiographic province in Virginia. Coastal Plain aquifers in Virginia have been previously mapped with respect to the margins of the aquifers and tops and bottoms of aquifers and confining units (McFarland and Bruce, 2006). Shapefiles compatible with geographic information system (GIS) software that show the extent and tops and bottoms of Coastal Plain aquifers and confining units in Virginia have been revised and published in a data release accompanying this report to reflect the changes made to the Coastal Plain aquifers and confining units southwest of the James River assessed for this study (Caldwell and McFarland, 2022).
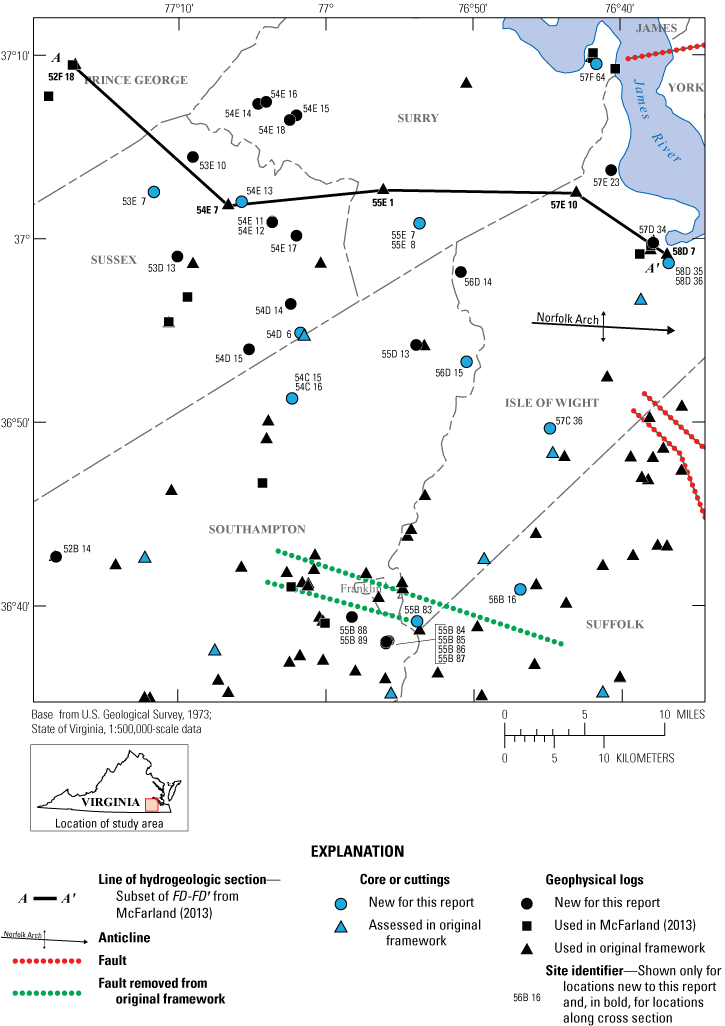
The study area included in the hydrologic framework revision. Borehole data sites differentiated by type of data collected and if a site was used in the 2006 framework.
Geologic Setting
The geology of the study area is characterized by a deep, seaward thickening wedge of unconsolidated to partly consolidated sediment. The top of the crystalline basement can be as deep as 1,500 feet (ft) (McFarland and Bruce, 2006), and is unconformably overlain by unconsolidated to partly consolidated sediments of Cretaceous, Paleogene, Neogene, and Quaternary age (Meng and Harsh, 1988), which in the study area forms an uplifted structural feature known as the Norfolk Arch (fig. 2). The Norfolk Arch causes the sediment overlying the bedrock in this area to be thinner than in other places of similar longitude. The sediments in this area follow the general trend of Virginia Coastal Plain sediments: a sediment wedge that thickens seaward to the east and thins to the west toward the Fall Zone (fig. 3). Most Coastal Plain units pinch out before or at the Fall Zone, where the Coastal Plain transitions to the Piedmont physiographic province.
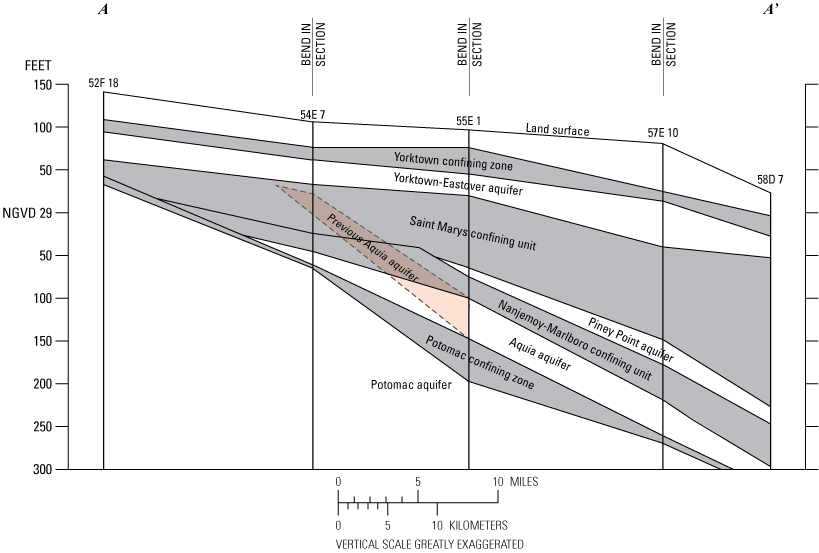
A modified excerpt from section FD-FD' of the hydrogeologic framework of the Virginia Coastal Plain (McFarland and Bruce, 2006). A revised correlation of the Aquia aquifer at borehole 54E 7 is based on more recent observation of sediment cuttings collected nearby from borehole 54E 13.
Groundwater Conditions
Sedimentary strata in the study area form a hydrogeologic framework of aquifers and confining units on the basis of differences in permeability. These units, owing to the presence of the Norfolk Arch, are thinner, shallower, and more variable in lateral extent than those same hydrogeologic units elsewhere in the Coastal Plain. Groundwater in the study area is present in pores between sediment grains and is recharged primarily by precipitation infiltration and percolation to the water table. The stratification of sediments in this area generally leads to greater horizontal hydraulic conductivity than vertical hydraulic conductivity, with flow generally down-dip to the east. In 2019, groundwater withdrawals in the State of Virginia totaled 139.3 million gallons per day (Mgal/d), with the majority of groundwater withdrawals located in the Coastal Plain (Virginia Department of Environmental Quality, 2020). The counties and cities within the study area account for 19.5 percent (27.17 Mgal/d) of 2019 groundwater withdrawals statewide. Isle of Wight County is the largest groundwater user in the study area at 14.62 Mgal/d (Virginia Department of Environmental Quality, 2020).
Methods of Investigation
The original framework for the Virginia Coastal Plain was based on a network of 403 boreholes selected from those on record at the USGS Virginia and Water Science Center in Richmond, Virginia (McFarland and Bruce, 2006). Of those 403 boreholes, 93 are located within the area of the revised framework presented here. The revision is based on information from 36 additional boreholes for a total of 129 boreholes within the area.
The same methodology used to analyze borehole logs in the original framework (McFarland and Bruce, 2006) was used to analyze logs in the revised framework. The methodology of geophysical log interpretation is described in Keys (1990), and its application to the Virginia Coastal Plain is described in Meng and Harsh (1988). The logs collected since the original framework are primarily multi-tool geophysical logs. These logs display fluid resistivity, spontaneous potential, natural gamma radiation, lateral resistance, 64N resistance, 16N resistance, and single point resistance with depth in the borehole (fig. 4). When interpreting geophysical logs, coarse-grained permeable sediments are generally associated with high resistivity and low natural gamma signatures. In contrast, fine-grained, less permeable sediments are generally associated with low resistivity and high natural gamma signatures. Patterns of permeable and impermeable sediments in geophysical logs, which are confirmed by direct sediment observations of cores or cuttings, are correlated across the study area to generate interpreted topographic surfaces of top-surface altitudes for the hydrogeologic units within the study area. A more thorough description of this methodology is available in McFarland and Bruce (2006). The interpreted and observed aquifer top-surface altitudes in each borehole used in this study to create the figures in this report are available online (Caldwell and McFarland, 2022). Shapefiles of the revised aquifer margins and top-surface altitudes used to create the figures included in this report also are available online (Caldwell and McFarland, 2022).
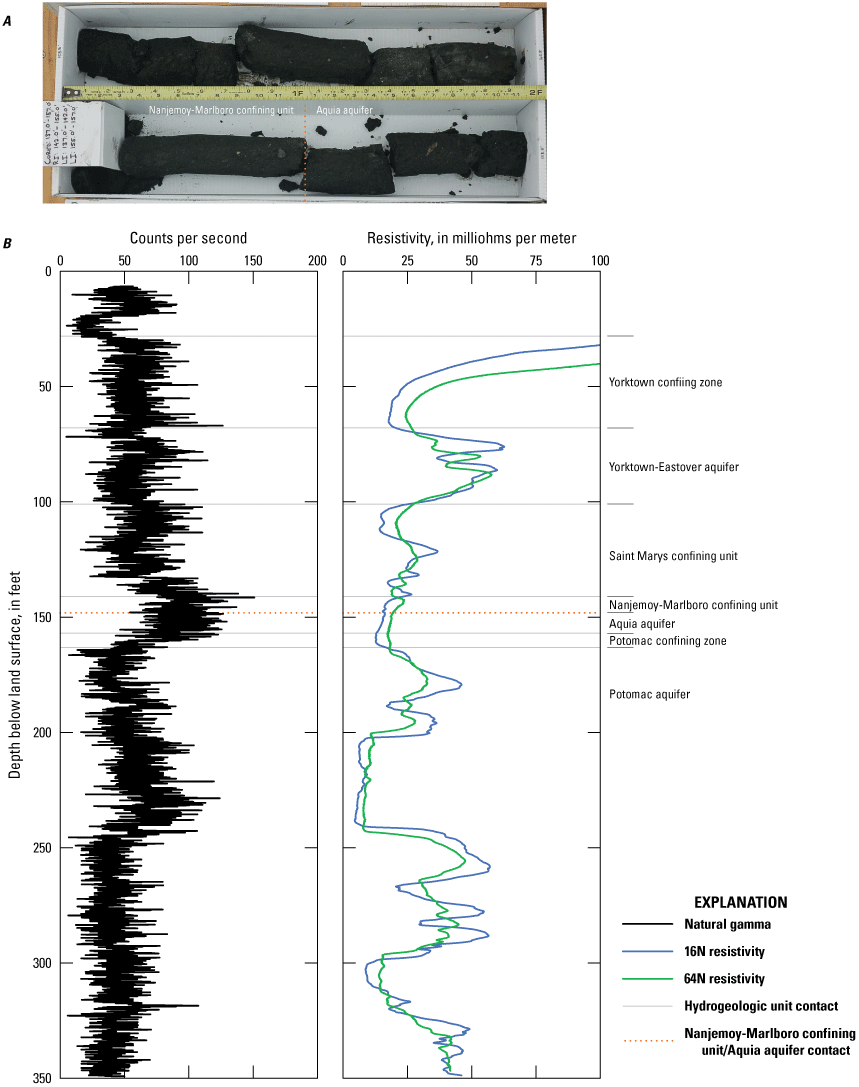
Natural gamma (black), 16N resistivity (blue), and 64N resistivity (green) log data for borehole 54C 16 with hydrogeologic unit top surfaces (grey) and the Aquia aquifer top surface (red). The photograph shows the Aquia aquifer top surface from the rotosonic sediment core collected at borehole 54C 15.
Borehole Geophysical Log Network
This report was based on data from 129 boreholes within the study area. Thirty-six of those 129 boreholes provide new data collected after the original framework was completed, giving more context and resolution for the study area. These new data include multi-tool geophysical logs of 125 boreholes, 21 of which exist in a digital format, with associated descriptions of sediment lithology for select wells. Four borehole logs have information only on sediment lithology. All logs used in the revision can be viewed online using the Geolog Locator tool (U.S. Geological Survey, 2020). Data from the original framework included sediment core from a single borehole located on the Sussex-Southampton County line (borehole 54D 5). All other cores or cuttings were collected between 15 and 20 miles to the south and east. Sediment cores and cuttings have since been collected from 16 boreholes, most notably a sediment core collected during the installation of a well in Waverly, Virginia (54E 13), which provided direct observations of the Aquia aquifer 50 ft deeper than interpretations from the 2006 framework placed it. Nine of these boreholes are in areas that previously lacked any sediment observations. Additional geophysical logs have been obtained from 21 boreholes. Information on each borehole such as station ID, site number, latitude, longitude, and top-surface altitudes of hydrogeologic units observed and interpreted to be at that borehole is available in Caldwell and McFarland (2022).
Borehole Data Quality
Intervals interpreted on geophysical logs as aquifers or confining units were tabulated by their respective top-surface altitudes. All hydrogeologic unit top-surface altitudes were referenced to the National Geodetic Vertical Datum of 1929 (NGVD 29), as calculated from surface depths below the altitudes of land surface at the borehole locations. Most borehole-location altitudes were estimated from topographic maps to within ±5 ft. Additionally, borehole-measured depths for geophysical logs and associated data commonly vary by several feet, depending on whether the measurement was taken from the land surface, the top of the well casing, or some other datum usually not specified.
Revision of Coastal Plain Hydrogeologic Framework
The Virginia Coastal Plain southwest of the James River has several aspects that challenge accurate delineation of aquifers and confining units, and those—without adequate observations of sediment composition—hindered earlier development of the hydrogeologic framework. The area is underlain by an uplifted part of basement known as the Norfolk Arch. As a result, aquifers and confining units that are thick, deep, and laterally extensive farther north are thinner and shallower in the vicinity of the arch. In addition, their lateral extents are more variable. Although the Potomac aquifer extends nearly to the western boundary of the Coastal Plain at the Fall Line, most overlying aquifers and confining units pinch out farther to the east (fig. 3).
The margins of the aquifers and confining units are spatially divergent, however, and their extents are uncertain. The advent and analysis of the additional borehole logs and cuttings, particularly the borehole log and analysis of cuttings from well 54E 13 in the town of Waverly (fig. 3), highlighted the need for a revised framework of the Virginia Coastal Plain in the area southwest of the James River. The new cuttings and cores collected confirmed that the Aquia aquifer is significantly lower in the sediment strata than previously interpreted. No hydrogeologic units are added or removed as a result of this study, and there are no dramatic structural features affecting stratigraphy in the study area. As such, the regional stratigraphic column presented in McFarland and Bruce (2006) is still applicable. Units designated as confining zones are done so to account for “variable configurations and, in some cases, indistinguishable relations that can exist” between the underlying and overlying hydrogeologic units (McFarland and Bruce, 2006).
Interpretive Analysis
Data from 36 new boreholes, including 10 boreholes where cores or cuttings were collected, greatly increased the density of direct sediment observations. The increased resolution, particularly in direct sediment observations, provides much greater confidence in the interpreted absence, presence, and top-surface altitude—where present—of hydrogeologic units identified from the geophysical log data. As this report is a revision of an existing framework, the interpretive analysis focuses mainly on the difference in extent and depth of the top-surface altitudes of hydrogeologic units. Boreholes from the original framework that lie within the study area were reinterpreted for this revision, along with the interpretation of new data. Top-surface altitude contours a few miles beyond the study area have been slightly revised to blend the revised contours of the study area with the unrevised contours in the rest of the Virginia Coastal Plain. In this area of the Coastal Plain, the basal layer of the Saint Marys confining unit is often phosphatic, giving it high gamma and low resistivity readings in logs. The Aquia aquifer is rich in glauconite and finer grained in this area than in other parts of the Coastal Plain. This leads the Aquia aquifer to appear more like a confining unit in borehole geophysical logs in the study area by showing high gamma and low resistivity readings in geophysical log data. Additionally, sediments of the Nanjemoy and Aquia Formations are very similar, and oftentimes indistinguishable when the Marlboro Clay is not present to split the two formations, as is common within the study area (McFarland and Bruce, 2006). As a result, the contacts between both the Saint Marys confining unit and Aquia aquifer, and the Nanjemoy-Marlboro confining unit and Aquia aquifer are often impossible to identify in a geophysical log without cores or cuttings from the well or nearby to directly observe those contacts (fig. 4). The following analyses of the different hydrogeologic units found within the study area are limited to the changes in the margins and top-surface altitudes of the units. The characterization of the sediment to identify the units has not changed since the original framework and therefore is not discussed.
Changes to Hydrogeologic Units from Original Framework
The confirmation of the presence of the Aquia aquifer deeper in the sediment strata within the study area necessitated a reexamination of logs, cores, and cuttings in the area, which resulted in new interpreted top-surface altitudes for some of the hydrogeologic units present. Two strike-slip faults interpreted in the 2006 framework in and near the city of Franklin have been removed (fig. 2), as the new data and reinterpretations of top-surface altitudes no longer support their existence. The top-surface altitudes of the units affected by the fault in the 2006 framework have been revised to show smooth contours in and around the city of Franklin. These smooth contours do not support the presence of faulting, unlike the angular contours shown in the figures of the 2006 framework. All angular offsets in the hydrogeologic unit top-surface altitude contours associated with those two faults have been removed. Most of the revised contours and margins vary slightly from the original margins and contours within the study area. Most of the changes to top-surface altitudes presented in this report reflect increased detail from the original framework, specifically in the top-surface altitudes of the hydrogeologic units. This increased detail revealed evidence for preserved incised river channels and embayments in many of the units. The largest change to both hydrogeologic unit margins and top-surface altitudes are in Sussex and Surry Counties, where only one sample of core or cuttings was available for the 2006 framework.
Potomac Aquifer
The Potomac aquifer margins do not lie within the study area and thus have not been changed, however, examination of data from 36 boreholes has provided finer detail as to the top-surface altitudes of the Potomac aquifer (fig. 5). Generally, the revised Potomac aquifer top-surface altitudes are significantly shallower than in the original framework in Sussex, Surry, and Southampton Counties. However, in some areas of Sussex and Southampton Counties, the newly interpreted top-surface altitudes in this aquifer can be as much as 50 ft shallower or deeper than the original framework. The angular contours associated with the two faults near the city of Franklin have been removed, as interpretation of new borehole and sediment data does not support the presence of faulting in the area. The mapped locations of the two faults in the city of Suffolk have not been changed. The contours remain largely unchanged in Suffolk, Isle of Wight, and western Surry Counties. Interpreted top-surface altitudes and their resulting contours in Sussex, Surry, and Southampton Counties indicate the possibility of preserved river-channel sands in the Potomac Formation beneath Surry and Sussex Counties (fig. 5). The discovery and interpretation of these preserved river channels has lowered the top-surface altitude of the Potomac aquifer across much of the counties where these features are present.
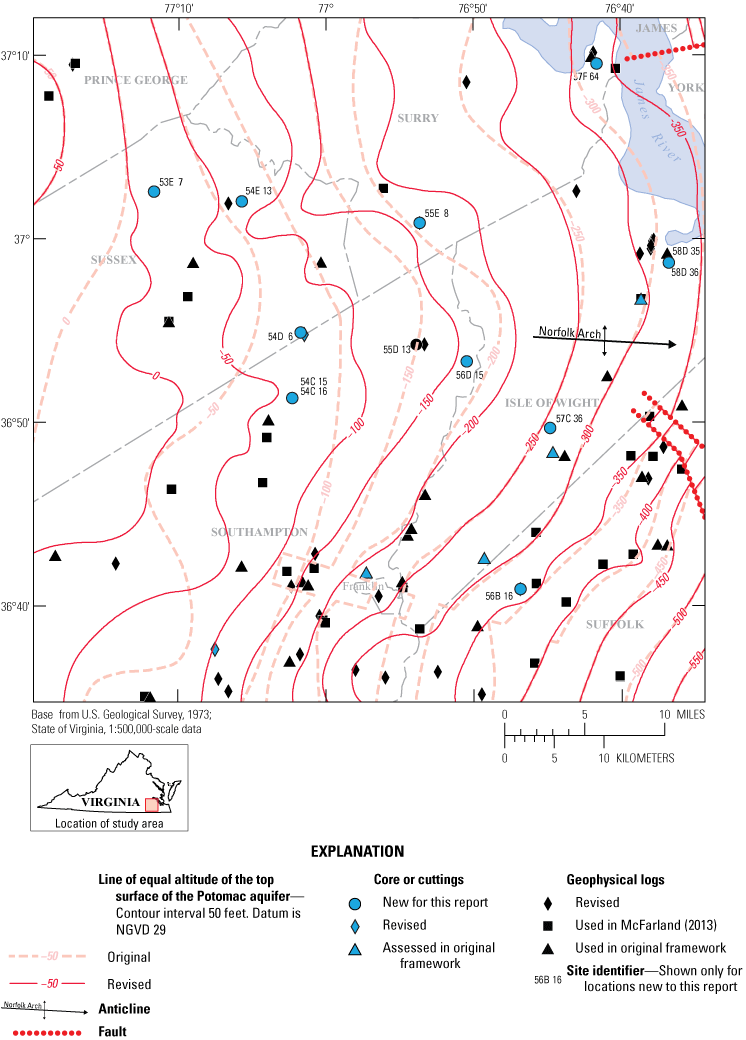
Original and revised approximate top-surface altitudes (National Geodetic Vertical Datum of 1929) for the Potomac aquifer. Borehole data sites, with interpreted unit top-surface altitude differentiated by type of data collected, and if a site was used in the 2006 framework.
Potomac Confining Zone
The Potomac confining zone contours are largely similar to those of the Potomac aquifer, but with shallower depths. The margin of the Potomac confining zone lies outside of the study area and was not revised (fig. 6). The areas of greatest change for the Potomac confining zone are Southampton and Sussex Counties, and the city of Franklin. Revisions in Isle of Wight and Surry Counties, and the city of Suffolk show relatively small changes from the original framework. The magnitude of the changes in altitude are not as pronounced as in the Potomac aquifer, never exceeding ±50 ft. New borehole data do not support the existence of faulting around Franklin, and thus the angular contours found in the original framework were removed. However, the faults in the city of Suffolk remain. Interpreted top-surface altitudes and their resulting contours indicate the possibility of preserved river-channel sands beneath Sussex and Southampton Counties (fig. 6).
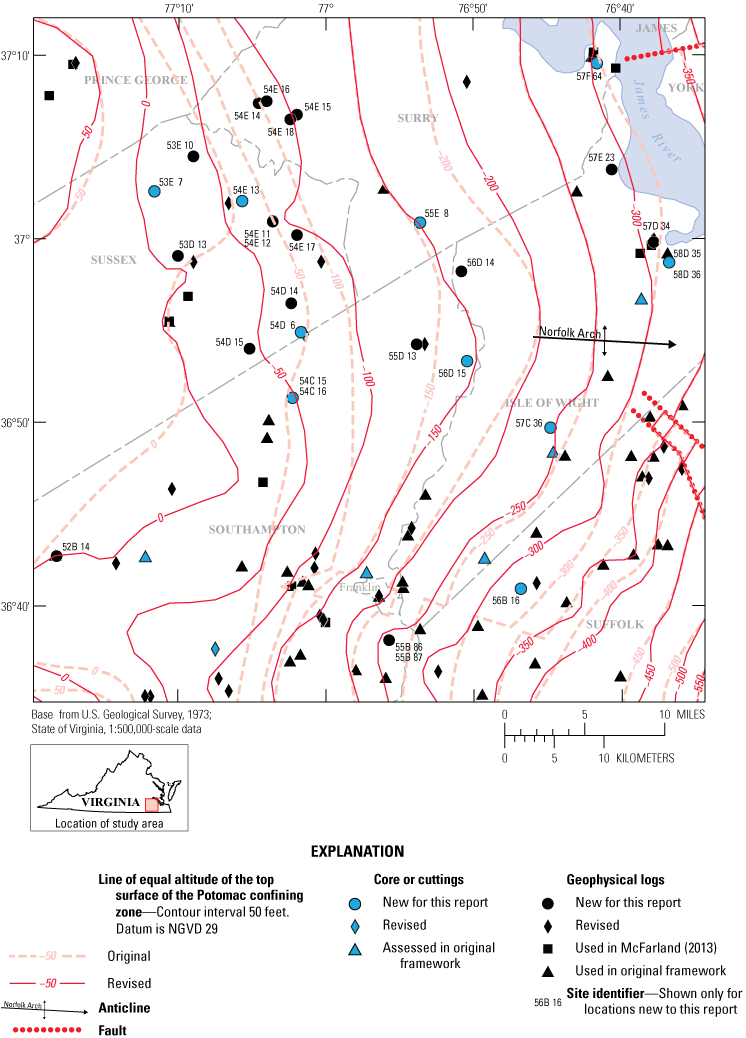
Original and revised approximate top-surface altitudes for the Potomac confining zone. Borehole data sites, with interpreted unit top-surface altitude differentiated by type of data collected, and if a site was used in the 2006 framework.
Upper Cenomanian Confining Unit
The margins of the Upper Cenomanian confining unit have been revised several miles to the west and north in Southampton and Isle of Wight Counties compared to the margins in the original framework (fig. 7). Consequently, the top-surface altitude contours reflect this change by showing slightly deeper altitudes than the original, particularly in Southampton County where top-surface altitudes for the Upper Cenomanian confining unit can be as much as 50 ft deeper in the sediment column than in the 2006 framework. The removal of the two faults near the city of Franklin is reflected in the revised contours as well (fig. 7).
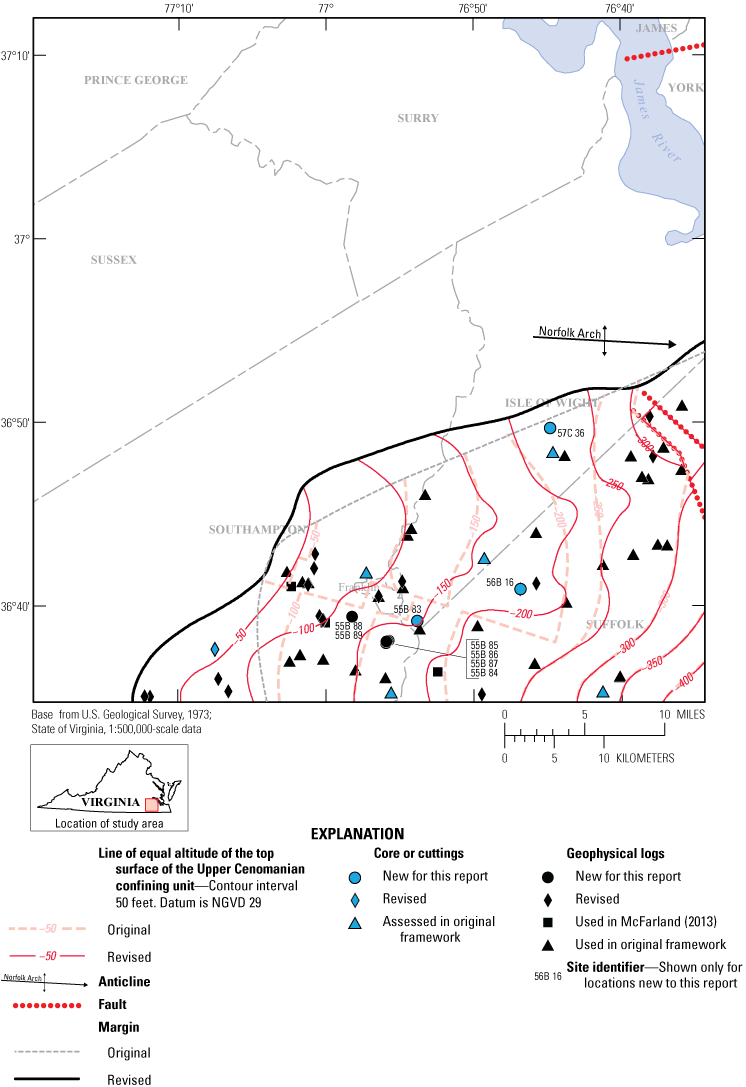
Original and revised margin and approximate top-surface altitudes (National Geodetic Vertical Datum of 1929) for the Upper Cenomanian confining unit. Borehole data sites, with interpreted unit top-surface altitude differentiated by type of data collected, and if a site was used in the 2006 framework.
Virginia Beach Aquifer
The Virginia Beach aquifer occupies a small section in the southern portion of the study area in Southampton County and the cities of Suffolk and Franklin. The revisions to this unit are small in both magnitude and scope. The margin has been revised so that it does not support the presence of faulting near the city of Franklin. Additionally, the margin has been revised slightly west and northward. Unit top-surface altitudes are largely the same as the original in the eastern and central parts of the study area, but there are larger differences to the west (fig. 8).
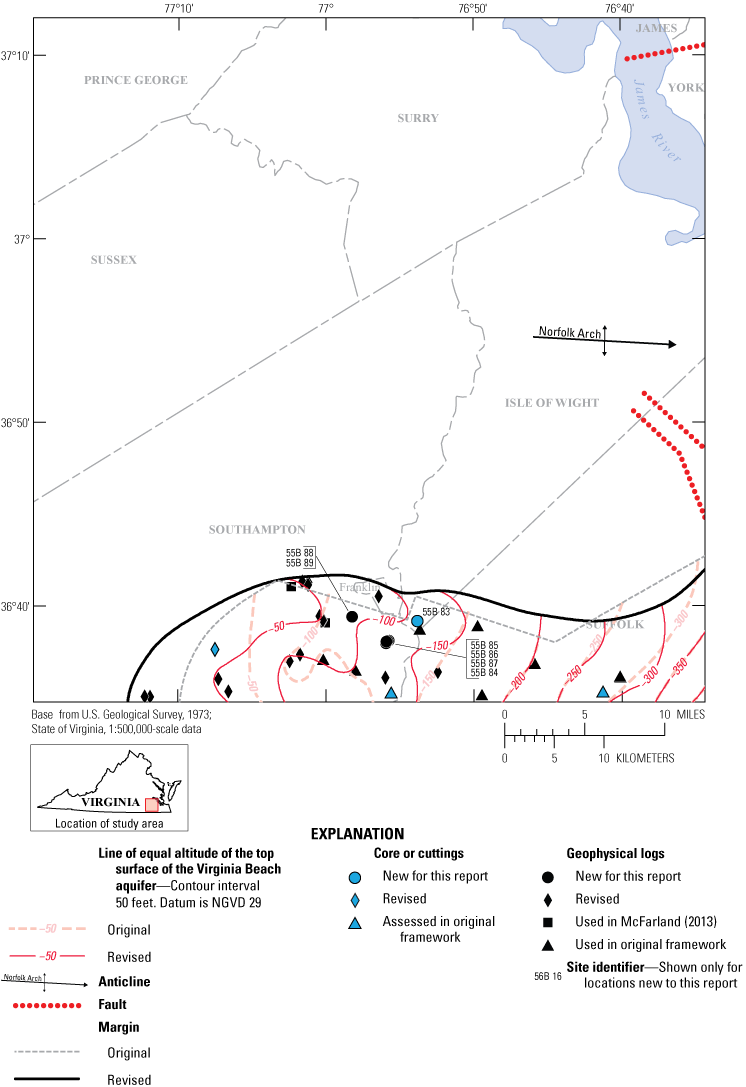
Original and revised margin and approximate top-surface altitudes (National Geodetic Vertical Datum of 1929) for the Virginia Beach aquifer. Borehole data sites, with interpreted unit top-surface altitude differentiated by type of data collected, and if a site was used in the 2006 framework.
Virginia Beach Confining Zone
The Virginia Beach confining zone is largely similar to the Virginia Beach aquifer in the changes to both its revised extent and revised top-surface altitudes. The revised aquifer margin has been slightly revised to the west and north in Southampton and Isle of Wight Counties and the city of Suffolk (fig. 9). The margin is no longer affected by the faulting around the city of Franklin that was present in the original framework but was removed in this revision. The top-surface altitudes are largely the same: slightly shallower at the north and western ends of the unit in Southampton County, and slightly deeper towards the east in Suffolk (fig. 9).
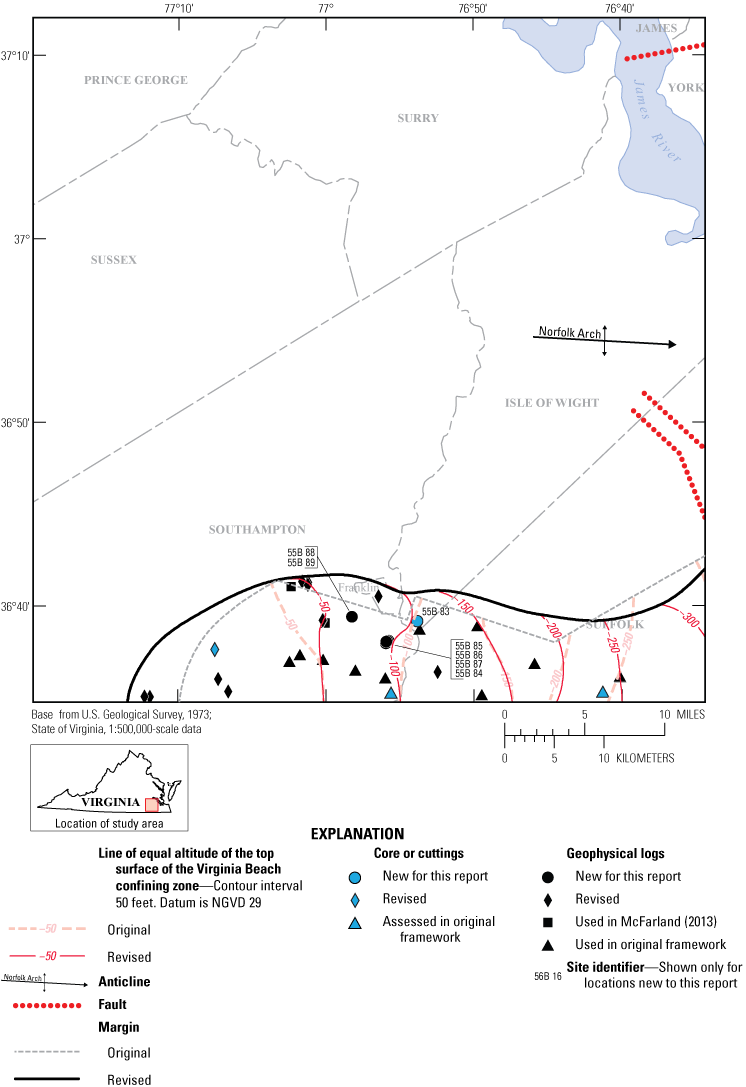
Original and revised margin and approximate top-surface altitudes (National Geodetic Vertical Datum of 1929) for the Virginia Beach confining zone. Borehole data sites, with interpreted unit top-surface altitude differentiated by type of data collected, and if a site was used in the 2006 framework.
Aquia Aquifer
Contours in the Aquia aquifer in the eastern portion of the study area in Surry and Isle of Wight Counties and the city of Suffolk are largely unchanged (fig. 10). On a broad level, the Aquia aquifer extent has been revised eastward to a small degree, and revised to be as much as 50 ft deeper in Prince George, Sussex, and Southampton Counties. The western margin of the Aquia aquifer has been revised several miles east in Prince George, Sussex, and most of Southampton County, with the exception of the southwest corner of the study area in Southampton County. The revised aquifer top-surface altitudes now place the Aquia aquifer almost completely below sea level, briefly rising above 0 ft in altitude near the west edge of the aquifer margin in Southampton County. The removal of the two faults near the city of Franklin is reflected in the smoother contours surrounding the city. Previously, the Aquia aquifer was interpreted to be overlain entirely by the Nanjemoy-Marlboro confining unit within the study area. However, several samples of cuttings and cores have yielded observations of the Saint Marys confining unit overlying the Aquia aquifer directly within the study area. Revised interpretations of geophysical logs from the original framework and an increased resolution in data from new geophysical logs and multiple cores or cuttings samples in areas that did not have sediment observations in the original framework have changed the top-surface altitudes in Sussex, Surry, and Prince George Counties. These revisions put the top of the Aquia aquifer as much as 50 ft deeper in the sediment column than in the original framework (fig. 10).
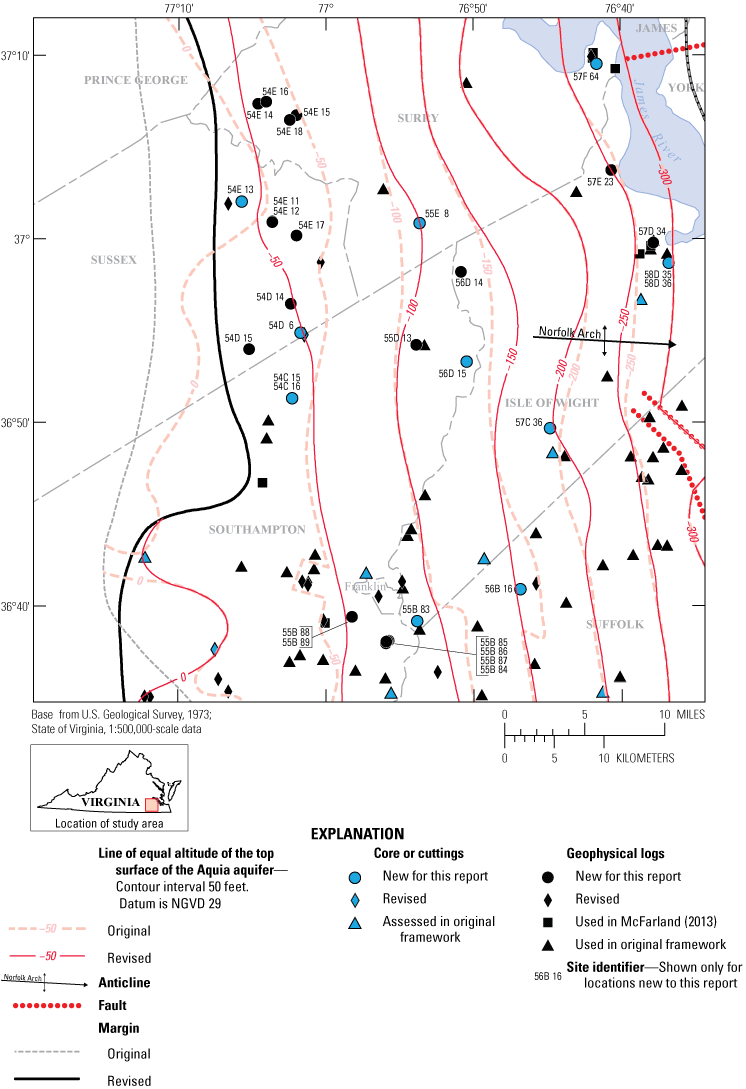
Original and revised margin and approximate top-surface altitudes (National Geodetic Vertical Datum of 1929) for the Aquia aquifer. Borehole data sites, with interpreted unit top-surface altitude differentiated by type of data collected, and if a site was used in the 2006 framework.
Nanjemoy-Marlboro Confining Unit
The Nanjemoy-Marlboro confining unit margin has the largest amount of change of any of the units discussed in this report (fig. 11). The western margin was revised several miles eastward from the original margin. This change is most pronounced in the northeast corner of the study area in Sussex and Prince George Counties, where the margin has been revised to be 10 or more miles eastward. Additionally, the Nanjemoy-Marlboro confining unit top-surface altitudes have been revised downward to be completely below sea level. In areas of Sussex County, top-surface altitudes have been revised to be as much as 50 ft deeper in the sediment column than the top-surface altitudes interpreted in the original framework. Most of the change to the Nanjemoy-Marlboro confining unit top-surface altitude from the original altitudes is limited to the western half of the study area. Top-surface altitudes in eastern Surry and Isle of Wight Counties and the city of Suffolk all remain largely unchanged from the original framework (fig. 11).
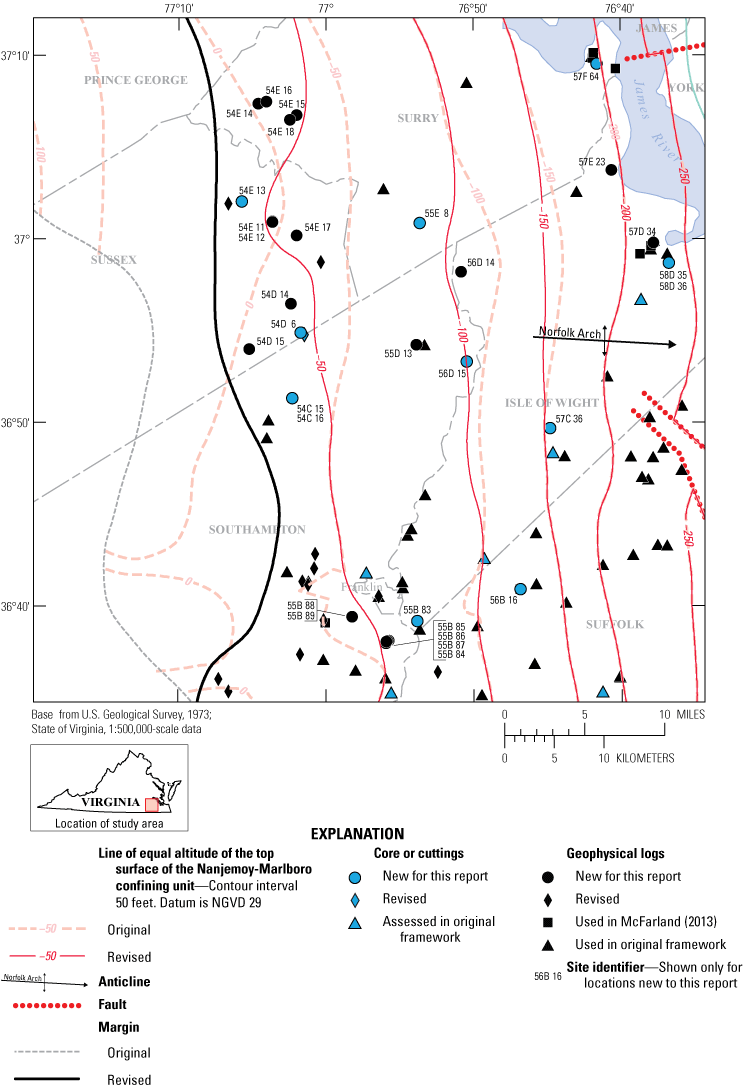
Original and revised margin and approximate top-surface altitudes (National Geodetic Vertical Datum of 1929) for the Nanjemoy-Marlboro confining unit. Borehole data sites, with interpreted unit top-surface altitude differentiated by type of data collected, and if a site was used in the 2006 framework.
Piney Point Aquifer
The revisions to the Piney Point aquifer have resulted in almost no change from the original framework. The southern end of the margin within Southampton County and the city of Franklin has been smoothed and revised slightly eastward. There has been almost no change to the interpreted top-surface altitudes for this unit within the study area (fig. 12).
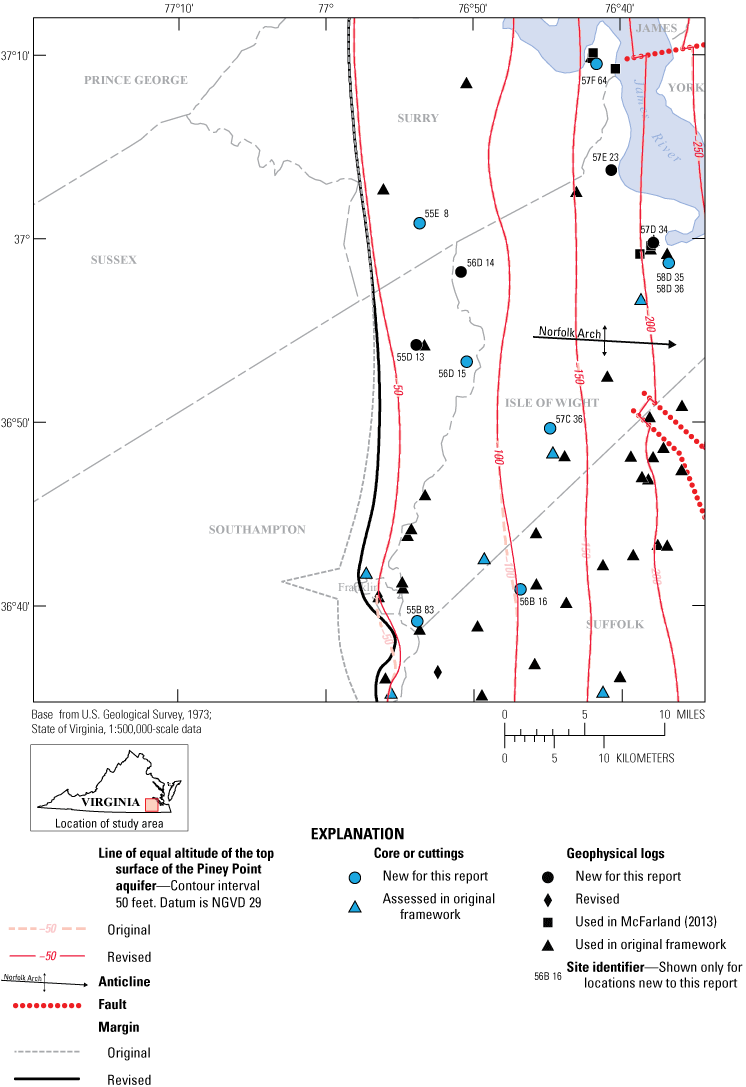
Original and revised margin and approximate top-surface altitudes (National Geodetic Vertical Datum of 1929) for the Piney Point aquifer. Borehole data sites, with interpreted unit top-surface altitude differentiated by type of data collected, and if a site was used in the 2006 framework.
Calvert Confining Unit
Revisions to the Calvert confining unit have similarly resulted in almost no change from the interpretations of the original framework. The margin has been revised west by a couple of miles in Isle of Wight County. In the city of Suffolk and Isle of Wight County, only small changes were made to the top-surface altitude of the Calvert confining unit (fig. 13).
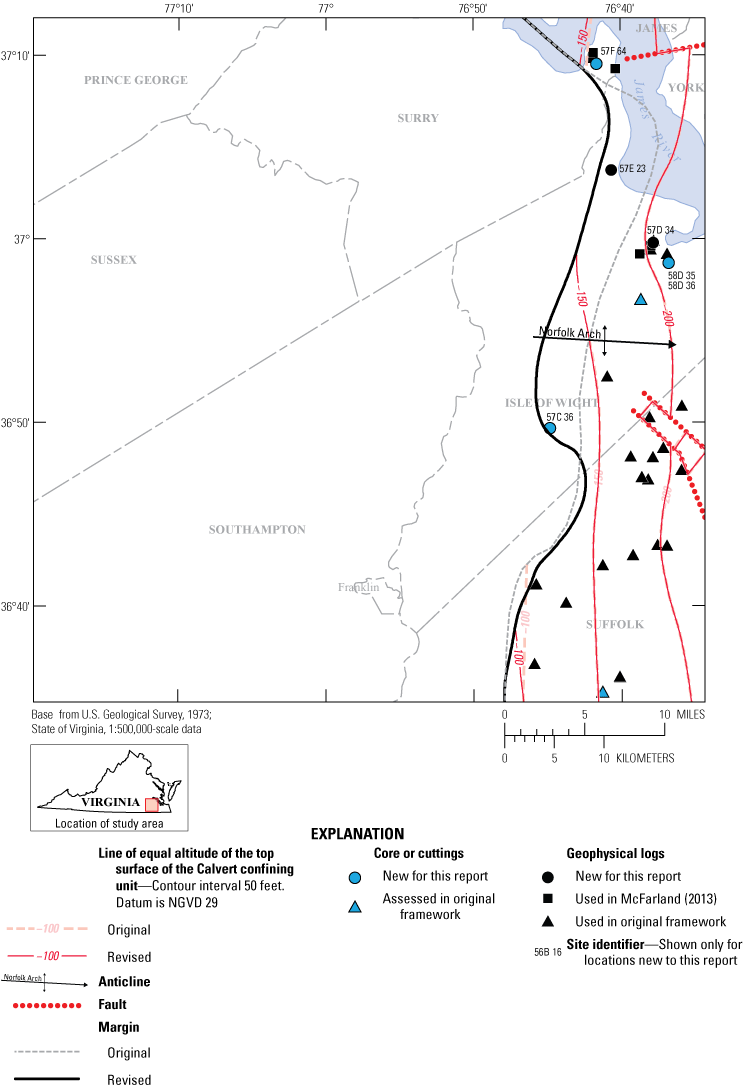
Original and revised margin and approximate top-surface altitudes (National Geodetic Vertical Datum of 1929) for the Calvert confining unit. Borehole data sites, with interpreted unit top-surface altitude differentiated by type of data collected, and if a site was used in the 2006 framework.
Saint Marys Confining Unit
The margin of the Saint Marys confining unit has been revised westward by several miles in Sussex and Prince George Counties (fig. 14). Farther south in Southampton County, the margin has been revised westward. However, the margin matches the original boundary at the southwest corner of the study area in Southampton County. The top-surface altitudes have been changed greatly owing to the finer detail provided by the new geophysical logs and samples of cuttings and cores. As a result of this new information and reexamination of geophysical logs used in the 2006 framework, the interpreted top-surface altitudes increased by more than 25 ft (deeper), whereas, in some areas of Isle of Wight and Southampton Counties and the city of Suffolk it is shallower. Additionally, the top-surface altitudes and resulting contours in the Saint Marys confining unit suggest the preservation of incised river channels and embayments throughout the study area (fig. 14). Revisions to the margins and top-surfaces of the Saint Marys confining unit, Nanjemoy-Marlboro confining unit, and Aquia aquifer mean that there is now a contact between the Saint Marys confining unit and Aquia aquifer in southwestern Southampton County. Additionally, these revisions interpret the Saint Marys confining unit to be much thicker throughout the study area than previously thought (fig. 3).
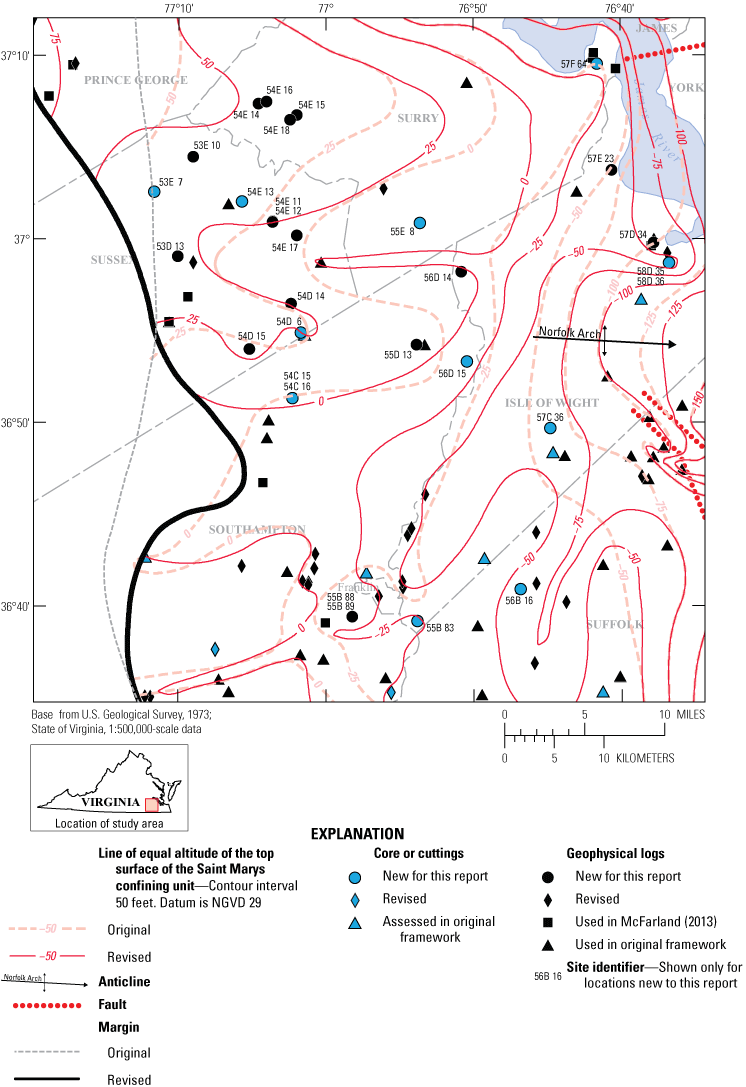
Original and revised margin and approximate top-surface altitudes (National Geodetic Vertical Datum of 1929) for the Saint Marys confining unit. Borehole data sites, with interpreted unit top-surface altitude differentiated by type of data collected, and if a site was used in the 2006 framework.
Saint Marys Aquifer
The Saint Marys aquifer is present in the study area; however, no revisions were made to its margin or top-surface altitudes. Therefore, the Saint Marys aquifer is not discussed here and no revised maps for that unit are presented.
Yorktown-Eastover Aquifer
The Yorktown-Eastover aquifer margin lies almost entirely outside of the study area, and as a result, was not revised from its original interpretation. The top-surface altitudes have changed significantly (fig. 15), as the added data for this revision has greatly increased the detail with which interpretations can be made. Revisions have changed altitudes more than 25 ft downward from the original interpretations in the city of Suffolk. Incised river channels and embayments are possibly preserved throughout the study area, as evidenced by the top-surface altitudes of the Yorktown-Eastover aquifer. These newly discovered incisions are the driver behind the downward revision of much of the Yorktown-Eastover aquifer’s top-surface altitude in Isle of Wight and Southampton Counties as well as the cities of Franklin and Suffolk. The aquifer is absent from five boreholes in the southwestern part of the city of Suffolk: local numbers 56A 11, 56B 1, 56B 13, 57B 1, and 57B 3, which may be an isolated area of sediment-texture facies change (fig. 15). Sediment in the corresponding interval where the Yorktown-Eastover aquifer is expected in this area are described in sediment logs as blue clay and blue clay with shells, which differ from the glauconitic fossiliferous quartz sand that is typical of the aquifer. This could be an area where the Rushmere Member of the Yorktown Formation, which in areas of the Virginia Coastal Plain is described as blue-gray fine sand clay with abundant shell (Ward and Blackwelder, 1980), is locally thicker than in other areas
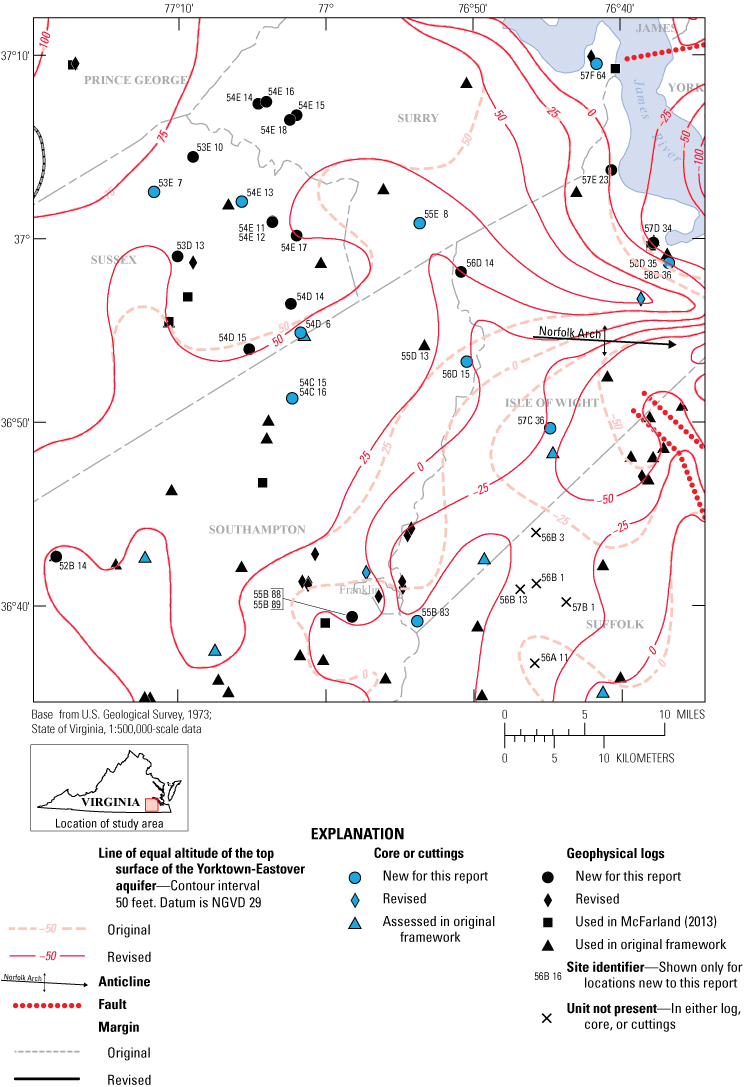
Original and revised margin and approximate top-surface altitudes (National Geodetic Vertical Datum of 1929) for the Yorktown-Eastover aquifer. Borehole data sites, with interpreted unit top-surface altitude differentiated by type of data collected, and if a site was used in the 2006 framework.
Yorktown Confining Zone
The margin of the Yorktown confining zone is almost entirely outside of the study area. As a result, the margin has not been changed with this revision. The top-surface altitudes were significantly changed as the added data for this revision has greatly increased the detail with which interpretations can be made (fig. 16). Incised river channels and embayments are possibly preserved throughout the study area indicated by the top-surface altitudes of the Yorktown confining zone. The increased resolution in top-surface altitude revealed that, in some areas, changes to the interpreted top-surface altitudes can be more than 25 ft deeper than the original interpretations in Southampton and Isle of Wight Counties as well as the city of Suffolk (fig. 16). These changes in top-surface elevation are primarily a result of the newly discovered incised river channels.
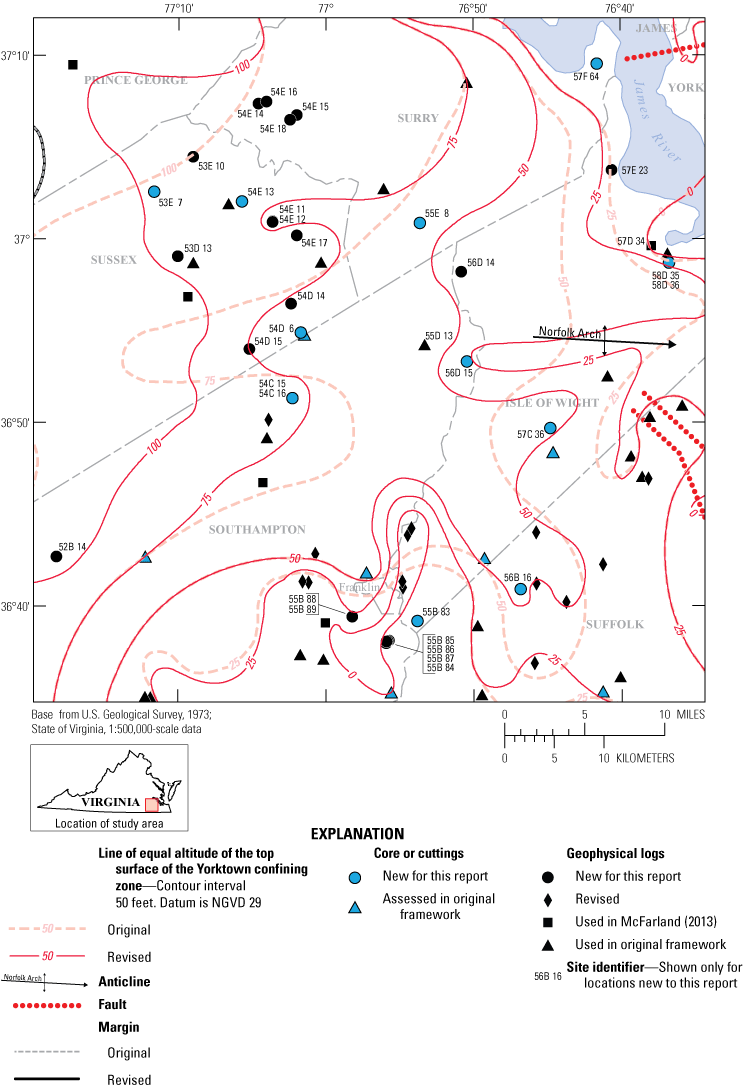
Original and revised margin and approximate top-surface altitudes (National Geodetic Vertical Datum of 1929) for the Yorktown confining zone. Borehole data sites, with interpreted unit top-surface altitude differentiated by type of data collected, and if a site was used in the 2006 framework.
Limitations
Indirect methods of subsurface hydrogeologic investigation such as geophysical borehole logs are inherently limited in their application as they are not direct observations of sediment. As mentioned previously, logs can vary in the accuracy of their perceived altitude as a result of varying datums to which the logs are referenced and (or) which are often unspecified. Additionally, it is difficult to obtain exact depths from sampled cores and cuttings. The sediment coring process is known to alter the sediment sampled. Sediment sampled in the core can be both compressed and stretched, resulting in cores that may exceed or fall short of the actual drilled depth of a borehole. This can lead to inaccuracy within a section of core, and therefore the exact depths of contacts between units are often uncertain within a core. It is similarly difficult to obtain exact altitudes that correspond to samples of cuttings owing to the inherent lag time for return of the sediments within the circulating drilling fluids. Geophysical logs are not direct observations of lithology and therefore require sediment observations from cores or cuttings from the logged well or nearby adjacent wells to verify what hydrogeologic units correspond to sections of the geophysical log. Many of the geophysical logs for boreholes do not have sediment data directly associated with them. The new data available for the revision provide a greater distribution of sediment samples across the study area. Despite the new data, sediment samples are not available for large portions of western Sussex, Prince George, and Surry Counties. Cores and cuttings from these areas would help to reduce uncertainties from correlating sections of logs to directly observed hydrogeologic units. As the distance between the site of a geophysical log and the nearest sediment sample increases, our confidence in the interpretations of the geophysical log decreases. However, given the scale at which this revision has been conducted, the error in measured depths introduced by geophysical logging, the sampling of cores and cuttings, and the uncertainty introduced with increasing distance of a geophysical log and the sediment samples it is correlated to are negligible.
Summary
This hydrogeologic framework revision was brought about by the discovery, in sediment cores and cuttings, that the Aquia aquifer is significantly deeper in the stratigraphic section in parts of the study area than previously interpreted in the original hydrogeologic framework (McFarland and Bruce, 2006). This is most evident in northern Sussex County where top-surface altitudes of the Aquia aquifer have been found to be as much as 50 ft deeper than previously interpreted. This discrepancy was mainly a result of a lack of available sediment cores or cuttings for interpretation in Sussex, Surry, and Prince George Counties in the original hydrogeologic framework. This revision demonstrates the value that direct observations from sediment samples in the form of cores or cuttings can provide to geophysical log interpretations. As borehole geophysical logs are indirect methods of investigating subsurface lithology, it is possible for signals of a lithic change to be misinterpreted, missed, or not evident in a geophysical log (fig. 4). A reexamination of the data used in the original framework and the new data collected since that framework was published produced the revisions within this report.
Most of the hydrogeologic units revised in this report are minimally changed from the interpretations presented in the 2006 framework. Notable exceptions are the Aquia aquifer, Nanjemoy-Marlboro confining unit, Saint Marys confining unit, Yorktown-Eastover aquifer, and Yorktown confining zone. Much of the change within these units is a result of increased detail on top-surface altitudes of the hydrogeologic units interpreted from the new geophysical logs, core samples, and cuttings. The increased detail in this revision has provided evidence of incised river channels and embayments in many of the previously mentioned hydrogeologic units as well as the Potomac aquifer and confining zone. These features are unconformities that result in complex undulations in the top-surface altitudes of the affected hydrogeologic units and drive much of the changes in top-surface altitudes in this report from those in the 2006 framework. One of the largest sources of change in top-surface altitudes in many of the hydrogeologic units came from the removal of two faults previously interpreted to be in the area in and surrounding the city of Franklin. The new data used in this report and new analysis of the data used in the original framework no longer supports the presence of those faults.
Additional information has revealed the presence and absence of units in areas where previously those units were interpreted to be absent or present, respectively. Most notably, new data and sediment samples from the northwestern corner of the study area have confirmed instances of the Saint Marys confining unit lying directly on top of the Aquia aquifer. The new data supported the revision of the Saint Marys confining unit margin significantly westward and the revision eastward of the Nanjemoy-Marlboro confining unit margin in Sussex and Prince George Counties.
References Cited
Caldwell, S.H., and McFarland, E.R., 2022, Shapefiles of hydrogeologic unit extents and top-surface altitude contours used in the revised hydrogeologic framework for the Virginia Coastal Plain Southwest of the James River: U.S. Geological Survey data release, https://doi.org/10.5066/P91XJ640.
Eggleston, J., and Pope, J., 2013, Land subsidence and relative sea-level rise in the southern Chesapeake Bay region: U.S. Geological Survey Circular 1392, 30 p., accessed November 6, 2020, at https://doi.org/10.3133/cir1392.
Keys, W.S., 1990, Borehole geophysics applied to ground-water investigations: U.S. Geological Survey Techniques of Water-Resources Investigations, book 2, chap. E2, 149 p., accessed April 2021 at https://pubs.er.usgs.gov/publication/twri02E2.
Ladd, D.E., 2020, Field parameters and water levels from monitoring sites at Jamestown Island, Virginia, 2016 - 2018: U.S. Geological Survey data release, accessed April 2021 at https://doi.org/10.5066/P9K7X61F.
McFarland, E.R., 2013, Sediment distribution and hydrologic conditions of the Potomac aquifer in Virginia and parts of Maryland and North Carolina: U.S. Geological Survey Scientific Investigations Report 2013–5116, 67 p., 3 attachments, 2 plates, https://pubs.usgs.gov/sir/2013/5116/.
McFarland, E.R., and Bruce, T.S., 2006, The Virginia Coastal Plain hydrogeologic framework: U.S. Geological Survey Professional Paper 1731, 118 p., 25 pls., accessed April 2021 at https://pubs.usgs.gov/pp/2006/1731/.
Meng, A.A., III, and Harsh, J.F., 1988, Hydrogeologic framework of the Virginia Coastal Plain: U.S. Geological Survey Professional Paper 1404–C, 82 p., accessed April 2021 at https://doi.org/10.3133/pp1404C.
Powars, D.S., 2000, The effects of the Chesapeake Bay impact crater on the geological framework and correlation of hydrogeologic units of southeastern Virginia, south of the James River: U.S. Geological Survey Professional Paper 1622, 53 p., 1 pl. accessed April 2021 at https://doi.org/10.3133/pp1622.
Powars, D.S., and Bruce, T.S., 1999, The effects of the Chesapeake Bay impact crater on the geological framework and correlation of hydrogeologic units of the lower York-James Peninsula, Virginia: U.S. Geological Survey Professional Paper 1612, 82 p., 9 pls. accessed April 2021 at https://doi.org/10.3133/pp1612.
U.S. Geological Survey, 2020, USGS GeoLog locator: U.S. Geological Survey database, accessed September 30, 2020, at https://doi.org/10.5066/F7X63KT0.
Virginia Department of Environmental Quality, 2020, Status of Virginia’s water resources—A report on Virginia’s water resources management activities: Virginia Department of Environmental Quality report, 56 p., accessed November 13, 2020, at https://www.deq.virginia.gov/home/showpublisheddocument?id=2119.
Ward, L.W., and Blackwelder, B.W., 1980, Stratigraphic revision of upper Miocene and lower Pliocene beds of the Chesapeake Group, middle Atlantic Coastal Plain: U.S. Geological Survey Bulletin 1482-D, 80 p., accessed July 2021 at https://doi.org/10.3133/b1482D.
Werner, A.D., Bakker, M., Post, V.E.A., Vandenbohede, A., Lu, C., Ataie-Ashtiani, B., Simmons, C.T., and Barry, D.A., 2013, Seawater intrusion processes, investigation and management—Recent advances and future challenges: Advances in Water Resources, v. 51, p. 3–26, accessed July 2021 at https://doi.org/10.1016/j.advwatres.2012.03.004.
Conversion Factors
U.S. customary units to International System of Units
| Multiply | By | To obtain |
|---|---|---|
| foot (ft) | 0.3048 | meter (m) |
| mile (mi) | 1.609 | kilometer (km) |
| square mile (mi2) | 259.0 | hectare (ha) |
| square mile (mi2) | 2.590 | square kilometer (km2) |
| million gallons (Mgal) | 3,785 | cubic meter (m3) |
| million gallons per day (Mgal/d) | 0.04381 | cubic meter per second (m3/s) |
| million gallons per day per square mile ([Mgal/d]/mi2) | 1,461 | cubic meter per day per square kilometer ([m3/d]/km2) |
International System of Units to U.S. customary units
| Multiply | By | To obtain |
|---|---|---|
| meter (m) | 3.281 | foot (ft) |
| kilometer (km) | 0.6214 | mile (mi) |
| hectare (ha) | 0.003861 | square mile (mi2) |
| square kilometer (km2) | 0.3861 | square mile (mi2) |
| cubic meter (m3) | 0.0002642 | million gallons (Mgal) |
| cubic meter per second (m3/s) | 22.83 | million gallons per day (Mgal/d) |
| cubic meter per day per square kilometer ([m3/d]/km2) | 0.0006844 | million gallons per day per square mile ([Mgal/d]/mi2) |
Datum
Vertical coordinate information is referenced to the National Geodetic Vertical Datum of 1929 (NGVD 29).
Horizontal coordinate information is referenced to the North American Datum of 1927 (NAD 27).
Altitude, as used in this report, refers to distance above the vertical datum.
Supplemental Information
Specific conductance is given in microsiemens per centimeter at 25 degrees Celsius (μS/cm at 25 °C).
Disclaimers
Any use of trade, firm, or product names is for descriptive purposes only and does not imply endorsement by the U.S. Government.
Although this information product, for the most part, is in the public domain, it also may contain copyrighted materials as noted in the text. Permission to reproduce copyrighted items must be secured from the copyright owner.
Suggested Citation
Caldwell, S.H., and McFarland, E.R., 2022, Revisions to the Virginia Coastal Plain hydrogeologic framework southwest of the James River: U.S. Geological Survey Scientific Investigations Report 2022–5049, 24 p., https://doi.org/10.3133/sir20225049.
ISSN: 2328-0328 (online)
ISSN: 2328-031X (print)
Study Area
| Publication type | Report |
|---|---|
| Publication Subtype | USGS Numbered Series |
| Title | Revisions to the Virginia Coastal Plain hydrogeologic framework southwest of the James River |
| Series title | Scientific Investigations Report |
| Series number | 2022-5049 |
| DOI | 10.3133/sir20225049 |
| Publication Date | June 23, 2022 |
| Year Published | 2022 |
| Language | English |
| Publisher | U.S. Geological Survey |
| Publisher location | Reston, VA |
| Contributing office(s) | Virginia and West Virginia Water Science Center |
| Description | Report: vii, 24 p.; Data Release |
| Country | United States |
| State | Virginia |
| Online Only (Y/N) | N |
| Additional Online Files (Y/N) | N |