

Mapping the Altitude of the Top of the Dockum Group and Paleochannel Analysis Using Surface Geophysical Methods On and Near Cannon Air Force Base in Curry County, New Mexico, 2020
Links
- Document: Report (1.44 MB pdf) , HTML , XML
- Dataset: New Mexico Office of the State Engineer online database —New Mexico Water Rights Reporting System
- Data Releases:
- USGS data release —Surface geophysical data used for mapping the top of the Dockum Group on Cannon Air Force Base in Curry County, New Mexico, 2020
- USGS data release —1 meter digital elevation models (DEMs)—USGS National Map 3DEP downloadable data collection
- Download citation as: RIS | Dublin Core
Abstract
The hydrogeology on and near Cannon Air Force Base (AFB) in eastern New Mexico was assessed to gain a better understanding of preferential groundwater flow paths through paleochannels. In and near the study area, paleochannels incised the top surface of the Dockum Group (Chinle Formation) and were subsequently filled in with electrically resistive coarse-grained sediments of the overlying Ogallala Formation, resulting in a preferential groundwater flow path in the form of a paleochannel network. A better understanding of the spatial characteristics of this preferential groundwater flow path is needed to support ongoing efforts to remediate groundwater contamination at Cannon AFB. Therefore, the U.S. Geological Survey, in cooperation with the U.S. Air Force Civil Engineer Center, used surface geophysical resistivity methods and data compiled from previous studies to better understand the spatial distribution and characteristics of the paleochannel network incised into the top of the Dockum Group.
Previous studies have shown these paleochannels incised into the top of the Dockum Group with increasing resolution, but limited borehole data on and near Cannon AFB continued to make accurately mapping the top of Dockum Group challenging. For this study, surface geophysical resistivity measurements in the form of time-domain electromagnetic soundings made by the U.S. Geological Survey were used in conjunction with data previously published by Architecture, Engineering, Construction, Operations, and Management and borehole data compiled from the New Mexico Water Rights Reporting System database to prepare an updated map of the top of the Dockum Group that includes the location and characteristics of paleochannels incised into the top of the Dockum Group (Chinle Formation). A total of 149 borehole picks (determinations of the tops and bases of geologic units and their hydrogeologic-unit equivalents) were obtained from previous studies, along with 72 additional borehole picks from the New Mexico Water Rights Reporting System database and 43 picks from newly collected time-domain electromagnetic soundings. The data were gridded and contoured using Oasis Montaj v. 9.8.1.
The updated map of the top of Dockum Group has many areas of uncertainty greater than 20 feet, because there are not enough data for the gridding process to reliably determine a value. However, this interpretation of the altitude of the top of the Dockum Group represents a substantial improvement in data resolution compared to previous studies.
Two methodologies were used to evaluate paleochannels incised in the top of the Dockum Group across the study area: (1) trend-removal grid analysis and (2) analysis with Esri’s ArcMap Hydrology toolset. These two paleochannel analysis techniques show groundwater flow direction as well as areas having the deepest saturated thickness. Hydrologically, these techniques show where aquifer storage is highest (in the deepest parts of the paleochannel network), as well as the spatial distribution of preferential groundwater flow paths (the paleochannels). The analyses indicate a large paleochannel trending to the southeast, with smaller channels feeding in from the west. Areas where groundwater management could be more beneficial are indicated by locations where these flow lines intersect the deeper parts of the paleochannel.
Introduction
The hydrogeology on and near Cannon Air Force Base (AFB) in Curry County, New Mexico, was assessed to better understand preferential groundwater flow paths in the form of paleochannels. During the Triassic, streams cut channels into the geologic unit that formed the land surface at that time; remnants of these ancient streams remain in the form of paleochannels. On and near the study area, paleochannels incised the top surface of the Triassic-age Chinle Formation of Dockum Group and were subsequently filled with electrically resistive coarse-grained sediments from the overlying Tertiary-age Ogallala Formation (Rawlings, 2016), resulting in a preferential groundwater flow path in the form of a paleochannel network. A better understanding of the spatial characteristics of this preferential groundwater flow path is needed to support ongoing efforts to remediate groundwater contamination at Cannon AFB. Chandra and others (2020, p. 1) explain “paleochannels typically act as pathways for groundwater movement and provide a potential source of groundwater. Their presence can be helpful in identifying areas suitable for recharge and at times in mitigating contamination problems in afflicted regions. Thus, mapping of paleochannels is significant in the planning and management of groundwater resources.” Therefore, the U.S. Geological Survey (USGS), in cooperation with the U.S. Air Force Civil Engineer Center, used surface geophysical resistivity methods and data compiled from previous studies to better understand the spatial distribution and characteristics of the paleochannel network incised into the top of the Dockum Group.
Purpose and Scope
The primary purpose of this report is to update previously published depictions of the paleochannel network that traverses the top of Chinle Formation of the Dockum Group on and near Cannon AFB in Curry County, N. Mex. and functions as a preferential groundwater flow path. The altitude of the top of the Dockum Group was mapped, and spatial characteristics of the paleochannel network were described by using compiled and newly collected geophysical data.
Description of Study Area
The study area consists of about 35,000 acres on and near Cannon AFB in eastern New Mexico. Cannon AFB is approximately 7 miles southwest of Clovis, N. Mex., in the Southern High Plains physiographic province (Fenneman and Johnson, 1946; Langman and others, 2004). Cannon AFB is surrounded mostly by agricultural lands and dairy farms. The mean annual precipitation in Clovis during 1981–2020 was about 18 inches, and daily mean temperatures ranged from 78 degrees Fahrenheit in July to 39 degrees Fahrenheit in January (U.S. Climate Data, 2021). Mean annual evaporation rates in this semiarid region far exceed mean annual precipitation (Tuan and others, 1969; Robson and Banta, 1995). Cannon AFB covers approximately 3,800 acres and is host to the 27th Special Operations Group of the United States Air Force (Cannon Air Force Base, 2022) (fig. 1). Because of groundwater contamination related to historical operations at the site, an environmental restoration program is ongoing (Langman and others, 2004, 2006). Environmental restoration processes at Cannon AFB are being overseen by the Department of Defense (U.S. Government Accountability Office, 2021).
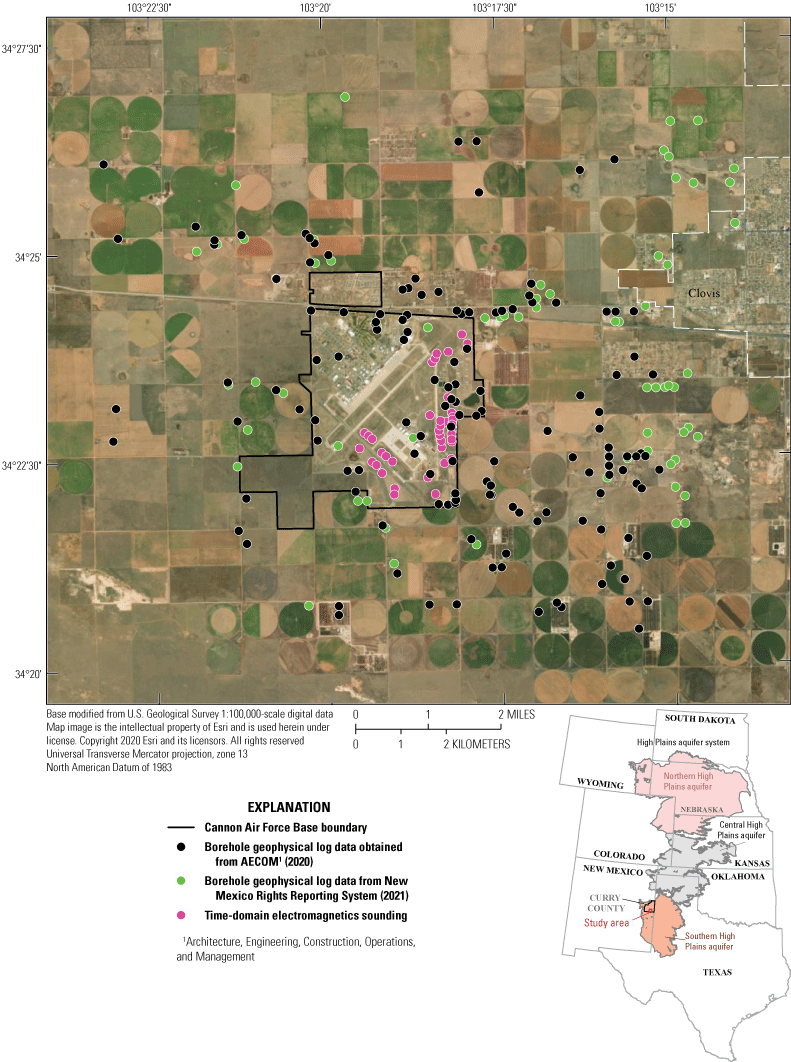
Locations of all boreholes and time-domain electromagnetic (TDEM) soundings on and near Cannon Air Force Base in Curry County, New Mexico, 2020.
Geologic and Hydrogeologic Setting
The High Plains aquifer system is the largest aquifer in the United States and is commonly divided into three parts: the Northern High Plains aquifer, Central High Plains aquifer, and Southern High Plains aquifer (fig. 1) (Becker and others, 2002). The Southern High Plains aquifer underlies the study area. The High Plains aquifer system is commonly referred to as the “Ogallala aquifer” because the Ogallala Formation is the predominant water-bearing unit of this aquifer system (Gutentag and others, 1984).
Because the focus is on the hydrology of the area, geologic units are discussed from land surface downward (youngest to oldest), and aquifers and the geologic units that contain them are discussed together. The Quaternary-age Blackwater Draw Formation consists mostly of eolian sand deposits and overlies the Tertiary-age Ogallala Formation in the area; the Blackwater Draw Formation ranges in thickness from about 0 to 80 ft in eastern New Mexico (fig. 2; McLemore, 2001). The Blackwater Draw Formation is not considered a viable source of water in the study area. The Ogallala Formation consists of eolian sand and silt and fluvial and lacustrine sand, silt, clay, and gravel (McLemore, 2001), and ranges in thickness from about 30 to 600 ft in eastern New Mexico and western Texas (Gustavson, 1996). The Southern High Plains aquifer is the primary source of water for agriculture and public supply in the area and is primarily contained in the Ogallala Formation in eastern New Mexico (McLemore, 2001). The Ogallala Formation lies unconformably atop the upper unit of the eastward-dipping Triassic-age Chinle Formation of the Dockum Group (Dutton and Simpkins, 1986; Lucas and others, 1987). The Southern High Plains aquifer is underlain in most of the area by relatively impermeable rocks equivalent to the Chinle Formation (Cronin, 1969; Gutentag and others, 1984). The rocks that compose the Chinle Formation consist mostly of clay with some intermixed shale and silt that serve as barriers to groundwater movement (Cronin, 1969). The Chinle Formation ranges in thickness from about 0 to 400 feet (ft) in eastern New Mexico (McGowen and others, 1977). Locally, the Chinle Formation is referred to as the “red beds,” an informal name commonly used for sedimentary rocks rich in ferric oxides (Neuendorf and others, 2005). The Triassic-age Santa Rosa Formation underlies the Chinle Formation. The Chinle Formation and the Santa Rosa Formation are the only members of the Dockum Group present in the study area. In addition to the Ogallala Formation, the Santa Rosa Formation is the other water-bearing member of the High Plains aquifer system present in the study area; the sandstone and shale aquifer is contained in the Santa Rosa Formation of the Dockum Group (Gustavson and Holliday, 1985) and is as a minor source of water, mostly for agricultural uses (New Mexico Interstate Stream Commission and New Mexico Office of the State Engineer, 2016). Although in New Mexico the water-bearing unit of the Dockum Group in the study area (the Santa Rosa Formation) is known as the sandstone and shale aquifer, the water-bearing unit of the Dockum Group is known as the Dockum aquifer in Texas (Matherne and Stewart, 2012; New Mexico Interstate Stream Commission and New Mexico Office of the State Engineer, 2016).
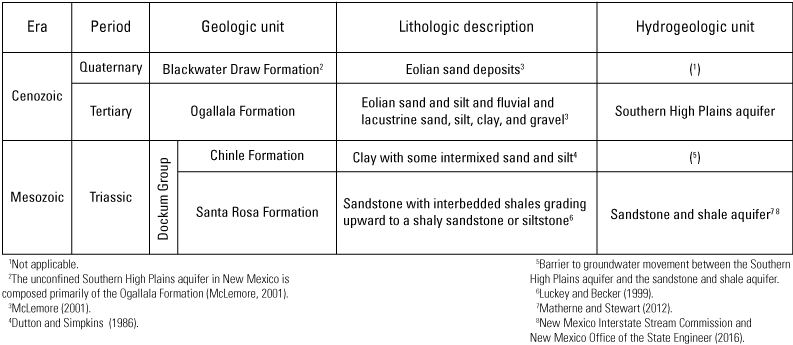
Geology of the near-surface (top) geologic units and their hydrogeologic‐unit equivalents on and near Cannon Air Force Base, Curry County, New Mexico (modified from Matherne and Stewart, 2012).
The hydrogeologic setting on and near Cannon AFB is the complex result of the Laramide orogeny between 80 and 55 million years ago that formed the Rocky Mountains and possibly earlier orogenies as well that predate the Laramide orogeny (Gustavson and Holliday, 1985). Prior to the Laramide orogeny, eastern New Mexico and the Texas Panhandle were covered by a large sea that was part of the Western Interior Seaway, which deposited the Dockum Group sediments during the Triassic period (Gustavson and Holliday, 1985). The Dockum Group is composed of sandstone with interbedded shales grading upward to a shaly sandstone or siltstone and clay (Luckey and Becker, 1999). When the Laramide orogeny began and the Western Interior Seaway regressed, the area on and near the present-day Cannon AFB was traversed by large rivers that had their headwaters in the Rocky Mountains and predominately flowed in an east-southeast direction. These rivers downcut into the Chinle Formation that forms the upper part of the Dockum Group until the late Miocene epoch (Gustavson and Holliday, 1985) when the incised channels began to fill with fluvial sediments such as sand and gravel originating from the Rocky Mountain headwaters; subsequent to channel incision and streambed sediment deposition, sand and gravel deposits from complex ancestral alluvial fan systems were deposited and then reworked to form the overlying Ogallala Formation (Knowles and others, 1984).
Previous Studies
The USGS has conducted several assessments in recent years to characterize the hydrogeology on and near Cannon AFB. Data and information from previous studies were used to guide the assessment described herein. Previous USGS studies include Collison (2016), Langman and others (2006), and Langman and others (2004). A previous study by Architecture, Engineering, Construction, Operations, and Management (AECOM, 2020) assessed the location of the paleochannels on and near Cannon AFB by using available borehole data from the New Mexico Water Rights Reporting System (NMWRRS) database and the Cannon AFB Installation Restoration Program. In 2018, the USGS collected geophysical logs from 21 existing boreholes and from 4 new boreholes at the Cannon AFB as well as 4 new test wells (available through the USGS GeoLog Locator system at https://doi.org/10.5066/F7X63KT0). Those data were incorporated in this report and were also used in AECOM (2020), which describes the spatial distribution paleochannels at Cannon AFB by using available borehole data. AECOM (2020) discusses limitations of their final map resulting from gaps in the borehole data that they used in their analysis. The data used to develop their interpretation of the spatial distribution of paleochannels in the top of the Dockum Group are among the data incorporated in the development of the updated interpretation of the spatial distribution of paleochannels in top of Dockum Group described in this report.
Data Collection, Compilation, and Processing Methods
Resistivity measurements are commonly used to interpolate geologic and hydrogeologic properties between borehole locations or in areas where no borehole data exist. Data from surface geophysical resistivity methods were used to fill data gaps pertaining to the spatial distribution of paleochannels at Cannon AFB. Surface geophysical resistivity measurements in the form of time-domain electromagnetic (TDEM) soundings made by the USGS were published as a companion data release to this report (Payne and Teeple, 2020). These TDEM soundings were used in conjunction with data published in AECOM (2020) and borehole data compiled from NMWRRS (2021) to prepare an updated map of the top of the Dockum Group that includes the location and characteristics of paleochannels incised into the top of the Dockum Group (Chinle Formation).
TDEM Soundings
TDEM instruments measure the bulk resistivity of the subsurface by producing an alternating electrical current in a transmitter loop of wire deployed on the land surface (Vignesh and others, 2015). TDEM soundings in this study were collected using the Geonics Protem 47 and 57 systems, respectively (Geonics Limited, 2006). Both systems use a multiturn receiver coil to measure electromagnetic (EM) fields in the center of the transmitter loop. The TDEM soundings were collected at two frequencies using the Geonics Protem 47 (285 and 75 hertz [Hz]) and three frequencies using the Geonics Protem 57 (30, 7.5, and 3.0 Hz) for a total of five frequencies. The lower frequencies penetrate deeper into the subsurface. For each frequency, 10 stacks (independent measurements) were collected by using an integration time of either 8 or 15 seconds, the latter of which was used for collecting 3.0-Hz data with the Geonics Protem 57. Longer integration time helps improve signal to noise ratio, thereby compensating for the dissipation of the transmitted signal at depth and for the greater potential for EM background noise with these soundings compared to soundings collected at higher frequencies (shallower depths). Additional information about the TDEM method and data collected in this study are available in Payne and Teeple (2020). The TDEM data were collected in accordance with methods defined by the American Society of Testing and Materials (1999). Comprehensive descriptions of the theory and application of geophysical resistivity methods, as well as tables of the electrical properties of earth materials, are presented in Keller and Frischknecht (1966) and Lucius and others (2007) and will not be detailed in this report.
Sixty TDEM soundings, 43 of which were used in the final interpretation, were collected at Cannon AFB (fig. 1) to supplement existing borehole data. TDEM transmitter loops covering 100 square meters were used to ensure that the depth of exploration would accurately image the electrically conductive Chinle Formation. For each TDEM sounding, the voltages measured from the eddy currents were averaged and evaluated statistically by using preprocessing scripts that incorporate raw field data (namely, voltage data) and independently compute the uncertainty of each time gate. A time gate is defined as one of multiple time windows (after current shutoff) during which discrete voltages are measured. Variability observed in a time gate can represent signal noise or a systematic change not representative of stable data (Mandache and Brothers, 2005).
In this application, 10 percent of the data from each tail of the distribution were removed, and an average of the remaining 80 percent was computed. The resulting averages were then compared to a noise sample collected at the sounding location, and any values that were less than half of the associated EM background noise value were removed from the final sounding. The final averaged values for each time gate were saved as processed data files and used for inverse modeling whereby the spatial distribution of subsurface resistivity was estimated from the measured voltage. The IX1D v3 program, developed by Interpex Limited (1996), was used for inverse modeling of the TDEM soundings. A smooth inverse model—defined as a multilayered model that holds the depth values fixed and allows the resistivity values to vary during inversion—was fit to the data by using Occam’s inversion principle (Constable and others, 1987). Layered-earth models, which are simplified models used to represent hydrogeologic units, were then generated and fit to the data to better represent the electrical stratigraphy of each sounding. The changes in resistivity from the inverse modeling results of the final processed TDEM data were used to determine changes in hydrogeologic contacts, namely the tops and bases of hydrogeologic units. More detailed descriptions of the field procedures, equipment setup, and processing steps used to develop one-dimensional soundings (commonly referred to as “virtual borehole resistivity logs”) from the TDEM soundings are available in the data release that accompanies this report (Payne and Teeple, 2020).
Each of the 60 soundings was evaluated for accuracy by first looking at the background EM noise in the location of the sounding. This evaluation led to the removal of eight soundings from the dataset because the noise level overwhelmed any measurable signal. The remaining soundings were then carefully analyzed and compared to nearby borehole data. This additional scrutiny and comparison to nearby borehole data led to the removal of nine additional soundings from the dataset. For all removed soundings, the depth to top of the Dockum Group differed from the depth in nearby boreholes by more than 10 ft; this large difference in depth helped to confirm the decision to remove these soundings from the dataset was the correct decision. All TDEM sounding locations are listed in table 1; the TDEM soundings that were used in the analysis include depth and altitude values for the top of the Dockum Group.
Table 1.
Location, depth to top of Dockum Group, and altitude of the top of Dockum Group for the time-domain electromagnetic (TDEM) soundings used in the final interpretation (Payne and Teeple, 2020).[ID, identifier; WGS 84, World Geodetic System 1984; --, data not available because sounding was not used in final interpretation]
Data Compilation
Table 2 lists the altitude of the top of the Dockum Group as interpreted from all boreholes in the study area. (All of the data in table 2 are from AECOM, 2020.) AECOM (2020) computed the top of Dockum Group altitude (shown in table 2) by subtracting the depth to the top of the Chinle Formation from a 1-meter (m) digital elevation model (U.S. Geological Survey, 2017). Because of the possible discrepancies between surface altitudes used by AECOM and those used in this report, actual altitudes of the top of the Dockum Group may differ slightly.
Table 2.
Location, depth to top of Dockum Group, and altitude of the top of Dockum Group from Architecture, Engineering, Construction, Operations, and Management (AECOM, 2020).[ID, identifier; WGS 84, World Geodetic System 1984]
To supplement the AECOM (2020) dataset, a search of the NMWRRS database revealed an additional 72 wells near Cannon AFB that included drillers’ descriptions of the depth at which the top of the Dockum Group was reached (NMWRRS, 2021). As with the AECOM data, these depths were subtracted from the regional 1-m digital elevation model to produce additional control points in the final depiction of the top of Dockum Group. The borehole data obtained from the NMWRRS database that were used in the final interpretation in this report are provided in table 3.
Table 3.
Location, depth to top of Dockum Group, and altitude of the top of Dockum Group obtained from the New Mexico Water Rights Reporting System (NMWRRS, 2021).[ID, identifier; WGS 84, World Geodetic System 1984]
Hydrogeologic Unit Interpretation
In order to determine the top of Dockum Group (Chinle Formation) (fig. 3), the tops and bases of geologic units (and their hydrogeologic-unit equivalents), hereinafter referred to as “borehole picks,” were first determined by analyzing previously published and newly collected lithologic descriptions and borehole geophysical logs. A total of 149 borehole picks were obtained from AECOM (2020), along with 72 borehole picks from NMWRRS (2021) and 43 borehole picks from newly collected TDEM soundings. The data were gridded using Oasis Montaj v. 9.8.1 (Seequent, 2020a) where a kriging method using an exponential variogram model trended to the southeast. Kriging is a geostatistical method that determines the most probable value at each grid node in a 50- by 50-m grid (about 164 ft between nodes in the x and y directions) for this study based on a statistical analysis of the entire dataset (Isaaks and Srivastava, 1989). Variance maps developed during the kriging process were used to evaluate the uncertainty in hydrogeologic unit surface grids in the planning of additional data-collection tasks. Generally, as the distance between data points became greater, the correlation between the data points decreased, and uncertainty in areas between the data points increased (Isaaks and Srivastava, 1989). Additional information on kriging is available in Isaaks and Srivastava (1989). The contour lines shown in figure 3 were created by using the quick contour method in Oasis Montaj v. 9.8.1 (Seequent, 2020a), are based on available data, and were not adjusted manually. Figure 3 depicts the updated general northwest-to-southeast orientation of the top surface of the Dockum Group (Chinle Formation) that underlies Cannon AFB. The blue-shaded areas in figure 3 correspond to the general location of the paleochannel network, and the result obtained is consistent with the results from previous studies (AECOM, 2020).
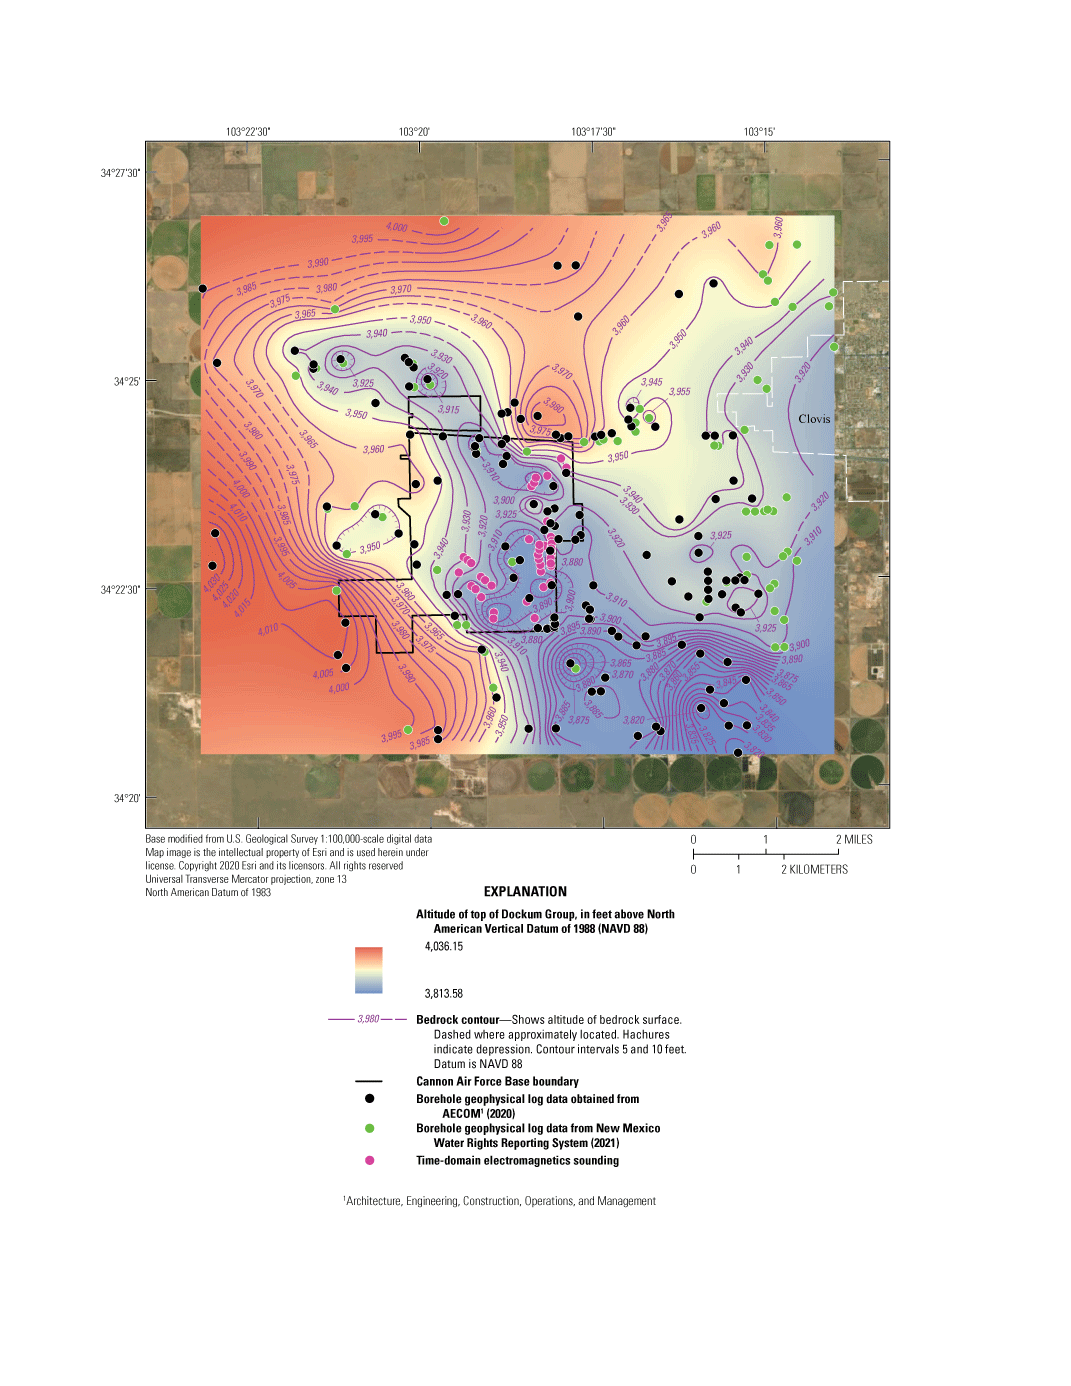
Locations of all boreholes and time-domain electromagnetic (TDEM) soundings with interpreted top of Dockum Group grid and bedrock contours depicting the top surface of the Dockum Group (Chinle Formation) on and near Cannon Air Force Base, Curry County, New Mexico, 2020.
Previous base-of-aquifer maps generated for the area have shown areas with water levels below the proposed base of the aquifer; therefore, the area should have been dry. This modified grid compares much better to water level data in the area and has no areas that do not correlate with the other datasets. The minimum saturated thickness in a well that has water level data is approximately 10 ft.
A map of the grid error (variance) derived from the kriging method was developed to depict where possible data gaps may still exist (fig. 4). The updated map of the top of Dockum Group has many areas of uncertainty greater than 20 ft (fig. 4) because there are not enough data for the gridding process to reliably determine a value. However, this interpretation of the altitude of the top of the Dockum Group represents a substantial improvement in data resolution compared to previous studies. The resolution over the entire study area improved because of the additional borehole data, and the resolution along the large paleochannel trending northwest-to-southeast across Cannon AFB is greatly improved by the addition of new, tightly spaced TDEM soundings. Many data gaps are still indicated (fig. 4), and additional data collection is needed to further improve the accuracy with which the top of the Dockum Group is depicted in areas where data remain sparse. Areas within Cannon AFB that would benefit most from additional data collection are in locations where infrastructure hindered the collection of additional TDEM soundings. The depiction of the top of the Dockum Group in areas east and south of the Cannon AFB may benefit from additional TDEM soundings, including areas where difficulty accessing private land hindered data collection.
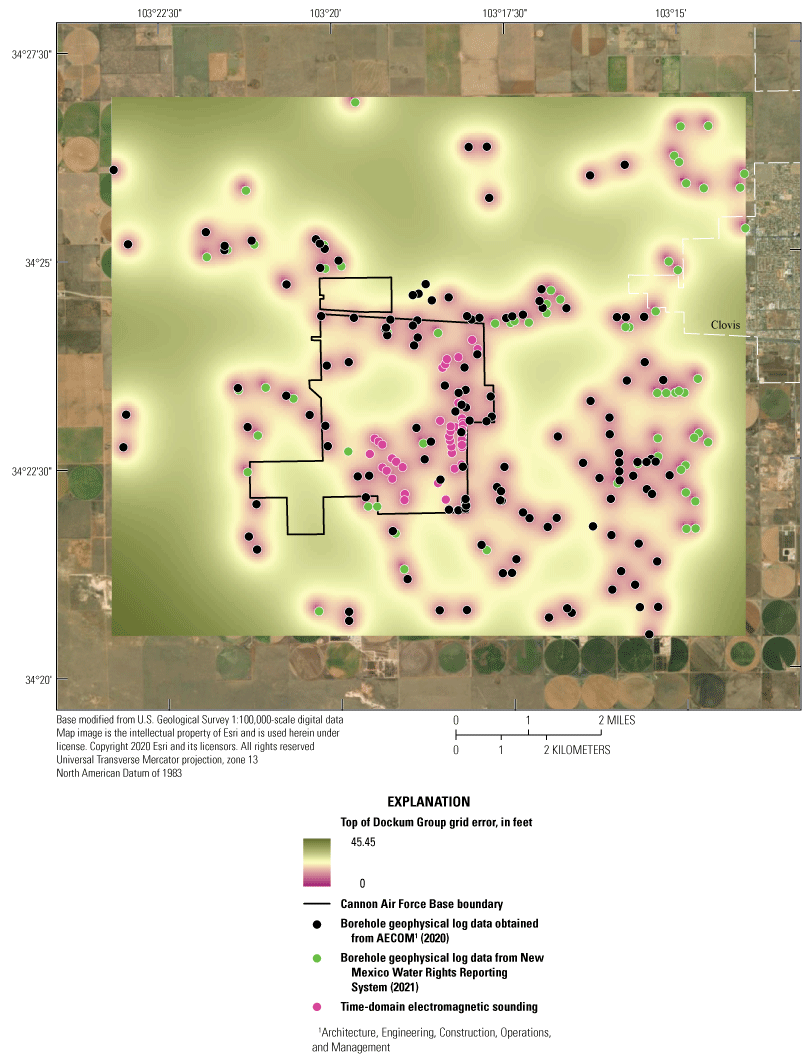
Gridding error of top of Dockum Group (map shown in fig. 3) on and near Cannon Air Force Base in Curry County, New Mexico, 2020.
Paleochannel Analysis
Two methodologies were used to evaluate paleochannels in the top of the Dockum Group across the study area: (1) trend-removal grid analysis and (2) analysis with Esri’s ArcMap Hydrology toolset. Trend-removal grids were developed by removing the third-order regional trend from all the data points within the top of Dockum Group (Chinle Formation) surface grids (Seequent, 2020b). Essentially, this technique removes the regional dip of the layer prior to the process of creating surface grids. The resulting trend-removal grid (fig. 5) shows changes in the top of the Dockum Group after the regional trend was removed. Relatively low altitude values represent low-altitude data points in the top of Dockum Group (Chinle Formation) surface grid, and continuous stretches of these low-altitude values can be indicative of paleochannels. Figure 5 shows the same general northwest-to-southeast trend of paleochannel network across Cannon AFB, but with the regional trend removed, it highlights relatively deeper portions of the paleochannels. The areas in figure 5 with darker blues indicate the portions of paleochannels that are substantially deeper (more than 20 ft) relative to the main paleochannel. These deeper areas of the paleochannel indicate portions with greater saturated thickness.
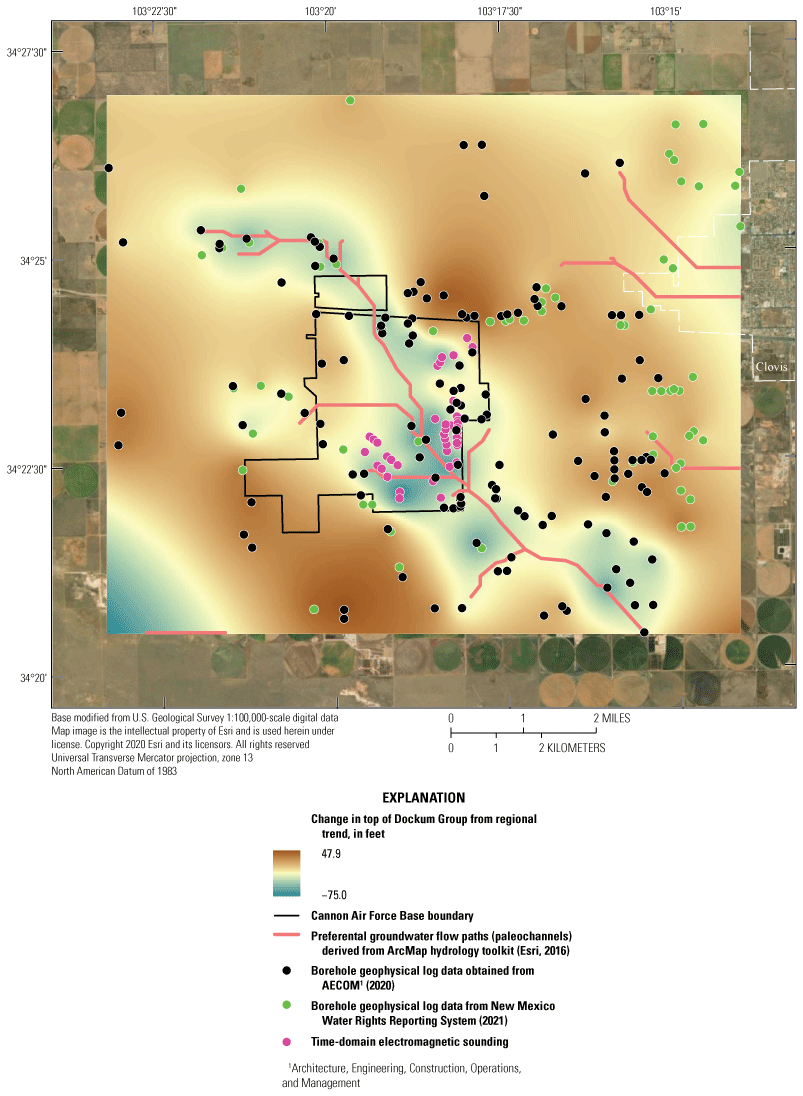
Change in the top of Dockum Group after regional trend was removed and flow lines derived from ArcMap Hydrology toolkit on and near Cannon Air Force Base in Curry County, New Mexico, 2020.
The second paleochannel analysis, performed using Esri’s ArcMap Hydrology toolset, treated the surface grid representing the top of the Dockum Group as a digital surface elevation model and simulated a topographic watershed across the surface to identify the location and spatial characteristics of the paleochannel network. The toolset was used to determine the flow direction, flow accumulation, and stream order (Esri, 2021). Ultimately, the toolset simulates the movement of water across a land surface, which for this study corresponds to the top of the Dockum Group surface grid (fig. 3).
Concentric “bullseye” shapes were present in the top of Dockum Group surface contours that were not smoothed manually. For the toolset to function properly, these “bullseyes” (which act as sinks) had to be filled to render the raster hydrologically correct. Next, a flow-direction grid was created to find directional flow between cells and then used as input to the flow-accumulation tool, where a threshold lower than the default value was chosen to identify paleochannel flow paths (Esri, 2021). This flow-accumulation grid was then converted to vector format, where artifacts of the process were removed manually. The final product is a map depicting flow paths (fig. 5) based on the interpolated and smoothed top of Dockum Group altitudes. Data from previous USGS studies were used to check the results from the two methodologies used to evaluate paleochannels in the top of the Dockum Group across the study area.
These two paleochannel analysis techniques show groundwater flow direction as well as areas with the deepest saturated thickness. Hydrologically, these techniques show where aquifer storage is highest (in the deepest parts of the paleochannel network), as well as the spatial distribution of preferential groundwater flow paths (the paleochannels [fig. 5]). The analyses indicate a large paleochannel trending to the southeast with smaller channels feeding in from the west. Areas where groundwater management could be more beneficial are indicated by locations where these flow lines intersect the deeper parts of the paleochannel.
Summary
The hydrogeology on and near Cannon Air Force Base (AFB) was assessed to gain a better understanding of preferential groundwater flow paths through paleochannels. The Southern High Plains aquifer is contained in the Tertiary-age Ogallala Formation in the part of eastern New Mexico where Cannon AFB is located. The Triassic-age Chinle Formation of the Dockum Group underlies the unconfined Southern High Plains aquifer. The Southern High Plains aquifer is the primary source of water for agriculture and public supply in the area, with the sandstone and shale aquifer serving as a minor source of water mostly for agricultural uses. In and near the study area, paleochannels incised the top surface of the Dockum Group (Chinle Formation) and subsequently filled in with electrically resistive coarse-grained sediments of the overlying Ogallala Formation, resulting in a preferential groundwater flow path in the form of a paleochannel network. A better understanding of the spatial characteristics of this preferential groundwater flow path is needed to support ongoing efforts to remediate groundwater contamination at Cannon AFB. Therefore, the U.S. Geological Survey, in cooperation with the U.S. Air Force Civil Engineer Center, used surface geophysical resistivity methods and data compiled from previous studies to better understand the spatial distribution and characteristics of the paleochannel network incised into the top of the Dockum Group.
Previous studies have shown with increasing resolution how paleochannels incised the top of the Dockum Group, but limited borehole data on and near Cannon AFB continued to make accurately mapping the top of Dockum Group challenging. For this study, surface geophysical resistivity measurements in the form of time-domain electromagnetic (TDEM) soundings made by the U.S. Geological Survey were used in conjunction with data previously published by Architecture, Engineering, Construction, Operations, and Management and borehole data compiled from the New Mexico Water Rights Reporting System database to prepare an updated map of the top of the Dockum Group that includes the location and characteristics of paleochannels incised into the top of the Dockum Group (Chinle Formation). A total of 149 borehole picks were obtained from previous studies, along with 72 additional borehole picks from the New Mexico Water Rights Reporting System database and 43 borehole picks from newly collected TDEM soundings. The data were gridded and contoured using Oasis Montaj v. 9.8.1 where a kriging method using an exponential variogram model trended to the southeast was used. A map of the grid error (variance) derived from the kriging method was developed to depict where possible data gaps may still exist. The updated map of the top of Dockum Group has many areas of uncertainty greater than 20 feet because there are not enough data for the gridding process to reliably determine a value. However, this interpretation of the altitude of the top of the Dockum Group represents a substantial improvement in data resolution compared to previous studies. The resolution over the entire study area improved with the additional borehole data, and the resolution along the large paleochannel trending northwest-to-southeast across Cannon AFB is greatly improved by the addition of new, tightly spaced TDEM soundings. Many data gaps remain, and additional data collection is needed to further improve the accuracy with which the top of the Dockum Group is depicted in areas where data remain sparse.
Two methodologies were used to evaluate paleochannels in the top of the Dockum Group across the study area: (1) trend-removal grid analysis and (2) analysis with Esri’s ArcMap Hydrology toolset. Trend-removal grids were developed by removing the third-order regional trend from all the point values within the top of Dockum Group (Chinle Formation) surface grids. The resulting trend-removal grid shows changes in the top of the Dockum Group after the regional trend was removed. Relatively low values represent low-altitude points in the top of Dockum Group (Chinle Formation) surface grid and continuous stretches of these low-altitude points can be indicative of paleochannels. The grid shows the same general northwest-to-southeast trend of paleochannel network across Cannon AFB, but with the regional trend removed, it highlights relatively deeper portions of the paleochannels (more than 20 feet relative to the main paleochannel). These deeper areas of the paleochannel indicate areas with more saturated thickness. Esri’s ArcMap Hydrology toolset was used to determine the flow direction, flow accumulation, and stream order of paleochannels. A flow-direction grid was first created to find directional flow between cells, then used as input to the flow-accumulation tool, where a threshold lower than the default value was chosen to identify paleochannel flow paths. The final product is a map depicting flow paths based on the interpolated and smoothed top of Dockum Group altitudes. These two paleochannel analysis techniques show groundwater flow direction as well as areas with the deepest saturated thickness. Hydrologically, these techniques show where aquifer storage is highest (in the deepest parts of the paleochannel network), as well as the spatial distribution of preferential groundwater flow paths (the paleochannels). The analyses indicate a large paleochannel trending to the southeast with smaller channels feeding in from the west. Areas where groundwater management could be more beneficial are indicated by locations where these flow lines intersect the deeper parts of the paleochannel.
References Cited
Architecture, Engineering, Construction, Operations, and Management [AECOM], 2020, Cannon Air Force Base conceptual site model Curry County, New Mexico: AECOM technical memorandum AR 2784, 35 p., accessed May 3, 2022, at https://ar.afcec-cloud.af.mil/.
Becker, M.F., Bruce, B.W., Pope, L.M., and Andrews, W.J., 2002, Ground-water quality in the central High Plains aquifer, Colorado, Kansas, New Mexico, Oklahoma, and Texas, 1999: U.S. Geological Survey Water-Resources Investigations Report 02–4112, 64 p., accessed May 10, 2021, at https://doi.org/10.3133/wri20024112.
Cannon Air Force Base, 2022, 27th Special Operations Group of the United States Airforce: Cannon Air Force Base web page, accessed March 8, 2022, at https://www.cannon.af.mil/Units/27th-Special-Operations-Group/.
Chandra, S., Choudhury, J., Maurya, P.K., Ahmed, S., Auken, E., and Verma, S., 2020, Geological significance of delineating paleochannels with AEM: Exploration Geophysics, v. 51, no. 1, p. 74–83, accessed November 10, 2021, at https://doi.org/10.1080/08123985.2019.1646098.
Collison, J., 2016, Potentiometric surfaces, summer 2013 and winter 2015, and select hydrographs for the Southern High Plains aquifer, Cannon Air Force Base, Curry County, New Mexico: U.S. Geological Survey Scientific Investigations Map 3352, 2-p. pamphlet, accessed December 9, 2021, at https://doi.org/10.3133/sim3352.
Constable, S.C., Parker, R.L., and Constable, C.G., 1987, Occam’s inversion—A practical algorithm for generating smooth models from electromagnetic sounding data: Geophysics, v. 52, no. 3, p. 289–300. [Also available at https://doi.org/10.1190/1.1442303.]
Cronin, J.G., 1969, Groundwater in the Ogallala Formation in the Southern High Plains of Texas and New Mexico: U.S. Geological Survey Hydrologic Atlas 330, 9 p., accessed December 9, 2021, at https://doi.org/10.3133/ha330.
Dutton, A.R., and Simpkins, W.W., 1986, Hydrogeochemistry and water resources of the Triassic lower Dockum Group in the Texas Panhandle and eastern New Mexico: Austin, Tex., University of Texas, Bureau of Economic Geology Report of Investigations, no. 161, 51 p., accessed May 11, 2022, at https://store.beg.utexas.edu/reports-of-investigations/2698-ri0161.html.
Esri, 2021, ArcGIS Pro help: Esri web page, accessed April 28, 2021, at https://pro.arcgis.com/en/pro-app/latest/help/main/welcome-to-the-arcgis-pro-app-help.htm.
Fenneman, N.M., and Johnson, D.W., 1946, Physiographic divisions of the conterminous U.S.: U.S. Geological Survey Map, scale 1:7,000,000, accessed November 9, 2021, at https://water.usgs.gov/GIS/metadata/usgswrd/XML/physio.xml.
Geonics Limited, 2006, Products–TEM47: Mississauga, Ontario, Canada, Geonics Limited web page, accessed April 12, 2021, at http://www.geonics.com/html/tem47.html.
Gustavson, T.C., 1996, Fluvial and eolian depositional systems, paleosols, and paleoclimate of the upper Cenozoic Ogallala and Blackwater Draw Formations, Southern High Plains, Texas and New Mexico: Austin, Tex., University of Texas, Bureau of Economic Geology Report of Investigations no. 239, 62 p.
Gutentag, E.D., Heimes, F.J., Krothe, N.C., Luckey, R.R., and Weeks, J.B., 1984, Geohydrology of the High Plains aquifer in parts of Colorado, Kansas, Nebraska, New Mexico, Oklahoma, South Dakota, Texas, and Wyoming: U.S. Geological Survey Professional Paper 1400–B, 63 p., accessed February 16, 2022, at https://doi.org/10.3133/pp1400B.
Interpex Limited, 1996, IX1D version 3 1D sounding inversion: Golden, Colo., Interpex Limited software release, accessed on April 27, 2021, at http://www.interpex.com/ix1dv3/ix1dv3.htm.
Knowles, T., Nordstrom, P., and Klemt, W.B., 1984, Evaluating the groundwater resources of the High Plains of Texas: Texas Department of Water Resources Report 288, v. l, 178 p., accessed November 9, 2021, at https://www.twdb.texas.gov/publications/reports/numbered_reports/doc/R288/R288v1/R288v1.pdf.
Langman, J.B., Gebhardt, F.E., and Falk, S.E., 2004, Groundwater hydrology and water quality of the Southern High Plains aquifer, Melrose Air Force Range, Cannon Air Force Base, Curry and Roosevelt Counties, New Mexico, 2002–03: U.S. Geological Survey Scientific Investigations Report 2004–5158, 42 p., accessed November 9, 2021, at https://doi.org/10.3133/sir20045158.
Langman, J.B., Falk, S.E., Gebhardt, F.E., and Blanchard, P.J., 2006, Groundwater hydrology and water quality of the Southern High Plains aquifer: U.S. Geological Survey Scientific Investigations Report 2006–5280, 61 p., accessed November 9, 2021, at https://doi.org/10.3133/sir20065280.
Lucas, S.G., Hunt, A.P., and Hayden, S.N., 1987, The Triassic system in the Dry Cimarron Valley, New Mexico, Colorado and Oklahoma, in Lucas, S.G., and Hunt, A.P., eds., Northeastern New Mexico: New Mexico Geological Society, Guidebook 38, p. 97–777, accessed May 11, 2022, at https://nmgs.nmt.edu/publications/guidebooks/downloads/38/38_p0097_p0117.pdf.
Lucius, J.E., Langer, W.H., and Ellefsen, K.J., 2007, An introduction to using surface geophysics to characterize sand and gravel deposits: U.S. Geological Survey Circular 1310, 33 p. [Also available at https://doi.org/10.3133/cir1310.]
Luckey, R.R., and Becker, M.F., 1999, Hydrogeology, water use, and simulation of flow in the High Plains aquifer in northwestern Oklahoma, southeastern Colorado, southwestern Kansas, northeastern New Mexico, and northwestern Texas: U.S. Geological Survey Water-Resources Investigations Report 99–4104, 66 p., accessed July 1, 2021, at https://doi.org/10.3133/wri994104.
Mandache, C., and Brothers, M., 2005, Time domain lift-off compensation method for eddy current testing: e-Journal of NDT, v. 10, no. 6, 1 p., accessed June 13, 2022, at https://www.ndt.net/article/v10n06/mandache/mandache.htm.
Matherne, A.M., and Stewart, A.M., 2012, Characterization of the hydrologic resources of San Miguel County, New Mexico, and identification of hydrologic data gaps, 2011: U.S. Geological Survey Scientific Investigations Report 2012–5238, 44 p., accessed November 9, 2021, at https://doi.org/10.3133/sir20125238.
McGowen, J.H., Granata, G.E., and Seni, S.J., 1977, Depositional systems, uranium occurrence and postulated groundwater history of the Triassic Dockum Group, Texas Panhandle-eastern New Mexico: U.S. Geological Survey, 157 p., prepared by the Austin, University of Texas, Bureau of Economic Geology, Austin Tex. under grant no. 14-08-001-G410, accessed May 9, 2022, at https://www.beg.utexas.edu/files/publications/contract-reports/CR1977-McGowen-1.pdf.
New Mexico Interstate Stream Commission and New Mexico Office of the State Engineer, 2016, Lower Pecos Valley Regional Water Plan: Interstate Stream Commission, 264 p., accessed March 20, 2017, at http://www.ose.state.nm.us/Planning/RWP/Regions/10_Lower%20Pecos/2016/Reg%2010_Lower%20Pecos%20Valley_Regional%20 Water%20Plan%20December%202016.pdf.
New Mexico Water Rights Reporting System [NMWRRS], 2021, New Mexico Water Rights Reporting System: New Mexico Office of the State Engineer online database, accessed January 15, 2021, at http://nmwrrs.ose.state.nm.us/nmwrrs/wellSurfaceDiversion.html.
Payne, J.D., and Teeple, A.P., 2020, Surface geophysical data used for mapping the top of the Dockum Group on Cannon Air Force Base in Curry County, New Mexico, 2020: U.S. Geological Survey data release, https://doi.org/10.5066/P9P6KWR5.
Robson, S.G., and Banta, E.R., 1995, Ground water atlas of the United States—Segment 2, Arizona, Colorado, New Mexico, Utah: U.S. Geological Survey Hydrologic Investigations Atlas 730–C, 34 p., accessed January 23, 2020, at https://doi.org/10.3133/ha730C.
Seequent, 2020a, Oasis Montaj (ver. 9.8.1, August 2020): Seequent software release, accessed April 27, 2021, at https://www.seequent.com/products-solutions/geosoft-oasis-montaj/.
Seequent, 2020b, Regional trend removal: Broomfield, Calif., Seequent, web page accessed October 27, 2020, at https://www.seequent.com/products-solutions/geosoft-oasis-montaj/gridknit-extension.
U.S. Climate Data, 2021, 1981–2010 Clovis New Mexico weather averages: U.S. climate data web page, accessed August 9, 2021, at https://www.usclimatedata.com/climate/clovis/new-mexico/united-states/usnm0070.
U.S. Geological Survey, 2017, 1 meter digital elevation models (DEMs)—USGS National Map 3DEP downloadable data collection: U.S. Geological Survey data release, accessed December 5, 2021, at https://www.sciencebase.gov/catalog/item/543e6b86e4b0fd76af69cf4c.
U.S. Government Accountability Office, 2021, Report to Congressional Committees—Firefighting foam chemicals: U.S. Government Accountability Office web page, accessed March 8, 2022, at https://www.gao.gov/assets/gao-21-421.pdf.
Vignesh, A., Ramanujam, N., Kumar, B.S., and Rasool, Q.A., 2015, Application of time domain electromagnetic (Tdem) methods for mapping of salt freshwater intrusions and evaluate the porosity in Carbyn’s Cove, Wandoor and Khurumedhera Beaches in South Andaman: Journal of Coastal Zone Management, v. 18, no. 4, 5 p., accessed November 9, 2021, at https://doi.org/10.4172/2473-3350.1000413.
Conversion Factors
Datum
Vertical coordinate information is referenced to the North American Vertical Datum of 1988 (NAVD 88).
Horizontal coordinate information is referenced to the North American Datum of 1983 (NAD 83) and to the World Geodetic System 1984 (WGS 84) datum.
Altitude, as used in this report, refers to distance above the vertical datum.
For more information about this publication, contact
Director, Oklahoma-Texas Water Science Center
U.S. Geological Survey
1505 Ferguson Lane
Austin, TX 78754-4501
For additional information, visit
https://www.usgs.gov/centers/ot-water
Publishing support provided by
Lafayette Publishing Service Center
Suggested Citation
Payne, J.D., Teeple, A.P., McDowell, J., Wallace, D., and Hancock, W.A., 2022, Mapping the altitude of the top of the Dockum Group and paleochannel analysis using surface geophysical methods on and near Cannon Air Force Base in Curry County, New Mexico, 2020: U.S. Geological Survey Scientific Investigations Report 2022–5050, 21 p., https://doi.org/10.3133/sir20225050.
ISSN: 2328-0328 (online)
Study Area
| Publication type | Report |
|---|---|
| Publication Subtype | USGS Numbered Series |
| Title | Mapping the altitude of the top of the Dockum Group and paleochannel analysis using surface geophysical methods on and near Cannon Air Force Base in Curry County, New Mexico, 2020 |
| Series title | Scientific Investigations Report |
| Series number | 2022-5050 |
| DOI | 10.3133/sir20225050 |
| Year Published | 2022 |
| Language | English |
| Publisher | U.S. Geological Survey |
| Publisher location | Reston, VA |
| Contributing office(s) | Oklahoma-Texas Water Science Center |
| Description | Report: iv, 21 p.; 2 Data Releases; Dataset |
| Country | United States |
| State | New Mexico |
| County | Curry County |
| Other Geospatial | Cannon Air Force Base |
| Online Only (Y/N) | Y |
| Google Analytic Metrics | Metrics page |