

Sixty Years of Channel Adjustments to Dams in the Two Segments of the Missouri National Recreational River, South Dakota and Nebraska
Links
- Document: Report (27.0 MB pdf) , HTML , XML
- Data Release: USGS data release —Channel geometry, banklines and floodplain inundation over a range of discharges in two segments of the Missouri National Recreational River, South Dakota and Nebraska, 1955–2018
- Download citation as: RIS | Dublin Core
Acknowledgments
This report is part of a project in cooperation with the National Park Service and U.S. Geological Survey’s Ecosystem Program’s National Resources Protection Program (NRPP). Rick Clark, Lisa Yager and John Macy from the Missouri National Recreational River helped shape the scope of this project. Tim Cowman, South Dakota Geological Survey, and Mark Dixon, University of South Dakota, provided historical imagery and maps; at the time of publication, these data were not publicly available. The U.S. Army Corps of Engineers, Omaha District, provided historical aerial imagery, light detection and ranging and Hydrologic Engineering Center–River Analysis System (HEC–RAS) model datasets, and access to historical cross-section information.
Abstract
The Missouri National Recreational River (MNRR) consists of two Missouri River segments managed by the National Park Service on the border of South Dakota and Nebraska. Both river segments are unchannelized and maintain much of their pre-dam channel form, but upstream dams have caused reductions in peak flow magnitudes and sediment supply. The 39-mile segment is located between Fort Randall and Gavins Point Dams, transitioning from a riverine process domain to a distributary delta process domain in the headwaters of Lewis and Clark Lake. The 59-mile segment, an entirely riverine process domain, is downstream from Gavins Point Dam, the most downstream main channel dam on the Missouri River, and upstream from a highly altered navigation channel extending more than 1,000 kilometers downstream to St. Louis, Missouri. The National Park Service seeks to preserve the outstandingly remarkable natural, cultural, and recreational values of the MNRR. There is a particular need to understand bank-erosion processes to guide management decisions related to bank-erosion controls.
Changes in channel shape, as measured in topographic cross sections surveyed every 5–10 years since the mid-20th century, document bed incision (bed-elevation lowering) in riverine process domains, a mix of aggradation and incision in the delta, and aggradation in Lewis and Clark Lake. Channel incision is greatest in the 59-mile segment, where mean thalweg (deepest point in a cross section) incision is 3.5 meters, and net incision in the thalweg greater than 5 meters was observed at a cross section 93 kilometers downstream from Gavins Point Dam. Analysis of topographic cross sections also indicates that rates of bed-elevation change since 1960 were lowest in the 39-mile river segment and in Lewis and Clark Lake. Rates of bed-elevation change were higher in the delta and 59-mile segments but lower in cross sections near Gavins Point Dam where the channel is confined by bank revetment on both banks and the bed has coarsened substantially since completion of the dam. Several large floods in recent decades, including a post-dam record flood event in 2011, scoured the bed and deposited large high-elevation sandbars in both river segments, especially in the 59-mile segment. Analysis of topographic cross-sections indicates the 2011 flood event caused substantial erosion and deposition, low magnitude net incision in the river segments and delta, and considerable sediment aggradation in the lake. Surveys taken after the 2011 flood in the 59-mile segment indicate a trend of sediment rearrangement and channel recovery following large floods, with the highest parts of the bed, sandbars, eroding and lowering while sediment was deposited on the deepest parts of the channel, which increased in elevation.
Inundation modeling results indicate that the narrower valley in the 39-mile segment results in a higher percentage of the flood plain being inundated by flooding relative to the 59-mile segment, which has a much wider valley. Likewise, bed incision in the 59-mile segment has increased channel capacity and resulted in a modern channel corridor inset into a higher flood-plain surface. The inset flood plain was inundated by the 2011 flood, but the pre-dam flood plain is rarely inundated. Analysis of channel boundaries over time indicates that pre-dam channel-migration rates were as much as five times larger than modern channel-migration rates in the 59-mile segment. Bank erosion in the 59-mile segment has primarily been into post-1894 channel deposits; bank-erosion rates are comparably very low in the 39-mile segment. Analysis of channel-migration zones indicates that most erosion is isolated to local hot spots and is used to establish predictions for 10 and 20 years into the future based on past movement rates in both MNRR segments. Long-term bed-elevation and planform trends indicate that rates of adjustment in the 59-mile segment are slowing and may be approaching a new equilibrium, but recent large floods and spatial variability contribute to considerable uncertainty. Additional monitoring of channel morphology would be needed to confirm trends observed in this analysis.
Introduction
During the past century, reservoir construction and channelization have altered most of the main-stem Missouri River, leaving few segments that retain the physical and hydrologic characteristics of the pre-dam river. The 39-mile segment downstream from Fort Randall Dam to the headwaters of Lewis and Clark Lake and the 59-mile segment downstream from Gavins Point Dam are designated as the Missouri National Recreational River (MNRR). The segments are managed by the National Park Service (NPS, fig. 1) and retain much of the natural physical characteristics of the pre-dam Missouri River. These segments are generally wider and have more complexity than the downstream 1,200-kilometer (km) long navigation channel, with unvegetated sandbars, vegetated islands, side channels and backwaters, and eroding banks (Elliott and Jacobson, 2006; Yager and others, 2011; Holbrook and Allen, 2021).
The MNRR segments are some of the least altered within a 3,770-km long main-stem Missouri River system that has been highly altered by the construction of large reservoirs and navigation channels. The river in the MNRR segments has adjusted to changes in flow and sediment regime since dam completion in the 1950s and has experienced several large flood events in recent decades that have affected channel geomorphology.
Although river classification system nomenclatures are inconsistent when applied to complex rivers like the segments of the MNRR, the segments are described in this report as “braided meandering” following the rationale of Holbrook and Allen (2021). These MNRR segments combine the physical characteristics of braided and meandering rivers, with anastomosing, ephemeral channels coincident with single-thread, laterally migrating channels (Fuller and others, 2013). Both segments contain complex bar structures and channel-migration zones indicative of braided-meandering rivers. Notably, as indicated by the history of late-Holocene channel changes documented by Holbrook and Allen (2021) for the 59-mile segment, these river segments have transitioned between single-thread meandering and braided-meandering planforms multiple times during the past 5,000 years.
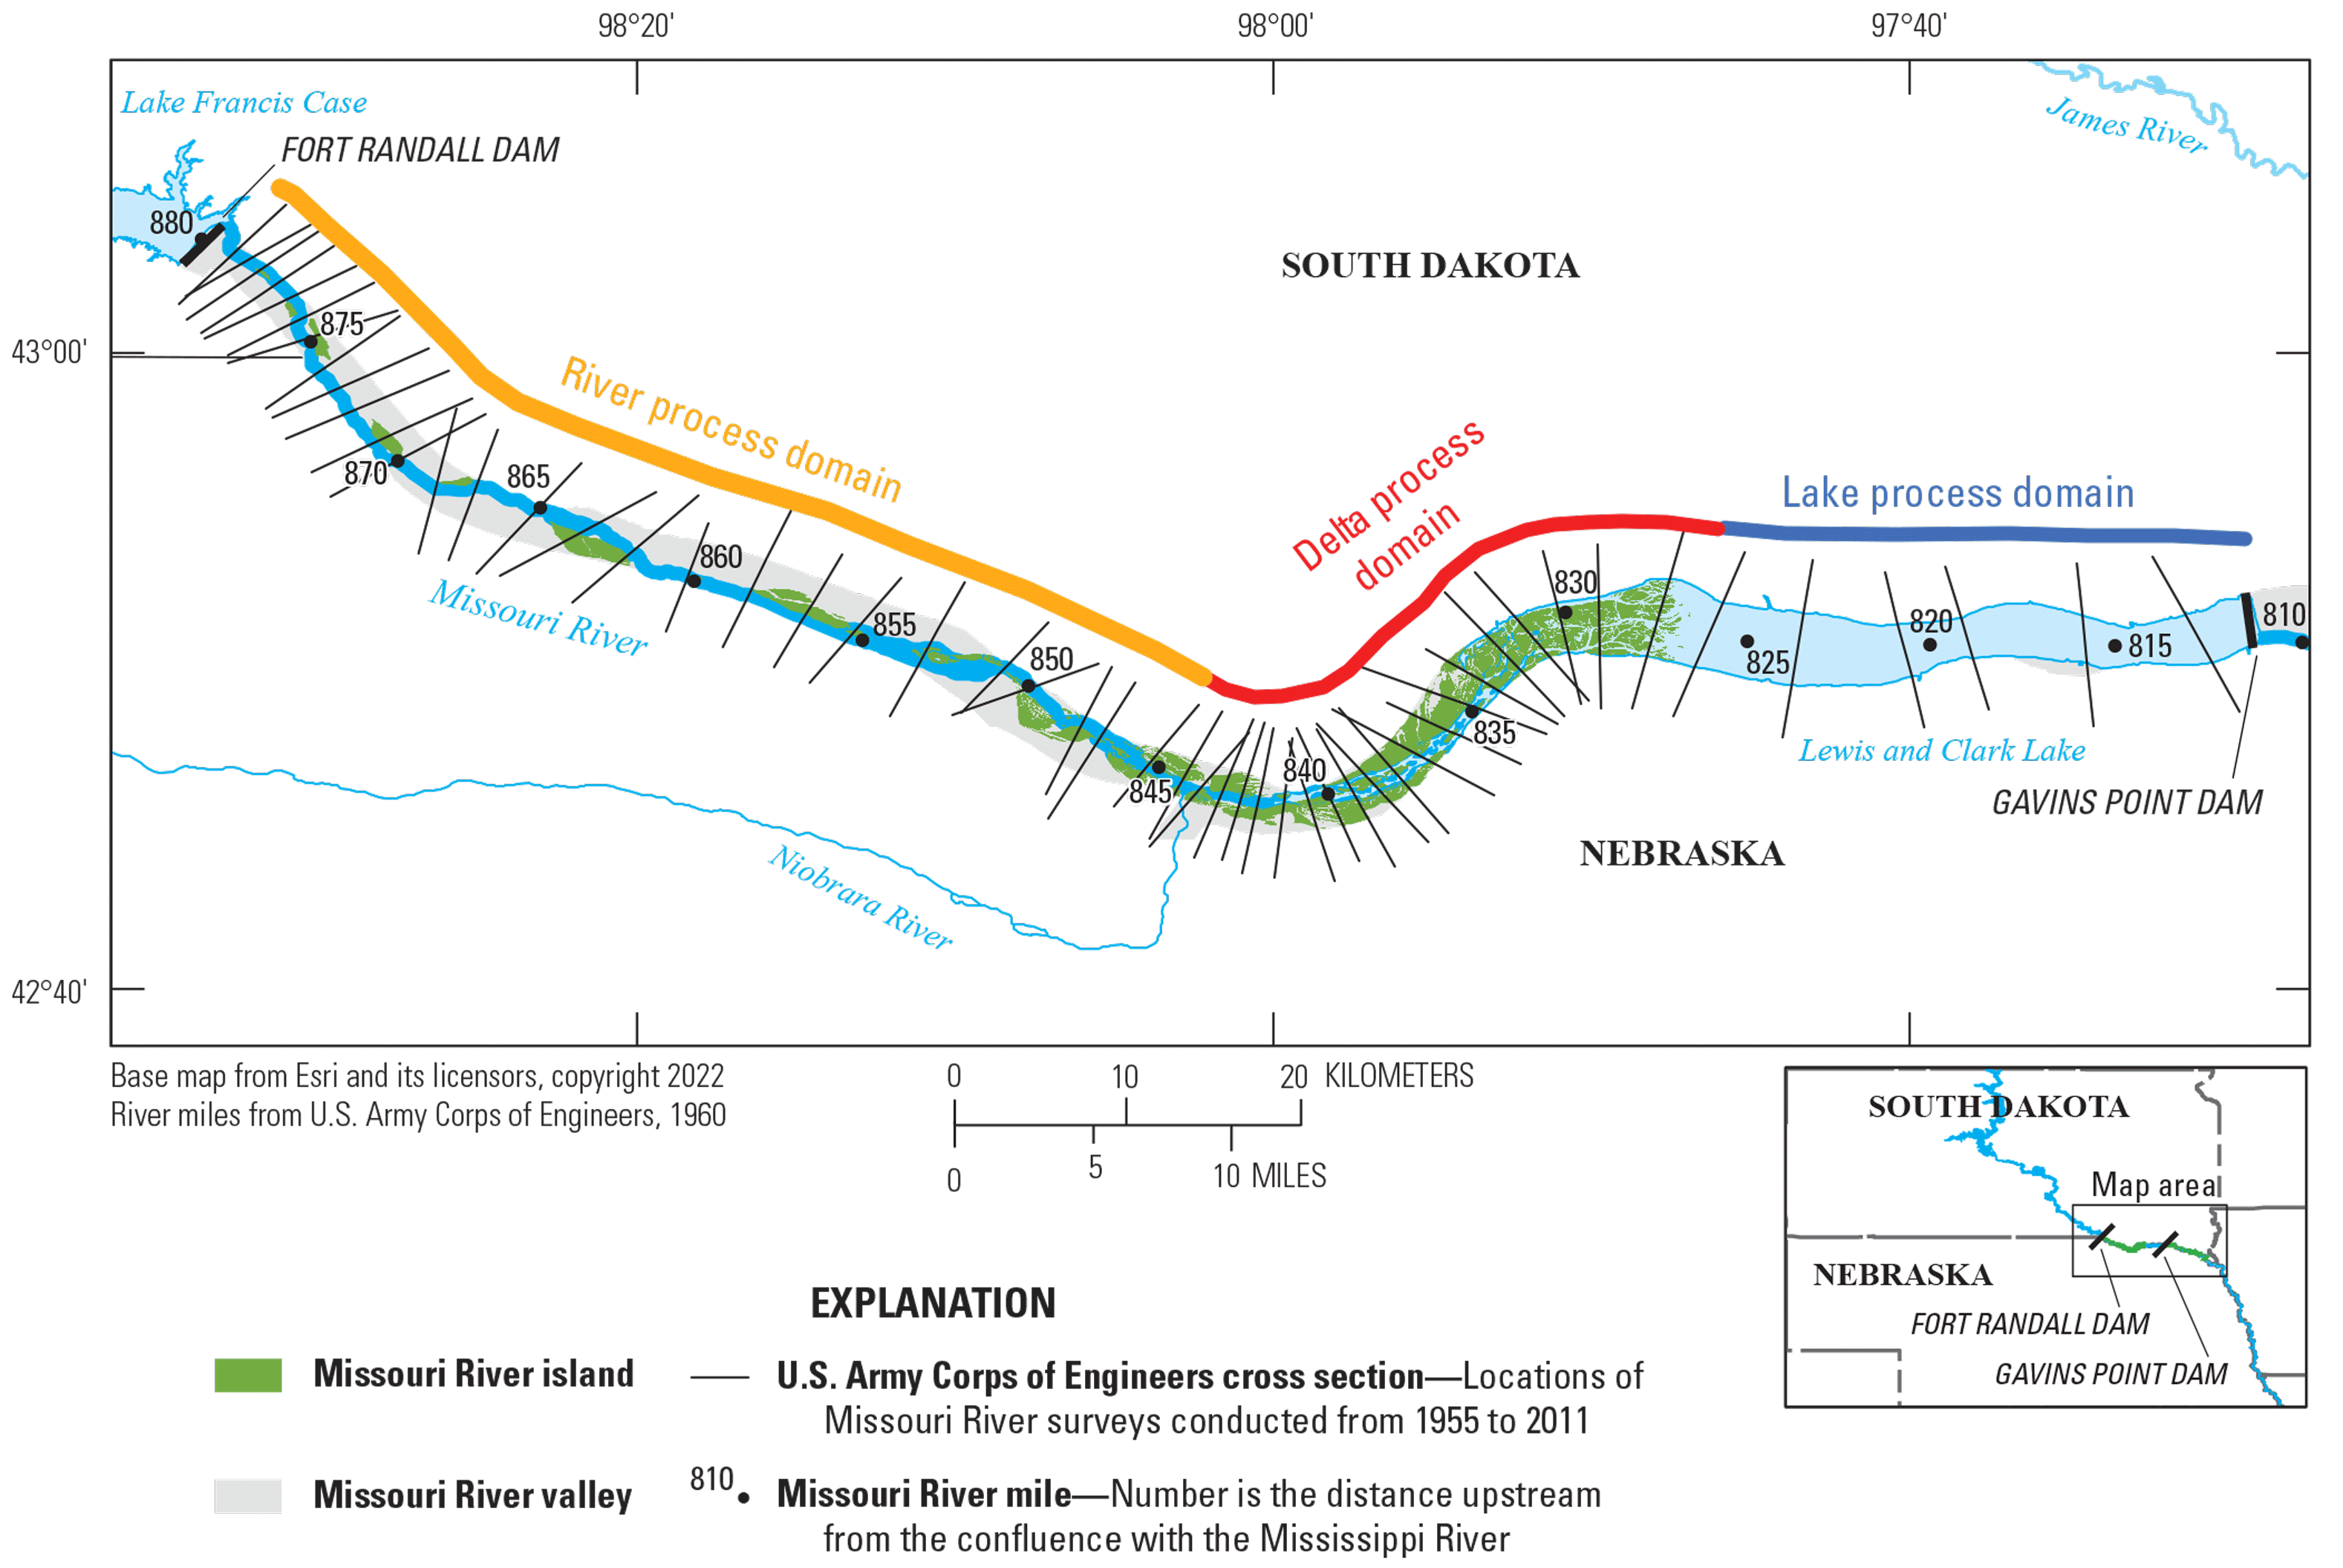
The general trends in the MNRR documented in previous studies apply to interpretations discussed in this report, with variations based on the specific geography of the MNRR. Spatial variability in the MNRR can be categorized in broad spatial process domains, also defined in table 1 as an upstream river processes domain in the 39-mile segment (river mile 879–844), a transitional delta domain into the Niobrara River–Lewis and Clark delta (river mile 844–827), a reservoir process domain in Lewis and Clark Lake (river mile 827–811), and river processes domain downstream from Gavins Point Dam (river mile 811–752).
Table 1.
Segments, locations of segment boundaries, and major features in the Missouri National Recreational River.[km, kilometer; MNRR, Missouri National Recreational River; NPS, National Park Service; --, not applicable]
The objective of the study described in this report was to determine the status and trends of geomorphic evolution of the Missouri River channel in the 39-mile and 59-mile segments of the MNRR. The analysis includes a synthesis of historical and recent datasets and quantification of how rare post-dam flood events like those in 1997 and 2011 punctuate and interact with multidecadal geomorphic adjustments from upstream main-stem dams. The study also evaluated spatial variability in bank-erosion rates, identifying bank-erosion hotspots during recent decades in the MNRR, and complied a channel-migration corridor synthesis for the MNRR based on past channel positions.
Geographic Setting
The MNRR consists of two Missouri River segments on the border between South Dakota and Nebraska, established as recreational river segments by the Wild and Scenic Rivers Act (Public Law 90–542, 82 Stat. 906, 16 U.S.C. 1271; fig. 1). The 59-mile segment downstream from Gavins Point Dam was established in 1978 and the 39-mile segment downstream from Fort Randall Dam was designated as a national recreational river in 1991 by amendments to the Wild and Scenic Rivers Act.
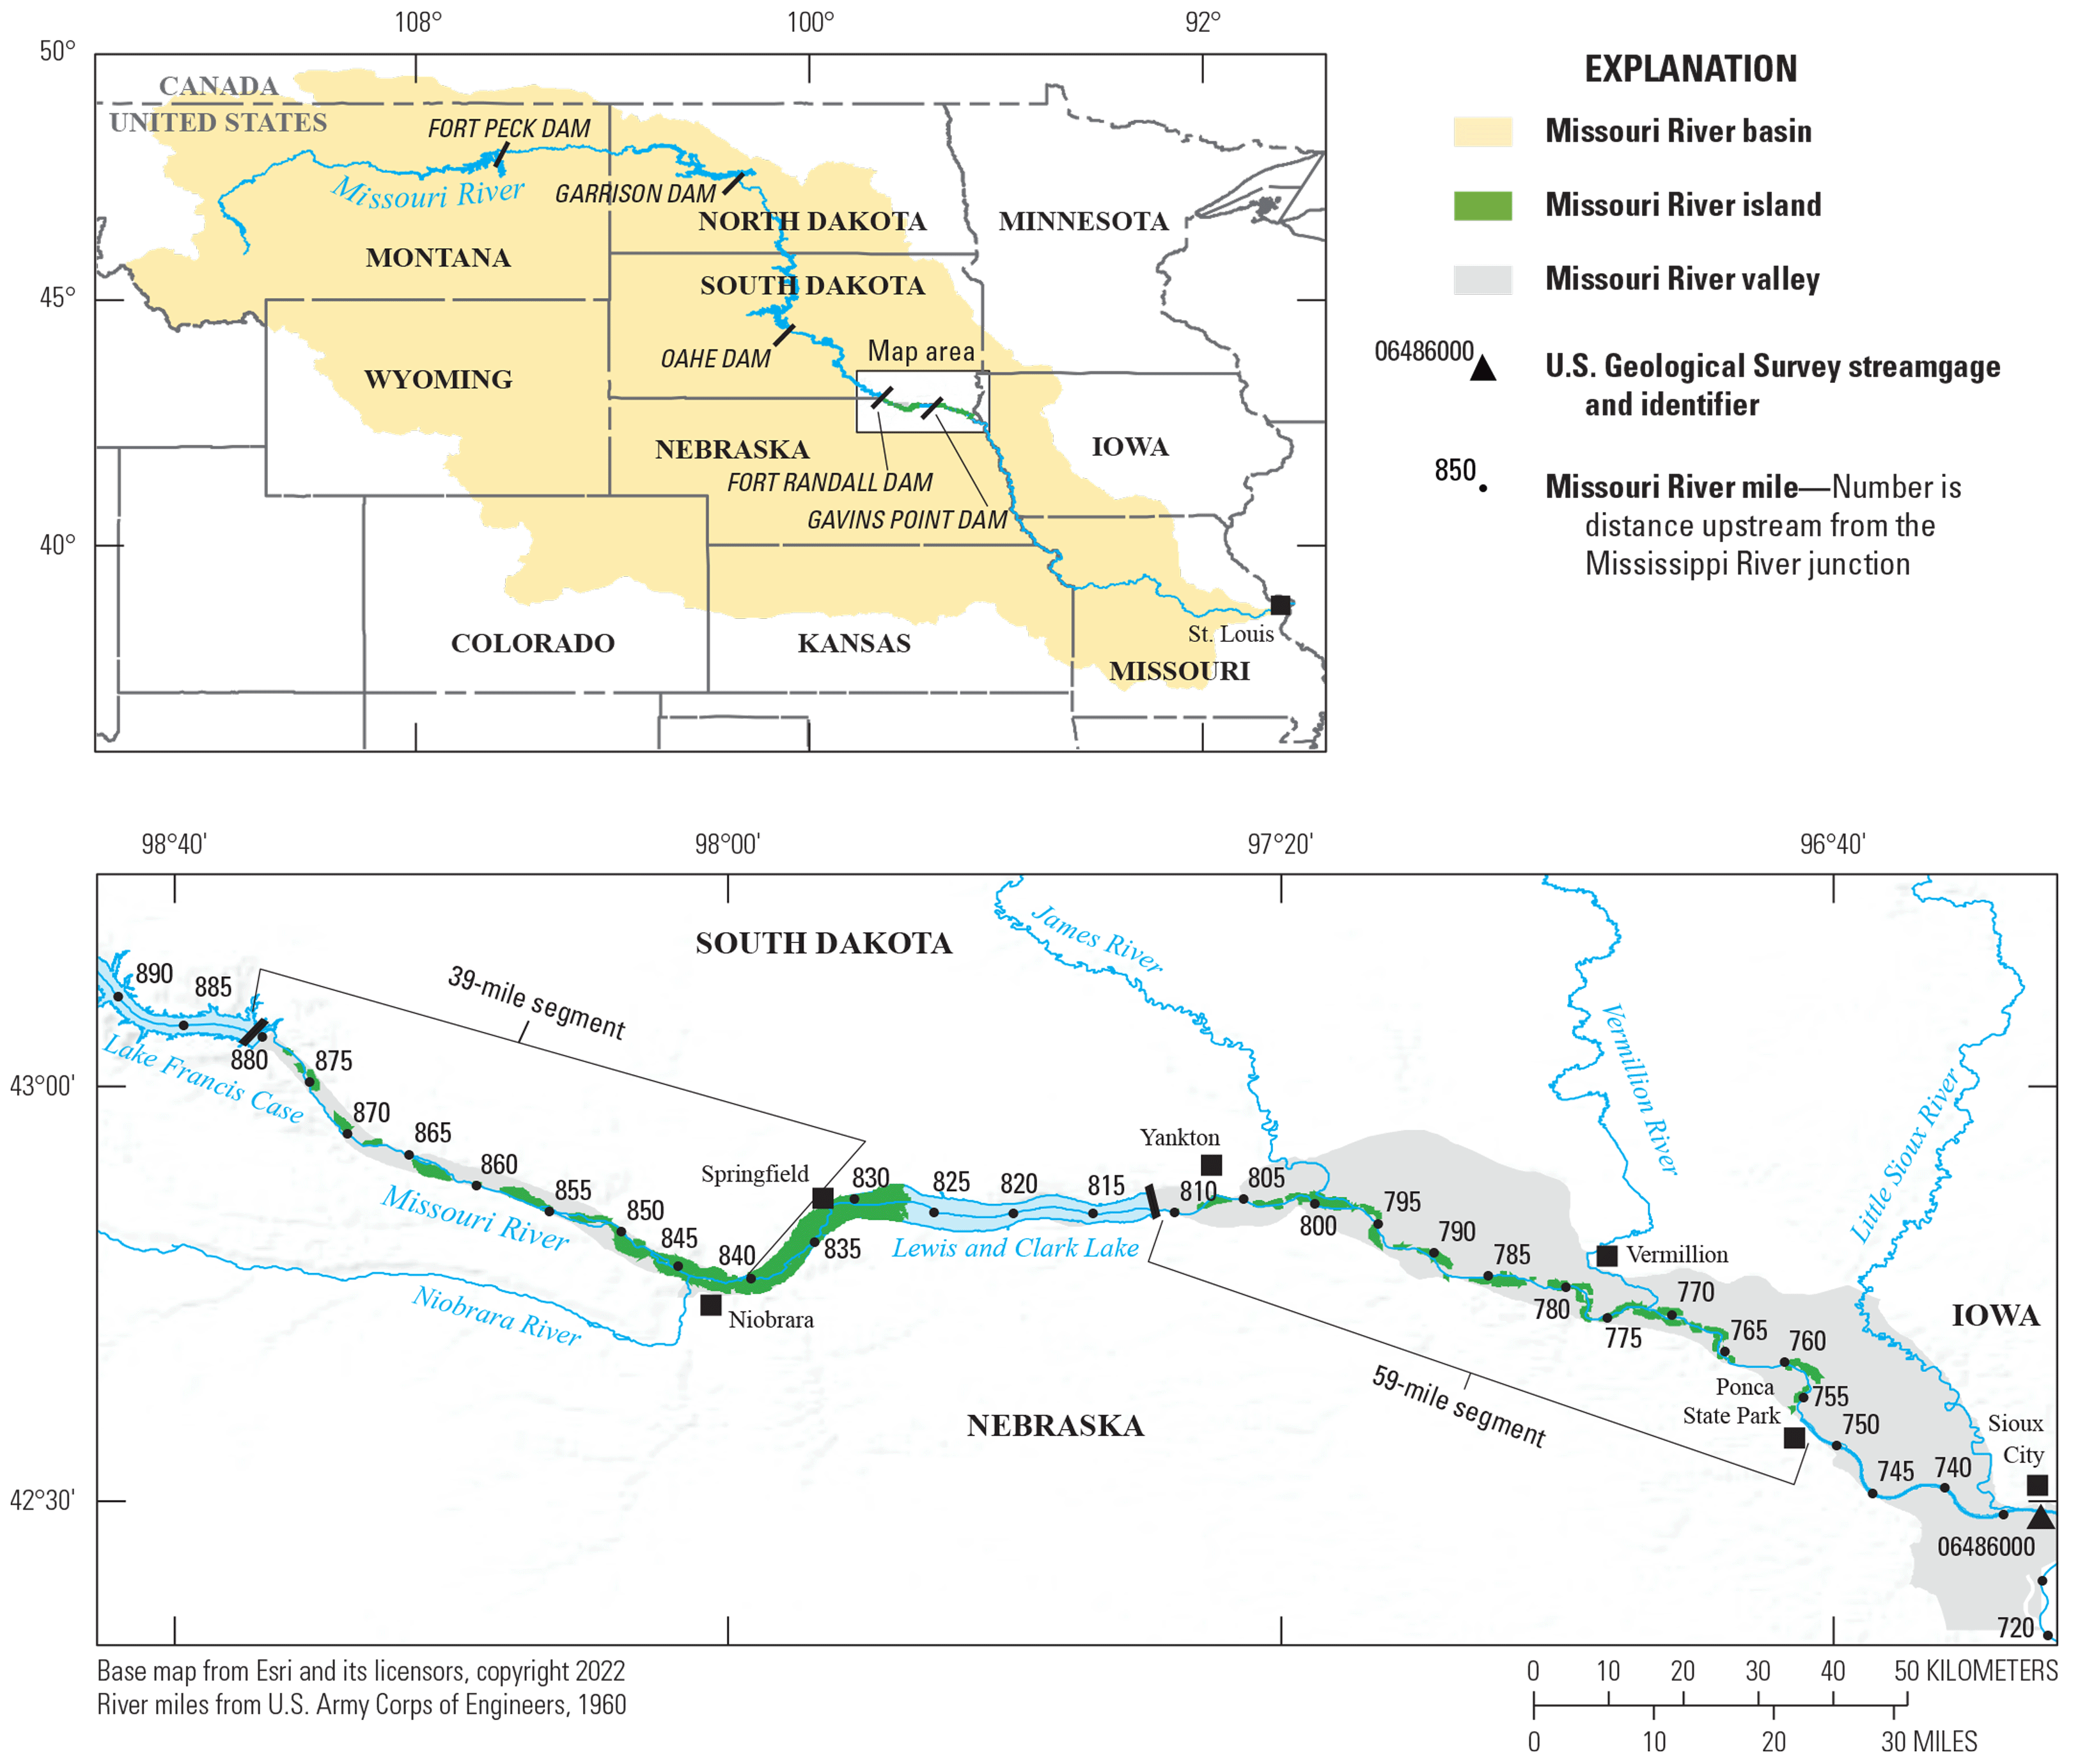
The 39-mile and 59-mile segments of the Missouri National Recreational River, adjacent river reaches, and nearby geographic features.
Construction of Fort Randall Dam began in 1946 and was completed with dam closure in 1952 (U.S. Army Corps of Engineers, 2006). Fort Randall Dam is located at Missouri River mile 879.6 and the 39-mile segment of the MNRR extends to river mile 840, near Springfield, South Dakota (fig. 1, table 1). The 39-mile segment is a single to multithreaded river, with a gradual transition to a multithread delta distributary system in the headwaters of Lewis and Clark Lake (fig. 1). The Niobrara River, which has a mean annual discharge of 1,708 cubic feet per second (ft3/s), enters the 39-mile segment near river mile 844 and is a source of sand and finer-grained sediments that are deposited near the confluence, in the delta, and in Lewis and Clark Lake (Coker and others, 2009).
Lewis and Clark Lake and the delta downstream from river mile 840 are not part of the MNRR; however, for the purposes of quantifying how processes in adjacent segments affect one another, this report includes data downstream from the 39-mile segment in the delta and Lewis and Clark Lake (table 1). Lewis and Clark Lake is the smallest of the six U.S. Army Corps of Engineers (USACE) reservoirs in the main-stem Missouri River system by volume (Galat and Lipkin, 2000; Galat and others, 2005). Sedimentation in the delta and Lewis and Clark Lake has caused a 30-percent reduction in storage capacity in the reservoir, resulting in increased bottomland flooding and a rise in local groundwater levels (U.S. Army Corps of Engineers, 2006). Impacts to local communities have included clogged water supply intakes, relocation of the town of Niobrara, Nebraska, in the 1970s, and frequent roadway repairs from repeated flooding (George and others, 2017). Ecologically, the delta region where the Missouri River transitions to Lewis and Clark Lake is rich and productive (Volke and others, 2015). The delta provides habitat for birds, fish, and amphibians including aquatic cover, food resources, and spawning habitat. It also provides recreational areas for fishing and hunting (Kaemingk and others, 2007; Graeb and others, 2009); however, continued sedimentation has buried some recreational access points and made travel difficult for boats (George and others, 2017).
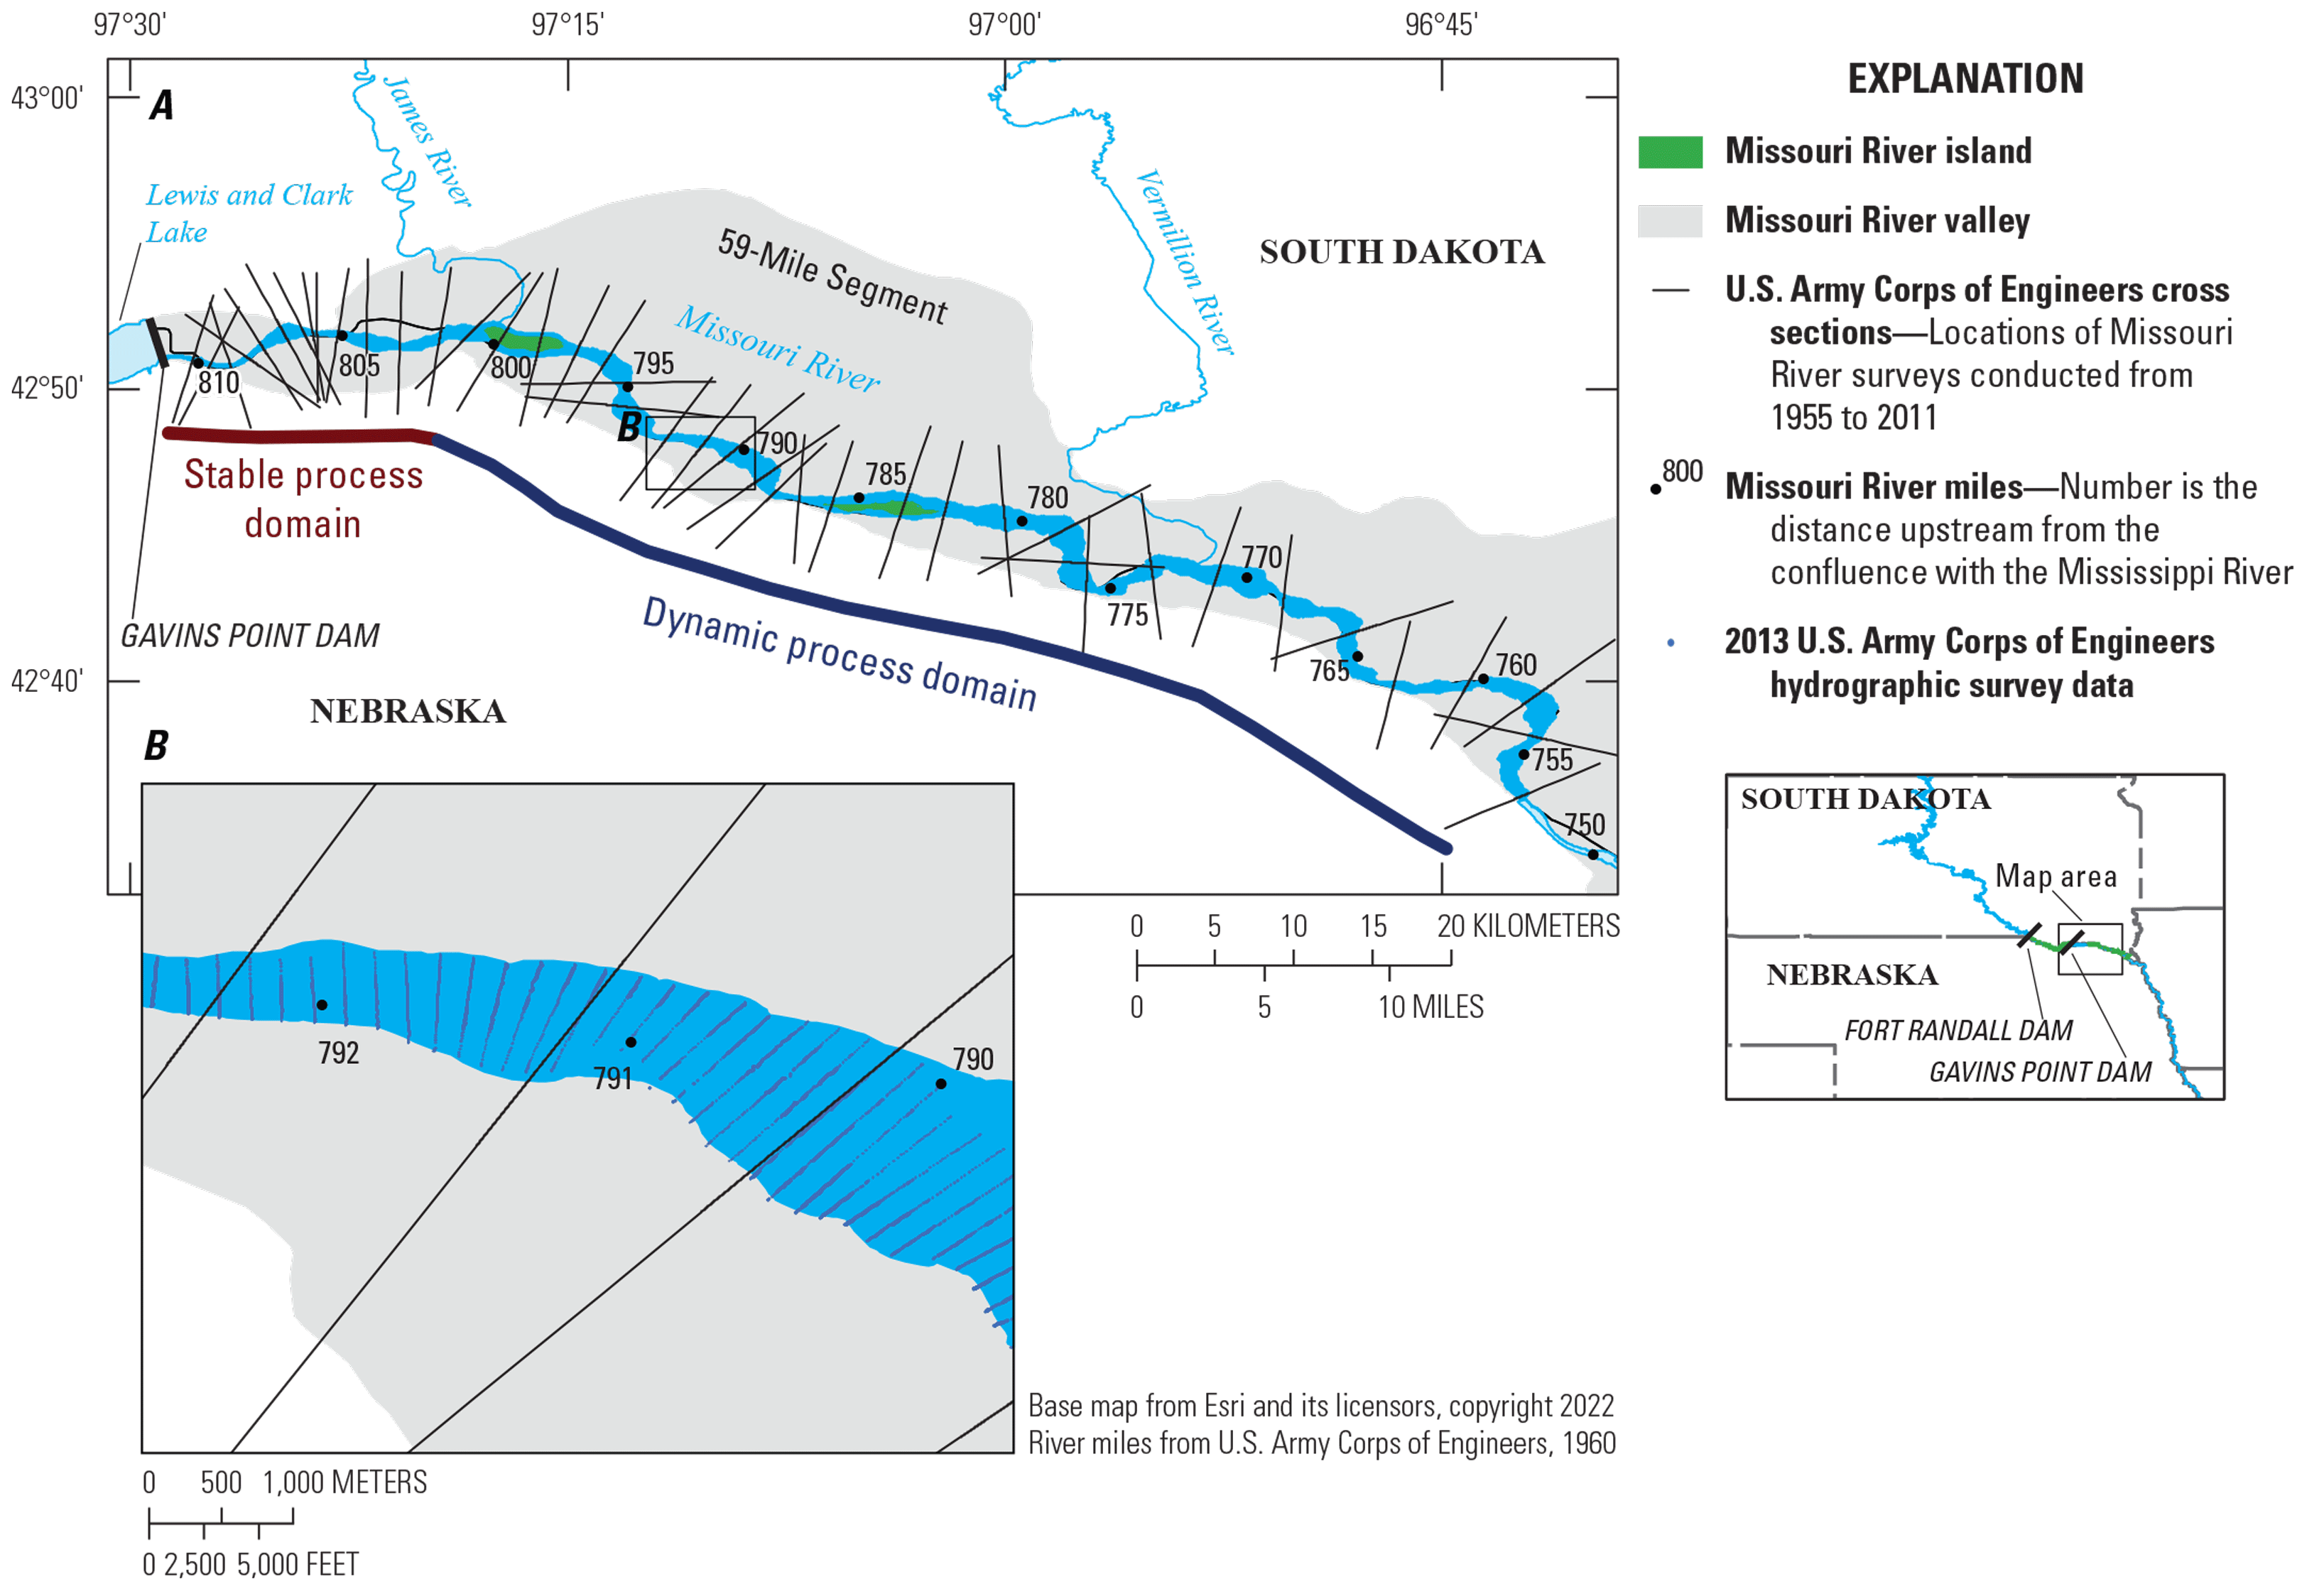
Gavins Point Dam, located at Missouri River mile 811, was constructed from 1952 to 1955 (U.S. Army Corps of Engineers, 2006). The 59-mile segment of the MNRR, established in 1978, extends downstream from Gavins Point Dam to Ponca State Park, near Missouri River mile 752 (fig. 1, table 1). Two tributaries enter the river from the north in this segment: the James River (river mile 800) and the Vermillion River (river mile 772). Although the 59-mile segment retains much of its pre-dam channel form, the post-dam river has less backwater area (40 percent from 1941 to 2008) and side-channel area (77 percent from 1941 to 2008) than the pre-dam channel (Yager and others, 2011). Backwater and side-channel habitats typically contribute to primary production in river ecosystems (Yager and others, 2011; Wesner and others, 2020).
Downstream from Ponca State Park, the Missouri River has been channelized, straightened, and narrowed into a navigation channel through the construction of levees, dikes, and bank armor (Ferrell, 1995). Channelization and flow management support a 9-foot deep, 300-foot wide self-scouring navigation channel downstream from Sioux City, Iowa, to St Louis, Missouri, a length of approximately 1,180 km (Ferrell, 1995). Channelization of the Lower Missouri River virtually eliminated the complex river habitats of the natural Lower Missouri River (Funk and Robinson, 1974; Elliott and Jacobson, 2006; Elliott and others, 2009; Jacobson and others, 2018).
Flow, Sediment, and Water-Quality Regime Changes
Floods in the pre-dam Missouri River were frequent (table 2), and the water was turbid owing to the large suspended-sediment loads (Galat and Lipkin, 2000; Blevins, 2006; Jacobson and others, 2009; Blevins, 2011). Regulation of the Missouri River began in 1938 with the construction of Fort Peck Dam in Montana, the first large main-stem dam, and the system of six large main-stem dams was completed in 1955 with the closure of Gavins Point Dam (U.S. Army Corps of Engineers, 2006). Flow regulation and management of the Missouri River System began around 1957 and has been somewhat consistent since 1967 (fig. 2). Regulation of the Missouri River, unlike some other regulated rivers in the Great Plains has not considerably altered the mean annual flow of the lower Missouri River (Costigan and Daniels, 2012). Pre-dam and post-dam median and mean annual flows in the 39-mile and 59-mile segments are of similar magnitude, about 30,000 ft3/s. Regulation has, however, altered the magnitude and timing of flows and the magnitude of flood flows and base flows, and it has substantially reduced the amount of sediment transported in the Lower Missouri River system (Galat and Lipkin, 2000; Jacobson and others, 2009).
Table 2.
High-flow events from daily mean values recorded during the period of record at Missouri River at Sioux City, Iowa, streamgage (U.S. Geological Survey station 06486000).[M, month; DD, day; YYYY, year; >, greater than; ft3/s, cubic feet per second]
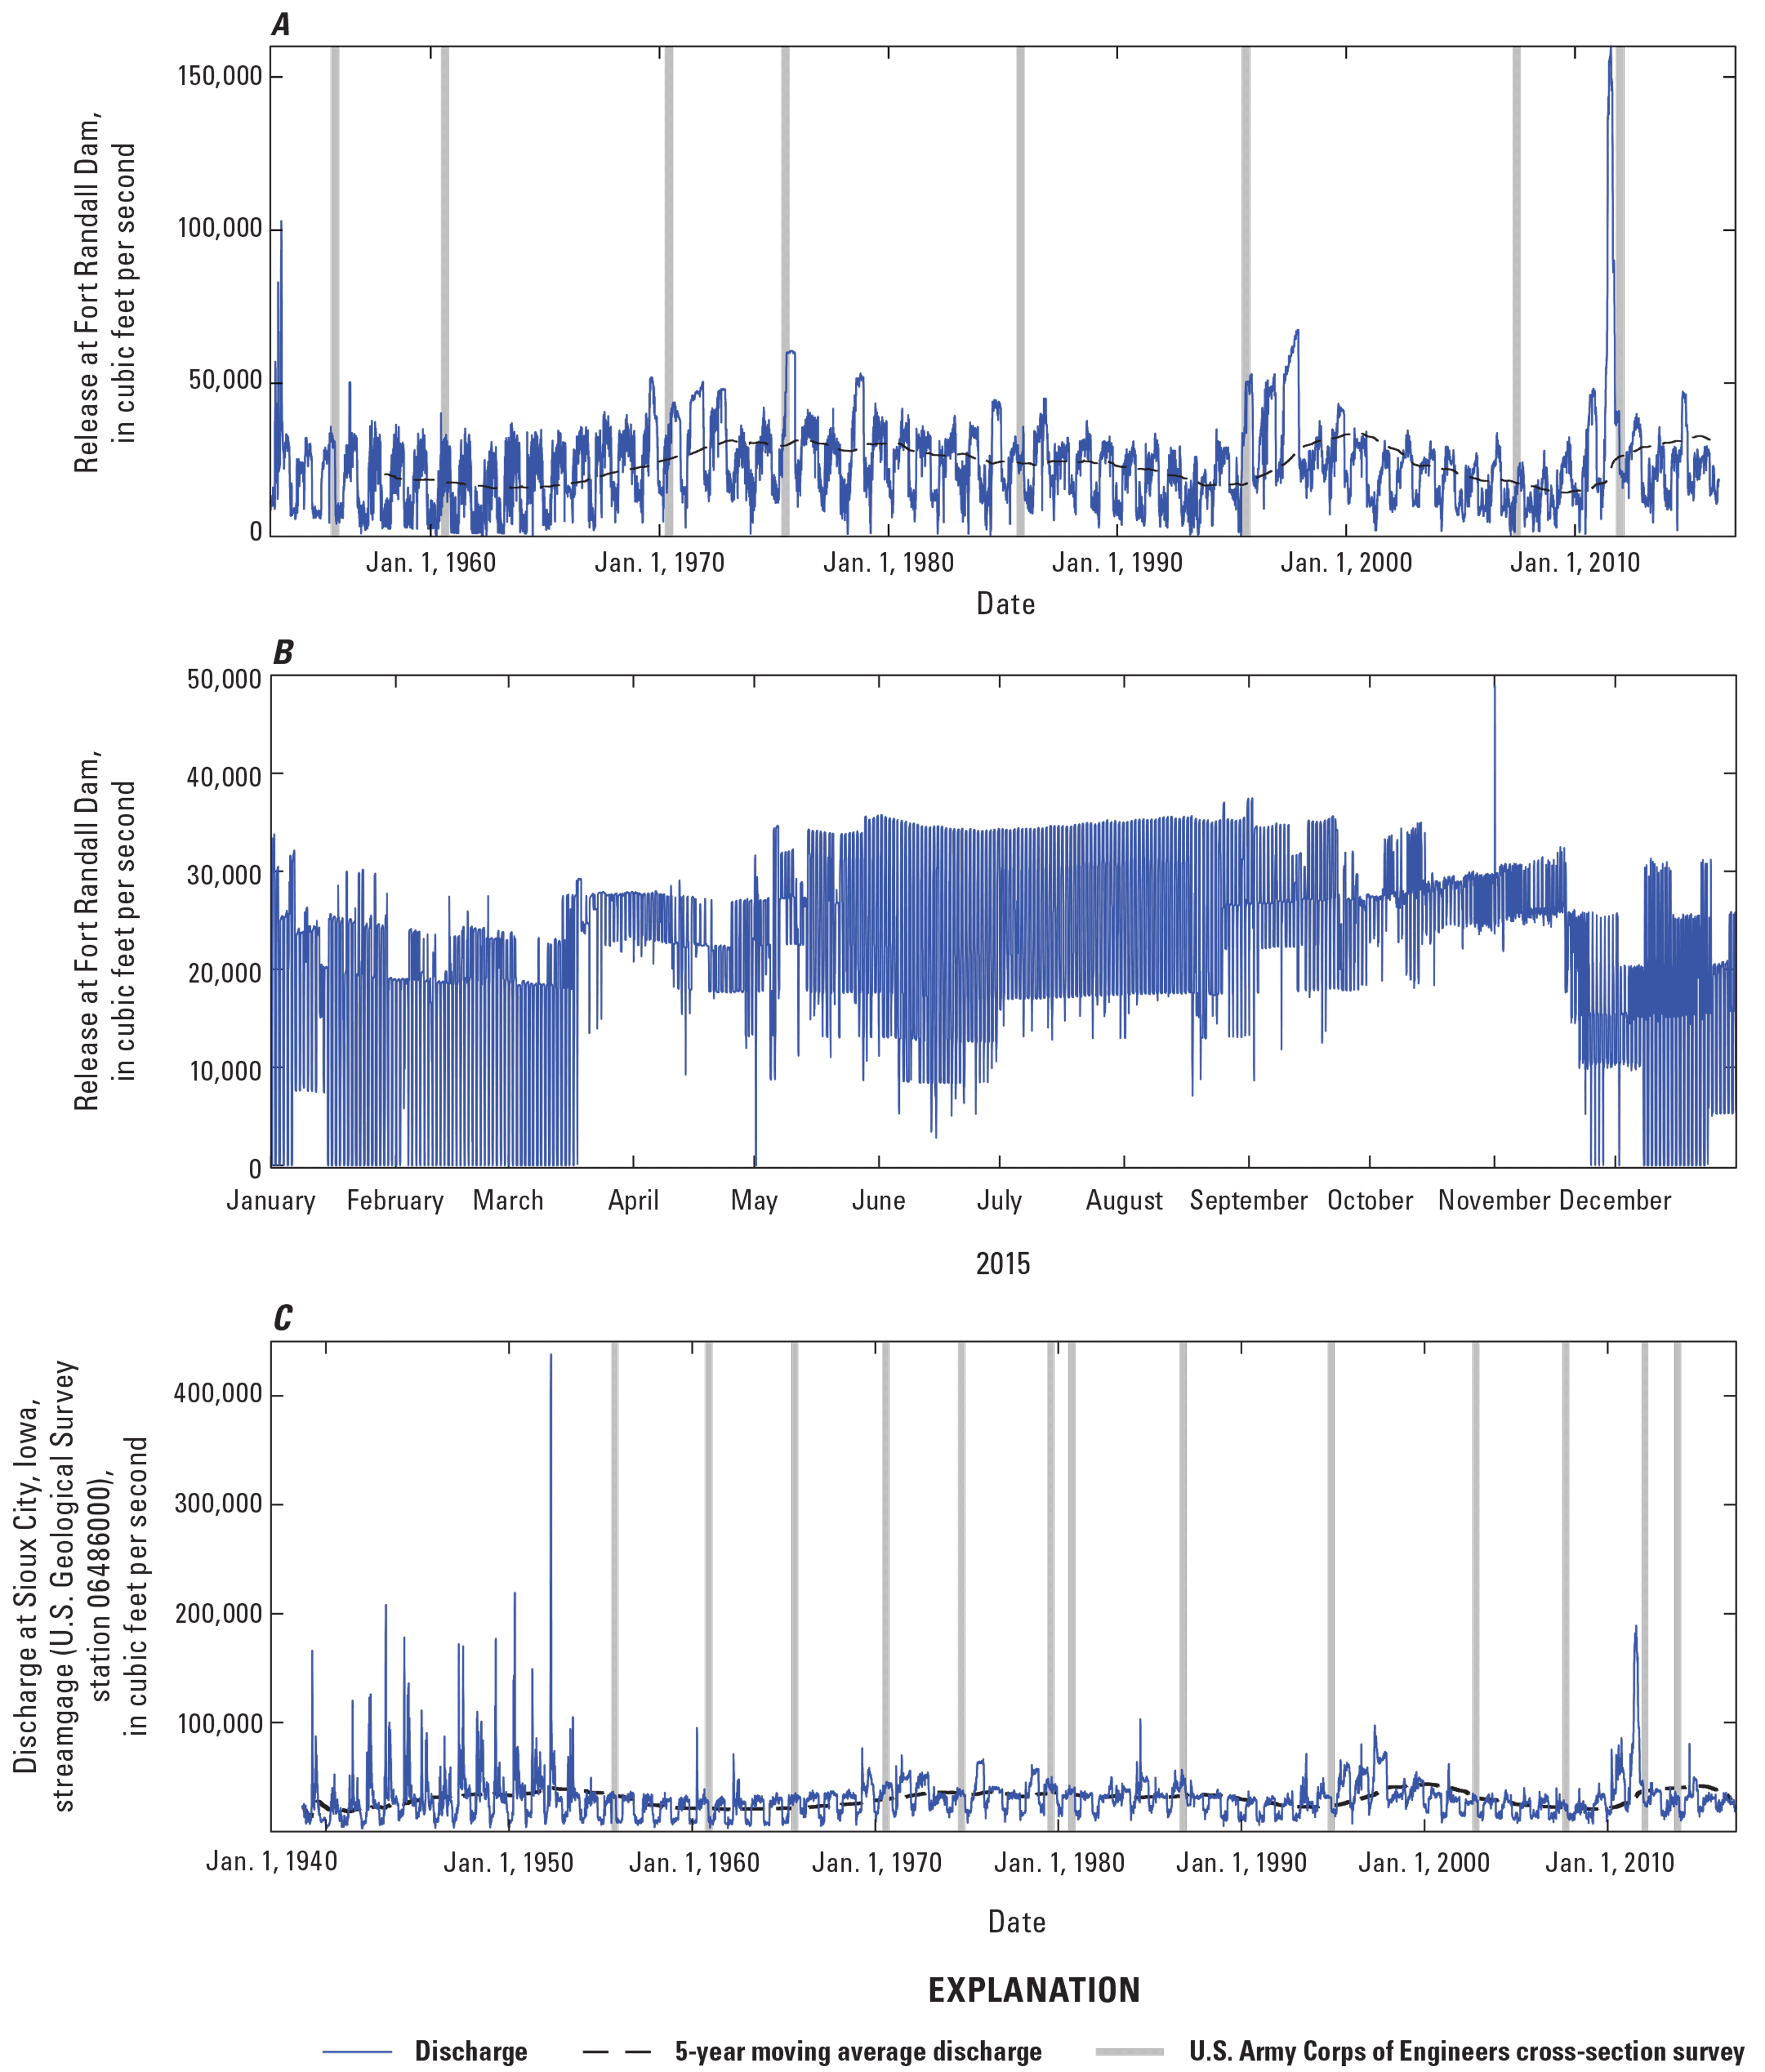
Flow records for the 39-mile and 59-mile Missouri National Recreational River segments. A, Fort Randall Dam. B, Example of hydropeaking at Fort Randall Dam from 2015. C, Missouri River at Sioux City, Iowa, streamgage (U.S. Geological Survey station 06486000) 76 miles downstream from Gavins Point Dam.
Fort Randall Dam is operated for flood control on an annual basis (fig. 2A) and for hydropower production. Hydropower production causes daily power-peaking cycles that vary in magnitude but are often in the range of tens of thousands cubic feet per second per day (fig. 2B). Gavins Point Dam is managed to smooth (re-regulate) peaking flows and deliver consistent flows to support navigation. Navigation support on the Lower Missouri River is provided March through November, with low-flow periods during winter months (fig. 2C). Large-magnitude, short-duration (days to weeks) flood events occurred frequently in the pre-dam Lower Missouri River (fig. 3A), with peaks of greater than 100,000 ft3/s in 14 of the 28 years of the pre-dam record (table 2). The pre-dam annual hydrograph of the Lower Missouri River typically had two peaks: one in April as snow melted from the Great Plains and a second peak in June or July corresponding to snowmelt from the headwaters in the Rocky Mountains (not shown Figure 1). Floods exceeding 100,000 ft3/s (measured at Missouri River at Sioux City, Iowa, streamgage (U.S. Geological Survey [USGS] station 06486000) have been rare in the post-dam Lower Missouri River, occurring only three times since dam closure (table 2). High-flow events have had a much longer duration in the post-dam period compared to those in the available pre-dam record (table 2, fig. 3). High amounts of snowpack and seasonal rainfall in the Upper Missouri River basin led to large flood events in 1997 and 2011 (fig. 3B). Both flood events were of long duration, lasting several months, in part owing to regulation intended to limit downstream flood damages. The 2011 flood resulted in 94 days of discharge greater than 100,000 ft3/s at Sioux City, Iowa, and a total of 180 days greater than 60,000 ft3/s (table 2). The 1997 flood was smaller in magnitude and similar in duration, with 251 days of discharges greater than 60,000 ft3/s at USGS streamgaging station 06486000 (fig. 3B; table 2). In 2019 a wet spring and rain-on-snow event in Nebraska caused a mid-March flood peak of 154,000 ft3/s at USGS station 06486000. The March 2019 flood, combined with above average snowpack and rainfall resulted in 38 days with discharges greater than 100,000 ft3/s at USGS station 06486000, and flows of greater than 60,000 ft3/s for 271 days (fig. 3B).
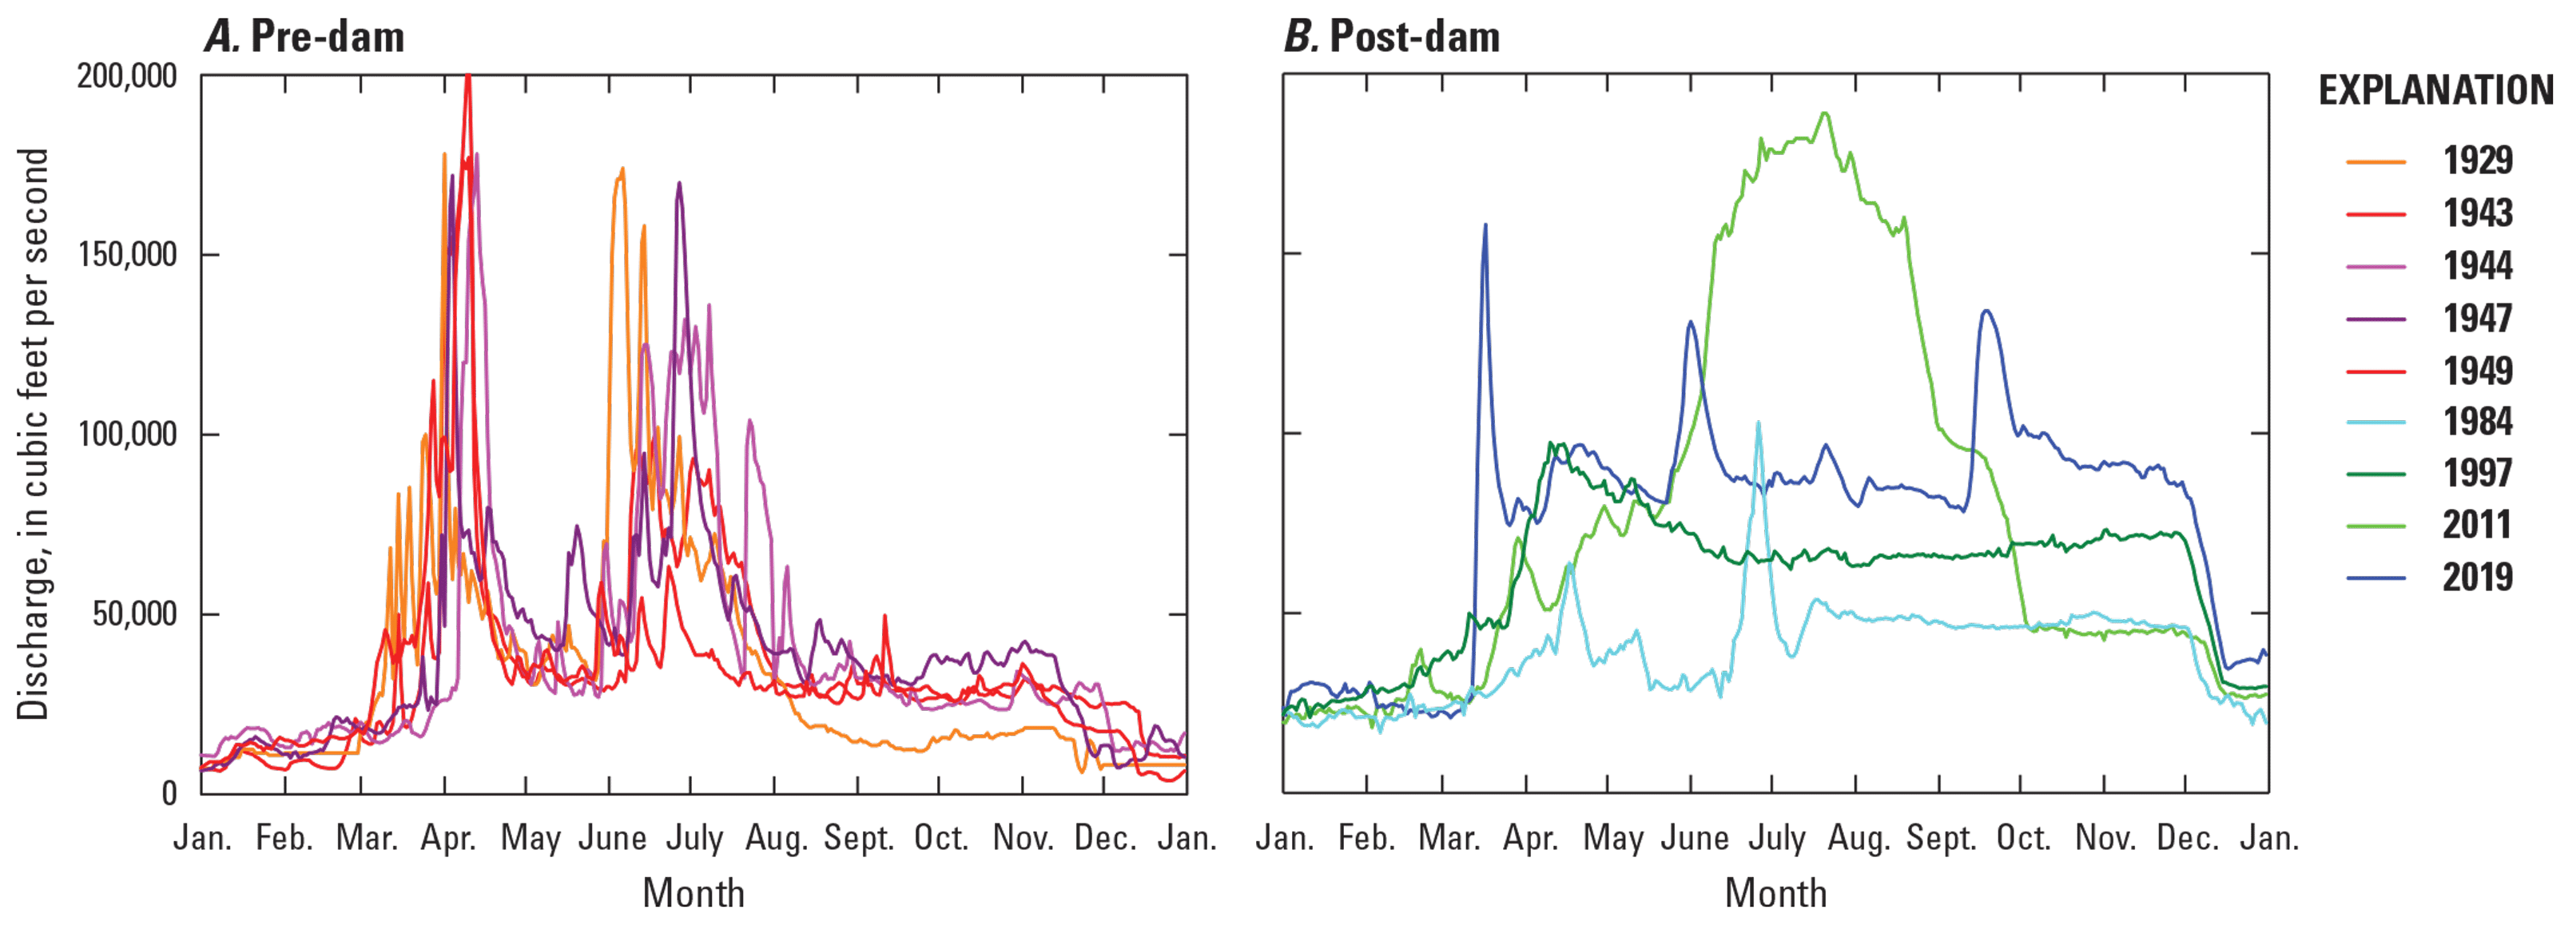
Examples from flood events at the Missouri River at Sioux City, Iowa, streamgage (U.S. Geological Survey station 06486000) 76 miles downstream from Gavins Point Dam. A, Pre-dam. B, Post-dam.
Closure of the Missouri River dams substantially diminished suspended and bedload sediment transport loads in the Lower Missouri River (Jacobson and others, 2009). Immediately downstream from Gavins Point Dam, the annual suspended-sediment load is essentially zero and the water is clear. More than 1,200 km downstream near St. Louis, Mo., the annual suspended-sediment load is about 17 percent of the earliest historical measurements (Jacobson and others, 2009). The reductions in sediment load relative to transport capacity have caused a series of complex and variable channel adjustments in the Lower Missouri River basin (Blevins, 2006, 2011). In addition to creating sediment deficits along the river and associated geomorphic adjustments, the lower suspended-sediment concentrations have resulted in decreased turbidity (increased water clarity), which has been associated with increases in primary productivity and changes to the phytoplankton community (Blevins, 2006, 2011)
River Management
The MNRR segments of the Missouri River are managed by the NPS in cooperation with the USACE, the U.S. Fish and Wildlife Service, the Nebraska Game and Park Commission, and the South Dakota Department of Game, Fish and Parks (National Park Service, 2017). The States of South Dakota and Nebraska and a mosaic of county and city municipalities, Tribes, and private landowners along the river’s banks are all stakeholders in management of the MNRR, shoreline features and infrastructure, and the river’s surrounding flood plain and bluff environment. The NPS currently owns only a small portion of land along the river (1,101 acres) (National Park Service, 2017). The USACE manages the Missouri River System for the congressionally authorized purposes of flood control, river navigation, hydroelectric power, irrigation, water supply, water quality, recreation, and fish and wildlife (U.S. Army Corps of Engineers, 2006). The NPS, through the Wild and Scenic Rivers Act, is charged with managing the free-flowing condition, and cultural, ecological, fish and wildlife, geological, recreational, and scenic outstandingly remarkable values of the MNRR segments (National Park Service, 2017). The NPS states “The purpose of the MNRR is to collaboratively work with multiple stakeholders to preserve and protect the natural, cultural, and recreational values of the last unchannelized and unimpounded segments of North America’s longest river along the South Dakota and Nebraska border” (National Park Service, 2017, p. 6).
Bank erosion has long been a concern in both segments, but especially in the 59-mile MNRR segment (Elliott and Jacobson, 2006). Unique to the Natural Wild and Scenic Rivers System, bank stabilization construction, operation, and maintenance in the MNRR were allowed through cooperative agreement with the USACE in 1978; bank-stabilization projects currently require permitting (Public Law 90–542, 82 Stat. 906, 16 U.S.C. 1271; Spegel, 2009; National Park Service, 2017). Much of the existing bank stabilization in the 59-mile segment of the MNRR was constructed by the USACE from 1974 to 1981 as part of bank stabilization demonstration projects (Spegel, 2009). Approximately 14 percent of the banks in the 39-mile segment and 33 percent of the banks in the 59-mile segment have been protected by rock revetment to prevent or limit bank erosion (Elliott and Jacobson, 2006). Additionally, 49 percent of the banks in the 39-mile segment and 5 percent of banks in the 59-mile segment are adjacent to bedrock bluffs that naturally limit bank erosion.
Channel movement and bank erosion are natural river processes that are beneficial to aquatic and riparian ecosystems (Florsheim and others, 2008). Geologic mapping and historical channel maps indicate the Missouri River has naturally migrated within its flood plain and occupied different positions in the broader valley bottom (Elliott and Jacobson, 2006; Holbrook and Allen, 2021). The NPS management of the 39-mile and 59-mile segments seeks to balance landowner needs for bank stabilization with preservation of the outstandingly remarkable values of the Missouri River. The NPS is faced with the challenge of managing river segments with different geomorphologic, geologic, and ecological settings requiring different management approaches. In addition, the river segments are subject to the constraint that much of the riparian land is held by private landowners and State agencies. An underlying assumption of this report is that improved understanding of river history and processes will aid management decisions.
Flood-plain planning that incorporates a channel-migration zone, or an erodible corridor concept, acknowledges the benefits of allowing a river to self-adjust rather than fighting river behavior by installing bank revetment. The idea, generally known as “room for the river” (Rijke and others, 2012; Biron and others, 2014) includes space on the landscape for flooding and channel migration. The benefits of the concept have been documented in other river systems within the United States and Europe and include decreased flood risk and increased ecological benefits (Rapp and Abbe, 2003; Piégay and others, 2005; Brierley and Fryirs, 2009). Implementation of the erodible corridor concept depends on estimates of future bank-erosion and channel-migration rates. Predictions of future bank erosion and channel migration are challenging in systems that are continually adjusting over time to the effects of dams, existing bank stabilization, floods, and adjacent impounded or channelized segments.
Computational models and simulations of single-thread channel meandering and bank erosion have been used previously to predict bank erosion and channel migration (Larsen and others, 2007), but such models are challenging to implement in a complex braided-meandering river like the MNRR. Process-based modeling of channel migration in the MNRR has been attempted using a 1-dimensional hydraulics and sediment transport model (Hydrologic Engineering Center–River Analysis System [HEC–RAS] version 4.0) coupled with the Bank Stability and Toe Erosion Model (Koohafkan and others, 2019). Koohafkan and others (2019) noted that, through extensive calibration, their model achieved useful results with 25–50-percent error; they also noted the substantial challenges of capturing sufficient detail in hydraulic geometry and flood-plain sediment material properties for parameterization of these models.
Identification of locations of substantial bank erosion and channel migration may also provide useful insights related to risk and preservation of cultural resources contained in historic flood-plain sediments. The NPS recognizes “the MNRR serves as a crossroads for a long and rich human history, past and present from early American Indians to European American Exploration, western steamboat commerce and expansion to the West” (National Park Service, 2017, p. 7). A cultural resource assessment for the MNRR’s 59-mile segment determined the river and surrounding flood plain and bluffs were occupied or used by many Native Americans present in the Great Plains for centuries before the arrival of European explorers through the 1860s (Ludwickson and others, 1981). Some Native Americans were residents of the MNRR region with established villages and agriculture; many other groups used the area for gathering, hunting, and fishing, or passed through and camped in the region. Early Native American cultural resources may include remains of villages, farming terraces, burial sites, and camps; artifacts include pottery, tools, beads, fibers, bones, antlers, and shells (Ludwickson and others, 1981). Additionally, 18th and 19th century resources, such as the remains of steamboat wrecks, Fort Randall, and remnants of early efforts to control the river, represent important cultural resources that preserve the history of the region (National Park Service, 2017). Bank erosion into materials older than those delimited by the earliest comprehensive maps of the 1890s may expose in situ Native American or early European cultural resources. Modern sediments may contain reworked and deposited cultural resources, including those from farther upstream in the Missouri River Basin.
In addition to cultural, land, and recreation resources, the MNRR is managed to support native species. There are two federally listed species that inhabit both MNRR segments: the endangered pallid sturgeon (Scaphirhynchus albus) and the threatened piping plover (Charadrius melodus). The formerly endangered least tern (Sternula antillarum) also inhabits the MNRR and was delisted by the U.S. Fish and Wildlife Service in January 2021 (U.S. Fish and Wildlife Service, 2021). Management of the Missouri River for these species is a complex, ongoing process involving many stakeholders and agencies (Jacobson and others, 2016; Buenau and others, 2018; Grigg, 2020; Langellier, 2020; Mac and Palmer, 2020).
Pallid sturgeon historically occupied the middle and lower Mississippi River, the Missouri River, and the downstream reaches of larger Missouri River tributaries (Dryer and Sandovol, 1993; U.S. Fish and Wildlife Service, 2014). Pallid sturgeon have been found in both MNRR segments, although the population in the 39-mile segment is essentially stranded between two main-stem dams and is dominated by hatchery-reared fish (Dryer and Sandvol, 1993; Jordan and others, 2016). Adult pallid sturgeon migrate upstream long distances (up to hundreds of kilometers) to spawning locations, and their progeny drift downstream in a larval developmental stage; long, unfragmented river segments are necessary for their survival and persistence (Dryer and Sandvol, 1993; Braaten and others, 2012). The 59-mile reach is connected to the rest of the Lower Missouri River and Mississippi River, and sturgeon have been documented migrating into and spawning within the 59-mile river segment (Elliott and others, 2020). Coarse gravel and (or) bedrock substrate is a common characteristic in pallid sturgeon spawning locations (Elliott and others, 2020), and there are several potential spawning locations within the 59-mile reach with exposed bedrock and gravel substrates (Laustrup and others, 2007; Elliott and others, 2009).
Piping plovers and least terns nest on barren, sandy to gravelly river sandbars in the 39-mile and 59-mile segments of the MNRR (Sherfy and others, 2012). River impoundments and regulation have contributed to the decline of least tern and piping plover habitat through sandbar habitat loss owing to reservoir inundation, reduction in high flows and sediment to build and maintain sandbar habitats, and reservoir regulation that can inundate nests (Buenau and others, 2018). Large floods, such as in 1997 and 2011, have built substantial emergent sandbar habitat on the MNRR, but vegetation colonization and erosion through time subsequently degrade sandbar habitats following flood events (Elliott and Jacobson, 2006; Catlin and others, 2015). Management for emergent sandbar habitat has included vegetation removal and control, mechanical construction of sandbars, controlled dam releases to prevent nest inundation, and management to limit human activity and predation near nesting sites (U.S. Army Corps of Engineers, 2011; Buenau and others, 2018). Least terns were delisted because of recent research that indicates their current population is resilient to changes in habitat across rivers in its nesting range, but recovery of populations in the northern Great Plains, including the MNRR, has been limited (Lott and others, 2013; U.S. Fish and Wildlife Service, 2021). Recent demographic studies of piping plover nesting success and survival concluded that constructed sandbars are less productive than natural sandbars created by large floods (Hunt and others, 2018).
Other native aquatic species of concern and rare species in the MNRR include paddlefish (Polyodon spathula), shovelnose sturgeon (Scaphirhynchus platorynchus), flathead chub (Platygobio gracilis), silver chub (Macrhybopsis storeriana), sauger (Sander canadensis), and several species of minnows (Berry and Young, 2004). Multiple species of freshwater mussels, including some species rare in Nebraska and South Dakota have been collected in both of the unchannelized MNRR segments (Hoke, 2011; Schainost, 2016). Invasive species are also present in both of the MNRR segments, including bighead carp (Hypophthalmichthys nobilis), silver carp (Hypophthalmichthys molitrix), grass carp (Ctenopharyngodon idella), common carp (Cyprinus carpio), brown trout (Salmo trutta) (Berry and Young, 2004), zebra mussels (Dreissena polymorpha), and quagga mussels (Dreissena bugensis) (Schainost, 2016).
Riparian vegetation communities of conservation interest include plains cottonwood (Populus deltoides) forests, which have declined in unchannelized Missouri River segments, including the MNRR, although the mechanisms and threats for decline vary by river segment (Dixon and others, 2012). In the downstream reaches of the 39-mile segment, rising groundwater levels owing to sediment deposition in the delta have converted cottonwood forests to emergent marsh, wet shrubland, and wet grasslands (Dixon and others, 2012). In the 59-mile segment and in the reaches proximal to the dam in the 39-mile segment, the decline of cottonwood forests has been linked to a reduction in flooding and lack of channel migration. The historic, pre-dam flood plain contains relict cottonwood forests with little to no recruitment of young cohorts (Dixon and others, 2012). Some of these aging cottonwood forests are converting to invasive red cedar (Juniperus virginiana), which colonize the same sandy soil deposits as cottonwoods but are more tolerant of the dry conditions of high-elevation, pre-dam flood-plain surfaces (Greene and Knox, 2014). Cottonwood recruitment does occur on lower elevation, flood-plain surfaces inset into the higher flood plain; however, these surfaces are also subject to vegetation removal for sandbar habitat management or are subject to scour by large, long-duration flood events, such as the 2011 flood (Dixon and others, 2015; Buenau and others, 2018). The MNRR has several invasive, non-native plant species including purple loosestrife (Lythrum salicaria), Russian olive (Elaeagnus angustifolia), and common reed (Phragmites australis). Invasive riparian plants, like common reed, have posed substantial river-management challenges in other low-slope sand-bed rivers on the Great Plains (Rapp and others, 2012; Bankhead and others, 2017).
Missouri River Responses to Dams and Reservoirs
Bed incision (lowering) has been documented downstream from dams in many settings (Williams and Wolman, 1984; Kondolf, 1997; Schmidt and Wilcock, 2008). The magnitude and spatial variability differ between river settings and can depend primarily on post-dam sediment supply, bed-material grain size, space available for channel adjustment, geologic setting, magnitude of hydrologic changes, location of tributaries, dam spacing, and the time since dam closure (Grams and Schmidt, 2002; Grant and others, 2003; Grant, 2012; Skalak and others, 2013)
Stage records in the tailwaters downstream from Fort Peck, Garrison, Oahe, Fort Randall, and Gavins Point Dams indicate overall trends of bed incision (Pokrefke and others, 1998; U.S. Army Corps of Engineers, 2017). Specific-gage analysis has documented bed lowering of low-flow stages of approximately 2.75, 3.35, and 4 meters (m) at Garrison, Fort Randall, and Gavins Point dams from closure to 2017 (U.S. Army Corps of Engineers, 2017). The Missouri River segments downstream from Garrison and Fort Randall Dams are inter-reservoir river segments in which incision is limited at the downstream ends by reservoir headwaters. In contrast, the segment downstream from Gavins Point Dam flows into an undammed, 1,200-km-long, self-scouring, engineered navigation channel.
All of the tailwaters downstream from Garrison, Fort Randall, and Gavins Point Dams decreased at low-water stages that were initially rapid and became more stable in the 30 years after dam closure (U.S. Army Corps of Engineers, 2017). Low-water stage decreased at accelerated rates downstream from all three dams from 1995 to 1998 and also in 2011–12, likely related to high releases in 1997 and 2011 flood years. From 2012 to 2017, stages at Gavins Point Dam appeared to be stabilizing (U.S. Army Corps of Engineers, 2017).
Low-water stage trends in the navigation channel farther downstream from the 59-mile segment have indicated a decrease of as much as 5 m from 1930 to 2011 at USGS Station 06486000 at Sioux City, Iowa (76 miles downstream from Gavins Point Dam) and a rebound of 0.3–0.6 m since 2011 (U.S. Army Corps of Engineers, 2017). The drop in low-water stage decreases moving downstream to approximately 2 m at Omaha, Nebr. (approximately 200 miles downstream from Gavins Point Dam).
An analysis of USACE cross sections in the Missouri River segment downstream from Garrison Dam determined erosion rates were highest closest to the dam, and the rate of change decreased moving downstream into a transitional zone in the headwaters of Lake Oahe (Skalak and others, 2013). Skalak and others (2013) also determined that the rate of change in the thalweg elevation decreased over time closer to the dam compared to 50-km downstream from the dam. The area closer to the dam achieved a new equilibrium more quickly than the downstream region (Skalak and others, 2013).
These channel-incision trends are also apparent in the longitudinal distribution of patterns of wetness and connectivity along the lower 811 miles of the Missouri River flood plain (Chojnacki and others, 2012). Chojnacki and others (2012) determined the flood plain of the 59-mile segment of the MNRR downstream from Gavins Point Dam has a much larger percentage of its flood plain that is inundated only during high (greater than 500 years) recurrence class flows than any other Missouri River segment. Flood-plain connectivity at lower return intervals increases downstream, particularly downstream from the Platte River (Jacobson and others, 2007; Chojnacki and others, 2012).
Methods
Multiple datasets were assembled to document and quantify the geomorphic history of the MNRR segments since dam closure. These data include elevation data from cross-section surveys, hydrodynamic model predictions, bathymetric and topographic surveys, aerial photography, and river discharge records. Unless otherwise noted, datasets were compiled and analyzed in ArcGIS version 10.5 (Esri, 2017).
Light Detection and Ranging (lidar) Topographic Data
Light detection and ranging (lidar)-derived topographic digital elevation model datasets used in this study were obtained from multiple sources, including the USACE, and U.S. Department of Agriculture’s (USDA) Natural Resources Conservation Service’s digital elevation data program (table 3). Most of the lidar data, which range in acquisition date from 2005 to 2015, are quality level 3, indicating vertical root-mean square error equals 20 centimeters (cm). These data are not available currently from the USGS National Map database, which is limited to quality level 1 and 2 (root-mean square error=10 cm lidar data; Heidemann, 2012). Missouri River lidar datasets contracted by the USACE include in-channel topography but not bathymetry below the water surface during the flight date and are limited to areas within and near the river’s high banks. These datasets also contain several spatial gaps in the delta region and in Lewis and Clark Lake. In the 39-mile and 59-mile segments, a “best available lidar” layer was generated using the most recent high-resolution Missouri River surveys collected by the USACE combined with the best available lidar from other agencies to fill in the rest of the flood plain; this layer was used for flood extent predictions as described in the “Model Data” section. The lidar datasets compiled to generate the “best available lidar” layers are noted in table 3.
Table 3.
Light detection and ranging (lidar) datasets available for the Missouri National Recreational River.[M, month; DD, day; YYYY; USACE, U.S. Army Corps of Engineers; lidar, light detection and rangin; NRCS, Natural Resource Conservation Service; cm, centimeter; m, meter; 3DEP, 3D Elevation Program]
| Year | Source | Dates (MM/DD/YYYY) |
Quality level1 | Vertical accuracy (cm) |
Horizontal accuracy (m) |
Notes |
|---|---|---|---|---|---|---|
| 39-mile Missouri National Recreational River segment | ||||||
| 22005 | USACE Missouri River lidar | 10/28–30/2005 and 11/1–21/2005 | 3 | 15 | 0.22 | River corridor only |
| 32012 | Nebraska NRCS Lidar (NRCS, 2012) | 1/25/2012–3/18/2012 | 3 | 18.75 | 1 | County-level |
| 2,32011 | USACE Missouri River lidar | 11/17/2011–11/24/2011 | 3 | 18.5 | 1 | River corridor only |
| 2015 | Bon Homme County South Dakota Lidar (South Dakota Department of Agriculture and Natural Resources, 2015) |
Fall 2015 | 3 | 12.5 | 0.6 | County-level |
| 32016 | South Dakota NRCS 2016 lidar (NRCS, 2016) | November 2016–May 2017 | 3 | 15 | 0.6 | County-level |
| 59-mile Missouri National Recreational River segment | ||||||
| 22005 | USACE Missouri River Lidar | 10/28–30/2005 and 11/1–21/2005 | 3 | 15 | 0.22 | River corridor only |
| 22011 | USACE Missouri River Lidar | 11/17/2011–11/24/2011 | 3 | 18.5 | 1 | River corridor only |
| 32012 | Nebraska NRCS Lidar (NRCS, 2012) |
1/25/2012–3/18/2012 | 3 | 18.5 | 1 | County-level |
| 32012 | Eastern South Dakota Lidar (South Dakota Department of Agriculture and Natural Resources, 2012) |
4/3/2012–5/16/2012, 10/20/2012 | 3 | 6.5 | 1 | County-level |
| 2,32014 | USACE Missouri River Lidar | 12/2013–3/2014 | 3 | 12.5 | 0.6 | River corridor only |
Model Data
Water-surface-elevation data simulated from a USACE HEC–RAS one dimensional hydraulic model of discharges downstream from Fort Randall and Gavins Point Dams was used as a consistent elevation for comparisons of cross sections and for flood-plain-inundation modeling (Fischenich and others, 2018; U.S. Army Corps of Engineers, 2018).The USACE HEC–RAS model inputs included cross-section data and water-surface stages from streamgage data simulated during a period of record from 1931 to 2012 (U.S. Army Corps of Engineers, 2018). Model outputs included simulated water-surface elevations and discharges for locations longitudinally along the Missouri River (U.S. Army Corps of Engineers, 2018). In the 39-mile segment downstream from Fort Randall Dam, water-surface elevations were simulated for discharges ranging from 350 to 164,100 ft3/s. Discharges from 9,000 to 160,000 ft3/s were simulated during the same period of record in the 39-mile segment downstream from Gavins Point Dam (U.S. Army Corps of Engineers, 2018).
The simulated water-surface elevations from the HEC–RAS one-dimensional hydraulic model were used to make coarse-scale predictions of flood-plain inundation in both MNRR segments using methods similar to other previous flood-plain inundation index studies on the Missouri River (Jacobson and others, 2007; Jacobson and others, 2011; Chojnacki and others, 2012; Bulliner and others, 2017). Water-surface elevations for target discharges were selected and matched to HEC–RAS cross-sections (table 4). These cross-sections were extended out of the channel and across the flood plain. Water-surface elevations at cross sections were then interpolated to a gridded surface at a scale of 10 m horizontal resolution using a kriging algorithm. Flood-plain land-surface elevations, based on best-available lidar-derived topographic digital elevation model data (table 3), were then subtracted from the water-surface-elevation grids to estimate flooding extent and depths of inundation over the flood plain and valley bottom (table 4).
Table 4.
Model discharges intersected with cross sections and flood-plain lidar to create flood-plain inundation extent models.[ft3/s, cubic feet per second; lidar, light detection and ranging; --, no data; >, greater than. At the time of publication, the USACE data were not publicly available]
The water-surface-elevation grids are subject to multiple sources of uncertainty, and it is therefore appropriate to treat them as relative indicators of inundation extent and depth. One fundamental assumption of the USACE HEC–RAS model is that the channel morphology and roughness conditions are unchanging through time, which is an assumption that is simplistic for an alluvial river. Extrapolation of water-surface elevations beyond the channel can also introduce errors of overprediction. Simulated extent and depth errors were quantified by comparing predicted areas of inundation during the 2011 flood to flood extent polygons mapped independently from aerial imagery by the USACE. In both segments, modeled inundation had 99-percent area in common with inundated areas mapped from imagery (table 5, fig. 4). The modeled inundation overpredicted flood inundation extent beyond the USACE- mapped 2011 flood extent by 7 percent in the 39-mile segment and 8 percent in the 59-mile segment (table 5, fig. 4). HEC–RAS water surfaces intersected with flood-plain lidar provide a good estimate for the inundation extent of the 2011 flood.
Table 5.
Comparison of inundation flood-plain modeling with the estimated extent from aerial photography of the 2011 flood.[USACE, U.S. Army Corps of Engineers]
Channel Geometry Data
The USACE has surveyed river topography along systematically spaced transect lines aligned perpendicular to the channel (often described as sedimentation ranges) in Missouri River segments downstream from large main-stem reservoirs at least once a decade since the 1950s. Cross-section datasets provide a record of changes in channel geometry over time, including narrowing through deposition, and elevation changes caused by bed incision and aggradation. Cross-sections were surveyed by contractors using methods that have changed as survey technology has evolved; limited metadata exist for older surveys (West Consultants Inc., 2002).
Cross-section data for the MNRR segments from 1955 to 2011 were furnished by the USACE, Omaha District, in a database format (at the time of publication, the USACE cross section and HEC–RAS modeling data were not publicly available from U.S. Army Corps of Engineers). These cross sections are spaced an average of 2 km from the tailwater of the dam to thorough Lewis and Clark Lake; cross-section spacing is closer near Fort Randall Dam and around major tributaries and spaced farther in the reservoir (fig. 5; table 6). The 39-mile segment, Lewis and Clark Lake Delta, and Lewis and Clark Lake database consists of 52 cross sections over 8 time periods, totaling 402 total cross sections from 1955 to 2011 (fig. 5; table 6). In the 59-mile segment, 42 cross sections were surveyed 10–11 times between 1955 and 2011 (fig. 6A; table 6). These cross sections are also spaced an average of 2 km apart, with closer spacing near the dam. The 59-mile segment cross-section database consists of 12 surveys of 42 cross sections with a total of 469 individual cross sections from 1955 to 2013 (table 6).
Table 6.
U.S. Army Corps of Engineers Missouri National Recreational River sedimentation and aggradation range cross sections and survey dates used in this study.[MM, month; DD, day]
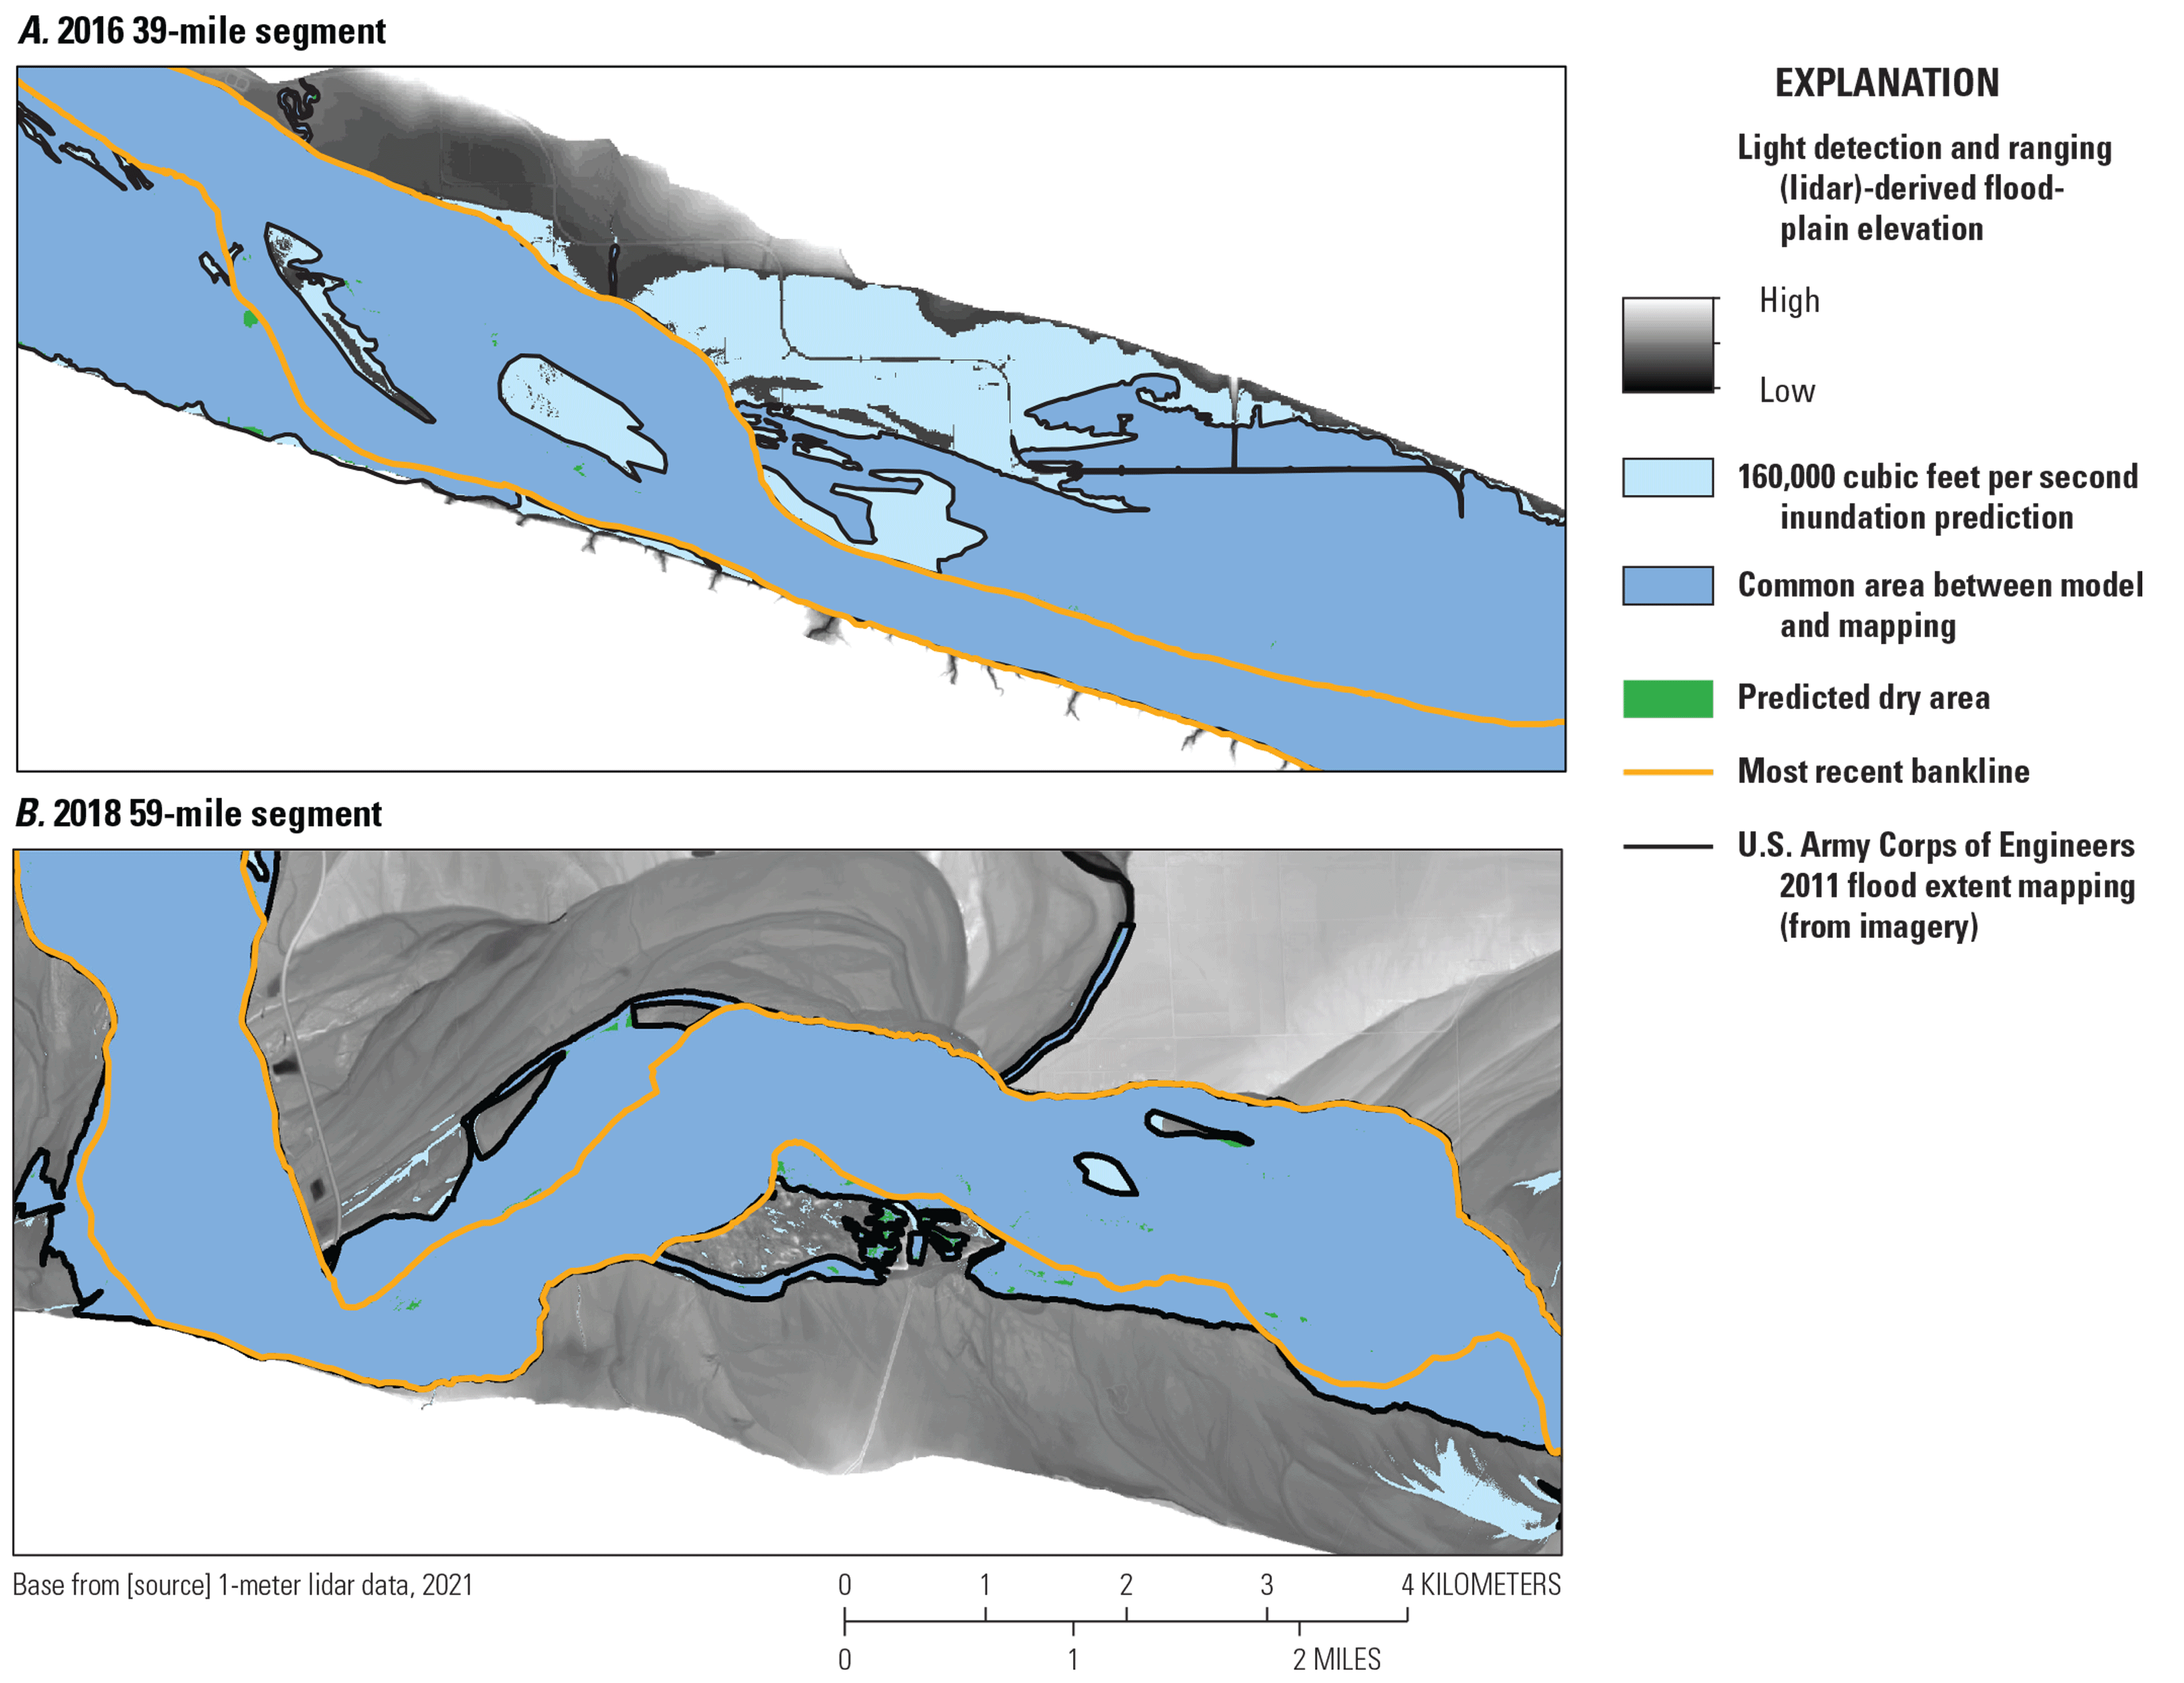
Examples of flood-plain inundation percent comparison for segments of the Missouri National Recreational River. A, 39-mile segment. B, 59-mile segment.
Cross-section locations in the 39-mile segment of the Missouri National Recreational River.
Cross-section locations (Elliott, 2022) of the Missouri National Recreational River. A, 59-mile segment. B, Example of the 2013 U.S. Army Corps of Engineers bathymetric mapping and historic cross sections.
In 2013, a bathymetric and sandbar survey was conducted in the channel of the 59-mile segment for the USACE. This survey had a 305-m cross-section spacing (fig. 6B), but the cross sections were not aligned with historical USACE cross sections and, thus, data did not allow for direct comparison (fig. 6B) with previous studies. Of the cross sections from 2013, 14 aligned sufficiently well with the historic cross sections and were used in the analysis, which allowed bed-elevation trends in the 59-mile segment following the historic 2011 flood to be quantified; a comparable 2013 survey was not available in the 39-mile segment.
Analysis of Channel Geometry
Cross sections were analyzed using the Cross-Section Viewer, which is a database-driven software tool for storage, visualization, comparison, and analysis of channel topographic cross sections (Shelley and Bailey, 2018; Gibson and Shelley, 2020). A consistent high-flow water-surface datum of stages equivalent to 160,000 ft3/s, or the 2011 peak flow, was used to compare cross-sectional areas between time periods and to calculate areas of deposition and erosion in cross sections in both MNRR segments. The 160,000-ft3/s water-surface-elevation datum was extracted from the USACE HEC–RAS model (Fischenich and others, 2018). A datum representing median discharge (30,000 ft3/s) was also added to the database for visual reference (table 4). Cross-section change was calculated for the common lateral extent between paired sets of surveys. In the 39-mile segment, paired surveys were 1955 and 1960, 1960 and 1970, 1970 and 1975, 1975 and 1985, 1985 and 1995, 1995 and 2007, and 2007 and 2011. In the 59-mile segment surveys pairs were 1955 and 1960, 1960 and 1965, 1965 and 1970, 1970 and 1974, 1974 and 1980, 1980 and 1986, 1986 and 1994, 1994 and 2002, 2002 and 2007, and 2007 and 2011. The 2011 cross sections were collected in October and November after the high-flow event had ended (table 6); the most recent surveyed time period, 2007 and 2011, includes deposition and erosion associated with the 2011 flood event. The Cross-Section Viewer was also used to calculate the thalweg elevation (defined in this report as the point of lowest elevation in the channel topography at a cross section) for each cross section to quantify channel deepening trends over time.
Longitudinal cumulative volume-change curves were calculated using the Cross-Section Viewer using pairs of cross sections over time to visualize bed-material volume change and spatial rates of change through space (Gibson and Shelley, 2020). This calculation dampens the effect of individual cross sections to favor large-scale spatial trends (Gibson and Shelley, 2020). The Cross-Section Viewer calculates a longitudinal cumulative volume curve by automatically identifying cross sections at the same location between two surveys, trimming them to common lateral extent, computing the difference in area between two time periods, and calculating volume change as the product of the average area change and longitudinal distance between the two cross sections (Gibson and Shelley, 2020).
Cross sections were not always surveyed to the same lateral extent each year, and the Cross-Section Viewer software does not produce metrics for changes in channel width since dam closure. Channel width changes were assessed in the river process domain of the 39-mile segment and in the 59-mile segment through plotting and visual evaluation of the edge of the high banks at four time periods: 1955, 1975 (1974 in the 59-mile segment), 1995 (1994 in the 59-mile segment), and 2011. Width decreases greater than 5 m were classified as channel narrowing, width changes between −5 m and 5 m were classified as indeterminate, and changes greater than 5 m were classified as channel widening.
Aerial Photography
Aerial photography (National Aerial Imagery Program, 2022) was used to map locations of channel banklines from 1941 to 2018, which were subsequently used to quantify changes in channel location and planform in both MNRR segments (table 7). Metadata for aerial photography, including dates or ranges of dates of photograph acquisition, are crucial for determining the discharge of the river, which affects exposure of within-channel features and subsequent derived metrics of channel morphology. Elliott and Jacobson (2006) assembled aerial photography from the USGS, USACE, and the USDA ranging from 1941 to 2004. These datasets were added to aerial photography from the USDA National Aerial Imagery Program (National Aerial Imagery Program, 2022) taken between 2005 and 2018 (table 7). In years when South Dakota and Nebraska were both photographed (2005, 2006, 2010, 2012, 2014, 2016, and 2018), surveys for each State were flown at different dates, resulting in some cases with imagery taken across a wider range of dates and river discharges (table 7).
Table 7.
Digital aerial photography for the 39-mile and 59-mile Missouri National Recreational River segments.[ft3/s, cubic feet per second; USGS, U.S. Geological Survey; USACE, U.S. Army Corps of Engineers; NAIP/FSA, U.S. Department of Agriculture, National Aerial Imagery Program, Farm Service Agency; SDGS, South Dakota Geological Survey; --, no data. At the time of publication, the USACE, SDGS, and U.S. National Archive data were not publicly available]
| Photograph series | Type | Year | Dates | Source/citation | Discharge range (ft3/s) |
Daily flow exceedance (percent) |
|---|---|---|---|---|---|---|
| 39-mile Missouri National Recreational River segment1 | ||||||
| USGS digital ortho quarter quadrangle | Black and white | 1993 | Vary | USGS, 2022 | 3,200–17,300 | 99–69 |
| USACE Fort Randall to Springfield | Color infrared | 1998 | 5/3, 5/4 | USACE | 18,400–18,500 | 66–66 |
| USGS digital ortho quarter quadrangle | Black and white | 1999 | vary | USGS, 2022 | 15,500–26,800 | 74–41 |
| USACE Fort Randall to Springfield | Color infrared | 1999 | 6/17 | USACE | 24,000 | 50 |
| NAIP county level | True color | 2003 | 6/03, 9/03 | NAIP, 2022 | 24,700–31,300 | 48–26 |
| NAIP county level | True color | 2004 | Vary | NAIP, 2022 | 26,800–33,400 | 41–20 |
| NAIP Nebraska, county level | True color | 2005 | 7/1, 7/2, 7/5, 7/7 | NAIP, 2022 | 18,800–20,000 | 65–62 |
| NAIP South Dakota, county level | True color | 2005 | 7/5, 7/7, 7/9, 7/10, 7/27 | NAIP, 2022 | 18,500–20,500 | 66–57 |
| NAIP Nebraska, county level | True color | 2006 | 7/23, 7/29, 7/30 | NAIP, 2022 | 28,200–31,600 | 35–25 |
| NAIP South Dakota, county level | True color | 2006 | 7/12, 7/15, 7/18 | NAIP, 2022 | 23,900–25,300 | 51–46 |
| NAIP Nebraska, county level | True color | 2007 | 7/7, 7/14, 7/16, 7/17 | NAIP, 2022 | 21,000–22,700 | 59–54 |
| NAIP South Dakota, county level | True color | 2008 | 7/12, 7/13 | NAIP, 2022 | 13,200–13,700 | 82–81 |
| NAIP Nebraska, county level | True color | 2009 | 6/23, 6/30, 7/18 | NAIP, 2022 | 22,900–25,200 | 54–47 |
| NAIP Nebraska, county level | True color | 2010 | 7/1, 7/2 | NAIP, 2022 | 34,600–34,900 | 18–18 |
| NAIP South Dakota, county level | True color | 2010 | 8/7, 8/13, 8/14 | NAIP, 2022 | 37,900–38,100 | 14–14 |
| NAIP Nebraska, county level | True color | 2012 | 7/3, 7/9 | NAIP, 2022 | 30,500–31,000 | 28–26 |
| NAIP South Dakota, county level | True color | 2012 | 7/9, 7/14 | NAIP, 2022 | 31,000–33,000 | 26–21 |
| NAIP Nebraska, county level | True color | 2014 | 9/6, 9/7, 9/8, 9/13, 9/15 | NAIP, 2022 | 26,800–28,000 | 41–36 |
| NAIP South Dakota, county level | True color | 2014 | 9/6, 9/8 | NAIP, 2022 | 44,100–45,200 | 10–9 |
| NAIP Nebraska, county level | True color | 2016 | 8/13, 8/14, 9/8 | NAIP, 2022 | 19,500–24,300 | 63–50 |
| NAIP South Dakota, county level | True color | 2016 | 9/17 | NAIP, 2022 | 17,500–21,800 | 68–57 |
| NAIP Nebraska, county level | True color / color infrared | 2018 | 7/20, 7/23, 7/31, 8/29, 9/11, 9/12, 9/22, 9/26, 10/3 | NAIP, 2022 | 39,500–56,300 | 13–3 |
| NAIP South Dakota, county level | True color / color infrared | 2018 | 9/15 | NAIP, 2022 | 56,300 | 3 |
| 59-mile Missouri National Recreational River segment2 | ||||||
| Historical aerial photography | Black and white | 1941 | August–October | SDGS/USACE | 19,400–36,700 | 70–14 |
| Gavins to Ponca3 | Black and white | 1953 | August–September | U.S. National Archives | -- | -- |
| Gavins to Ponca3 | Black and white | 1956 | 6/9, 6/10, 6/24 | U.S. National Archives | 28,600–29,200 | 40–37 |
| Gavins to Ponca3 | Black and white | 1960s | 4/25/1966, 4/7/1967, 6/19/1968 | U.S. National Archives | 29,000–34,000 | 38–20 |
| Gavins to Ponca | Color infrared | 1984 | 5/18, 5/23, 5/24, 5/25, 10/24, 11/1 | USGS, 2022 | 28,700–49,200 | 40–6 |
| USGS digital ortho quarter quadrang | Black and white | 1993 | Vary | USGS, 2022 | 10,600–11,700 | 91–89 |
| Gavins to Ponca | Color infrared | 1996 | 6/4 | USACE | 48,000 | 6 |
| Gavins to Sioux City1 | True color | 1997 | 8/5, 8/8 | USACE | 63,400–65,800 | 2–2 |
| Gavins to Ponca | Color infrared | 1998 | 5/4 | USACE | 32,600 | 24–100 |
| USGS digital ortho quarter quadrangle | Black and white | 1999 | Vary | USGS, 2022 | 30,000–37,000 | 35–14 |
| Gavins to Sioux City | Color infrared | 1999 | 6/16, 7/7 | USACE | 40,900–49,600 | 11–11 |
| Gavins to Ponca | True color | 2001 | 10/11 | USACE | 28,900 | 49 |
| NAIP county-level | True color | 2003 | 6/03, 9/03 | NAIP, 2022 | 27,100–35,000 | 46–17 |
| NAIP county-level | True color | 2004 | Vary | NAIP, 2022 | 26,800–31,400 | 48–28 |
| NAIP Nebraska, county level | True color | 2005 | 7/10, 7/11, 8/6, 8/8, 8/9 | NAIP, 2022 | 21,000–23,000 | 65–59 |
| NAIP South Dakota, county level | True color | 2005 | 7/9, 7/10 | NAIP, 2022 | 21,000 | 65–100 |
| NAIP Nebraska, county level | True color | 2006 | 7/19, 7/22, 7/23, 7/26, 7/31 | NAIP, 2022 | 25,000–31,300 | 53–28 |
| NAIP South Dakota, county level | True color | 2006 | 7/15 | NAIP, 2022 | 25,500 | 51 |
| NAIP Nebraska, county level | True color | 2007 | 7/8, 7/13, 7/15-7/17 | NAIP, 2022 | 21,000 | 65 |
| NAIP South Dakota, county level | True color | 2008 | 7/13, 7/14, 7/22, 7/31, 8/1 | NAIP, 2022 | 14,000–19,000 | 85–70 |
| NAIP Nebraska, county level | True color | 2009 | 6/30, 7/1, 7/5, 7/6 | NAIP, 2022 | 27,000–27,500 | 47–45 |
| NAIP South Dakota, county level | True color | 2010 | 8/11, 8/12, 8/14, 8/15, 8/21 | NAIP, 2022 | 41,100–41,900 | 10–10 |
| NAIP Nebraska, county level | True color | 2012 | 7/3, 7/9 | NAIP, 2022 | 31,800–33,004 | 28–23 |
| NAIP South Dakota, county level | True color | 2012 | 7/11, 7/14, 7/29 | NAIP, 2022 | 34,200–35,100 | 20–16 |
| NAIP Nebraska, county level | True color | 2014 | 9/7, 9/16, 9/17 | NAIP, 2022 | 43,300–45,400 | 9–8 |
| NAIP South Dakota, county level | True color | 2014 | 9/7, 9/26, 10/7 | NAIP, 2022 | 28,400–45,500 | 41–8 |
| NAIP Nebraska, county level | True color | 2016 | 8/13, 8/14, 9/8 | NAIP, 2022 | 26,900–27,700 | 47–44 |
| NAIP South Dakota, county level | True color | 2016 | 9/11, 9/26 | NAIP, 2022 | 25,000–25,400 | 53–51 |
| NAIP Nebraska, county level | True color / color infrared | 2018 | 7/6, 7/11, 8/29, 9/12 | NAIP, 2022 | 62,800–68,600 | 2–2 |
| NAIP South Dakota, county level | True color / color infrared | 2018 | 9/11, 9/12, 9/15, 9/22 | NAIP, 2022 | 62,900–90,600 | 2–1 |
Discharge and daily flow exceedance for the 39-mile segment from U.S. Army Corps of Engineers release records from Fort Randall Dam, 1967–2019.
Older historical georeferenced aerial photography was obtained for the 59-mile segment from the South Dakota Geological Survey (SDGS); USGS (USGS, 2022); and the National Archives (table 7; at the time of publication, the SDGS and U.S. National Archive data were not publicly available). The historic aerial photography from the 1950s and 1960s was used in combination with cross-section data surveyed in 1955 to interpret the location of the banks when the dam closed and to determine pre-dam and post-dam flood-plain surfaces.
Channel and Valley Constraints
Alluvial rivers adjust their size, shape, and location in a valley bottom to balance sediment loads and water discharges. Constraints on channel migration include bedrock valley walls, bank revetments such as wood and rocks placed on banks, hard structures including dikes and bridges, and cohesive surficial deposits exposed when the channel erodes into its flood plain. Some of these constraints are more persistent in the landscape, such as bedrock, whereas others, such as revetments, could be undermined to expose banks to erosion. Locations of the valley wall and bank revetments mapped by Elliott and Jacobson (2006) were used in the study. Bank revetments from these maps include the locations of extensive bank-protection structures that were visible from aerial photography at the time. More recent and smaller (generally less than 20 m in length) bank-protection structures were not added to this dataset.
Available surficial geologic mapping was compiled to map locations of cohesive flood-plain deposits, which are potentially more resistant to erosion and might slow lateral channel migration. There is only a small area of surficial geologic mapping available for the 39-mile segment published by the Nebraska Conservation and Survey Division and the University of Nebraska (Dillon and others, 2009; Joeckel and others, 2011; Joeckel and others, 2013). In the 59-mile segment, data from two surficial flood-plain mapping efforts were assembled: one published by the SDGS that covers most of the associated quadrangles (Alexandrowicz and others, 2011; Brown and others, 2011; Emenhiser and others, 2011; Garrett and others, 2011; Moreno and others, 2011a; Moreno and others, 2011b; Moreno and others, 2011d, c; Radakovich and others, 2011; Reed and others, 2011), and one that covers the entire Missouri River flood plain (Lundstrom and others, 2022).
Bankline Delineation
Mapping channel boundaries, or banklines, through time provides a record of channel locations and rates and areas of high and low bank erosion. Banklines were digitized from aerial photography between 2005 and 2018 using methods similar to Elliott and Jacobson (2006; tables 7–8). Bankline delineations were based on sharp topographic breaks at the top of the banks to capture normalized bankfull dimensions and to minimize the effects of varying water levels. These bankline datasets supplement banklines digitized for various years from 1993 to 2004 by Elliott and Jacobson (2006). Because of low bank-erosion rates in the 39-mile segment, only 2016 was digitized, resulting in four documented banklines for the 1993–2018 time period (table 8). In the 59-mile reach where bank-erosion rates are higher, eight banklines were available from Elliott and Jacobson (2006) from 1993 to 2004 and 10 additional banklines from 2005 to 2018 were digitized for this study (table 8).
Table 8.
Banklines digitized for the Missouri National Recreational River segments.[N/A, not available; MNRR, Missouri National Recreational River, SDGS, South Dakota Geological Survey; USACE, U.S. Army Corps of Engineers; USGS; U.S. Geological Survey; NAIP/FSA, U.S. Department of Agriculture National Aerial Imagery Program, Farm Service Agency; --, no data]
| Year | Source | Dates | Discharge range (ft3/s) |
Segment | Source |
|---|---|---|---|---|---|
| 1894 | Missouri River Commission Maps | N/A | N/A | Both MNRR segments | Elliott and Jacobson, 2006 |
| 1941 | SDGS/USACE Black and White Aerial Photography | August-October | 19,400–36,700 | 59-mile segment only | Elliott and Jacobson, 2006 |
| 1949 | USACE Topographic Map Series | 1949 | N/A | 39-mile segment only | Elliott, 2022 |
| 1953 | U.S. National Archives Black and White Aerial Photography | August-September | -- | 59-mile segment only | Elliott, 2022 |
| 1956 | U.S. National Archives Black and White Aerial Photography | 6/9, 6/10, 6/24 | 28,600–29,200 | 59-mile segment only | Elliott, 2022 |
| 1960s | U.S. National Archives Black and White Aerial Photography | 4/25/1966, 4/7/1967, 6/19/1968 | 29,000–34,000 | 59-mile segment only | Elliott, 2022 |
| 1984 | USGS Color Infrared Photography | 5/18, 5/23, 5/24-25, 10/24, 11/1 | 28,700–49,200 | 59-mile segment only | Elliott, 2022 |
| 1993 | USGS Black and White Digital Ortho Quarter Quadrangle | vary | 10,600–11,700 | Both MNRR segments | Elliott and Jacobson, 2006 |
| 1996 | USACE Color Infrared Aerial Photography | 6/4 | 48,000 | 59-mile segment only | Elliott and Jacobson, 2006 |
| 1997 | USACE True Color Aerial Photography | 8/5, 8/8 | 63,400–65,800 | 59-mile segment only | Elliott and Jacobson, 2006 |
| 1998 | USACE Color Infrared Aerial Photography | 5/4 | 32,600 | 59-mile segment only | Elliott and Jacobson, 2006 |
| 1999 | USACE Color Infrared Aerial Photography | 6/16, 7/7 | 40,900–49,600 | Both MNRR segments | Elliott and Jacobson, 2006 |
| 2001 | USACE True Color Aerial Photography | 10/11 | 28,900 | 59-mile segment only | Elliott and Jacobson, 2006 |
| 2003 | NAIP/FSA True Color Aerial Photography | 6/03, 9/03 | 27,100–35,000 | Both MNRR segments | Elliott and Jacobson, 2006 |
| 2004 | NAIP/FSA True Color Aerial Photography | vary | 26,800–31,400 | 59-mile segment only | Elliott and Jacobson, 2006 |
| 2005 | NAIP/FSA South Dakota True Color Aerial Photography | 7/9/2010 | 21,000 | 59-mile segment only | Elliott, 2022 |
| 2006 | NAIP/FSA South Dakota True Color Aerial Photography | 7/15 | 25,500 | 59-mile segment only | Elliott, 2022 |
| 2007 | NAIP/FSA Nebraska True Color Aerial Photography | 7/8, 7/13, 7/15-17 | 21,000 | 59-mile segment only | Elliott, 2022 |
| 2008 | NAIP/FSA South Dakota True Color Aerial Photography | 7/13-14, 7/22, 7/31, 8/1 | 14,000–19,000 | 59-mile segment only | Elliott, 2022 |
| 2009 | NAIP/FSA Nebraska True Color Aerial Photography | 6/30, 7/1, 7/5-6 | 27,000–27,500 | 59-mile segment only | Elliott, 2022 |
| 2010 | NAIP/FSA South Dakota True Color Aerial Photography | 8/11-12, 8/14, 8/15, 8/21 | 41,100–41,900 | 59-mile segment only | Elliott, 2022 |
| 2012 | NAIP/FSA South Dakota True Color Aerial Photography | 7/11, 7/14, 7/29 | 34,200–35,100 | 59-mile segment only | Elliott, 2022 |
| 2014 | NAIP/FSA Nebraska True Color Aerial Photography | 9/7, 9/16-17 | 43,300–45,400 | 59-mile segment only | Elliott, 2022 |
| 2016 | NAIP/FSA South Dakota True Color Aerial Photography | 9/11, 9/17, 9/26 | 25,000–25,400 | Both MNRR segments | Elliott, 2022 |
| 2018 | NAIP/FSA Nebraska True Color Aerial Photography | 7/6, 7/11, 8/29, 9/12 | 62,800–68,600 | 59-mile segment only | Elliott, 2022 |
Banklines from the 1890s Missouri River Commission Maps, digitized by Elliott and Jacobson (2006), were used to establish channel positions from 1894 for both MNRR river segments (Missouri River Commission, 1895). Banklines from 1949 in the 39-mile segment were digitized from USACE topographic maps and provide a record of channel and bank positions during the time of dam construction and closure (U.S. Army Corps of Engineers, 1949). Banklines mapped from georeferenced aerial photographs for 1941, 1953, 1956, the 1960s, and 1984 in the 59-mile segment were furnished by the University of South Dakota and the SDGS (table 7). Positional accuracy of mapped banklines determined from furnished data was assumed to be the same as those reported by Elliott and Jacobson (2006), which is approximately 3 m.
Channel-Migration Zone Delineation
An entirely empirical approach to prediction of channel migration was used in this study, as tracked by bankline movement through time, to avoid extensive and complex model parameterization. The channel-migration zone was compiled using historic banklines, locations of constraints, simulated and mapped high-flow inundation data, and bankline predictions. Because the methods sought to determine the location of the high banks through time for a highly incised river, bank retreat was the focus rather than bar or flood-plain accretion.
The USGS Digital Shoreline Analysis Software (DSAS) version 5 was used to quantify bank-erosion rates, to predict the potential extent of future bank erosion within the Esri ArcGIS environment, and was developed to quantify rates of coastal shoreline change over time (Himmelstoss and others, 2018a, 2018b49). The DSAS software has been applied on rivers to quantify rates of bank change, to predict future erosion based on empirical data from past rates, and to delineate channel-migration zones (Curran and McTeague, 2011; Biron and others, 2014). The DSAS software generates cross sections from a baseline at a user-defined spacing and measures lateral bank changes at each cross section as the distance between banklines (fig. 7A). For this analysis, a baseline was generated 50 m away from the 1993 bankline and a cross-section spacing of 100 m was specified (fig. 7A). Based on an accuracy assessment by Elliott and Jacobson (2006), a threshold of accuracy of plus or minus 3 m was used as an estimate of image accuracy for the 1993 to 2018 channel banklines.
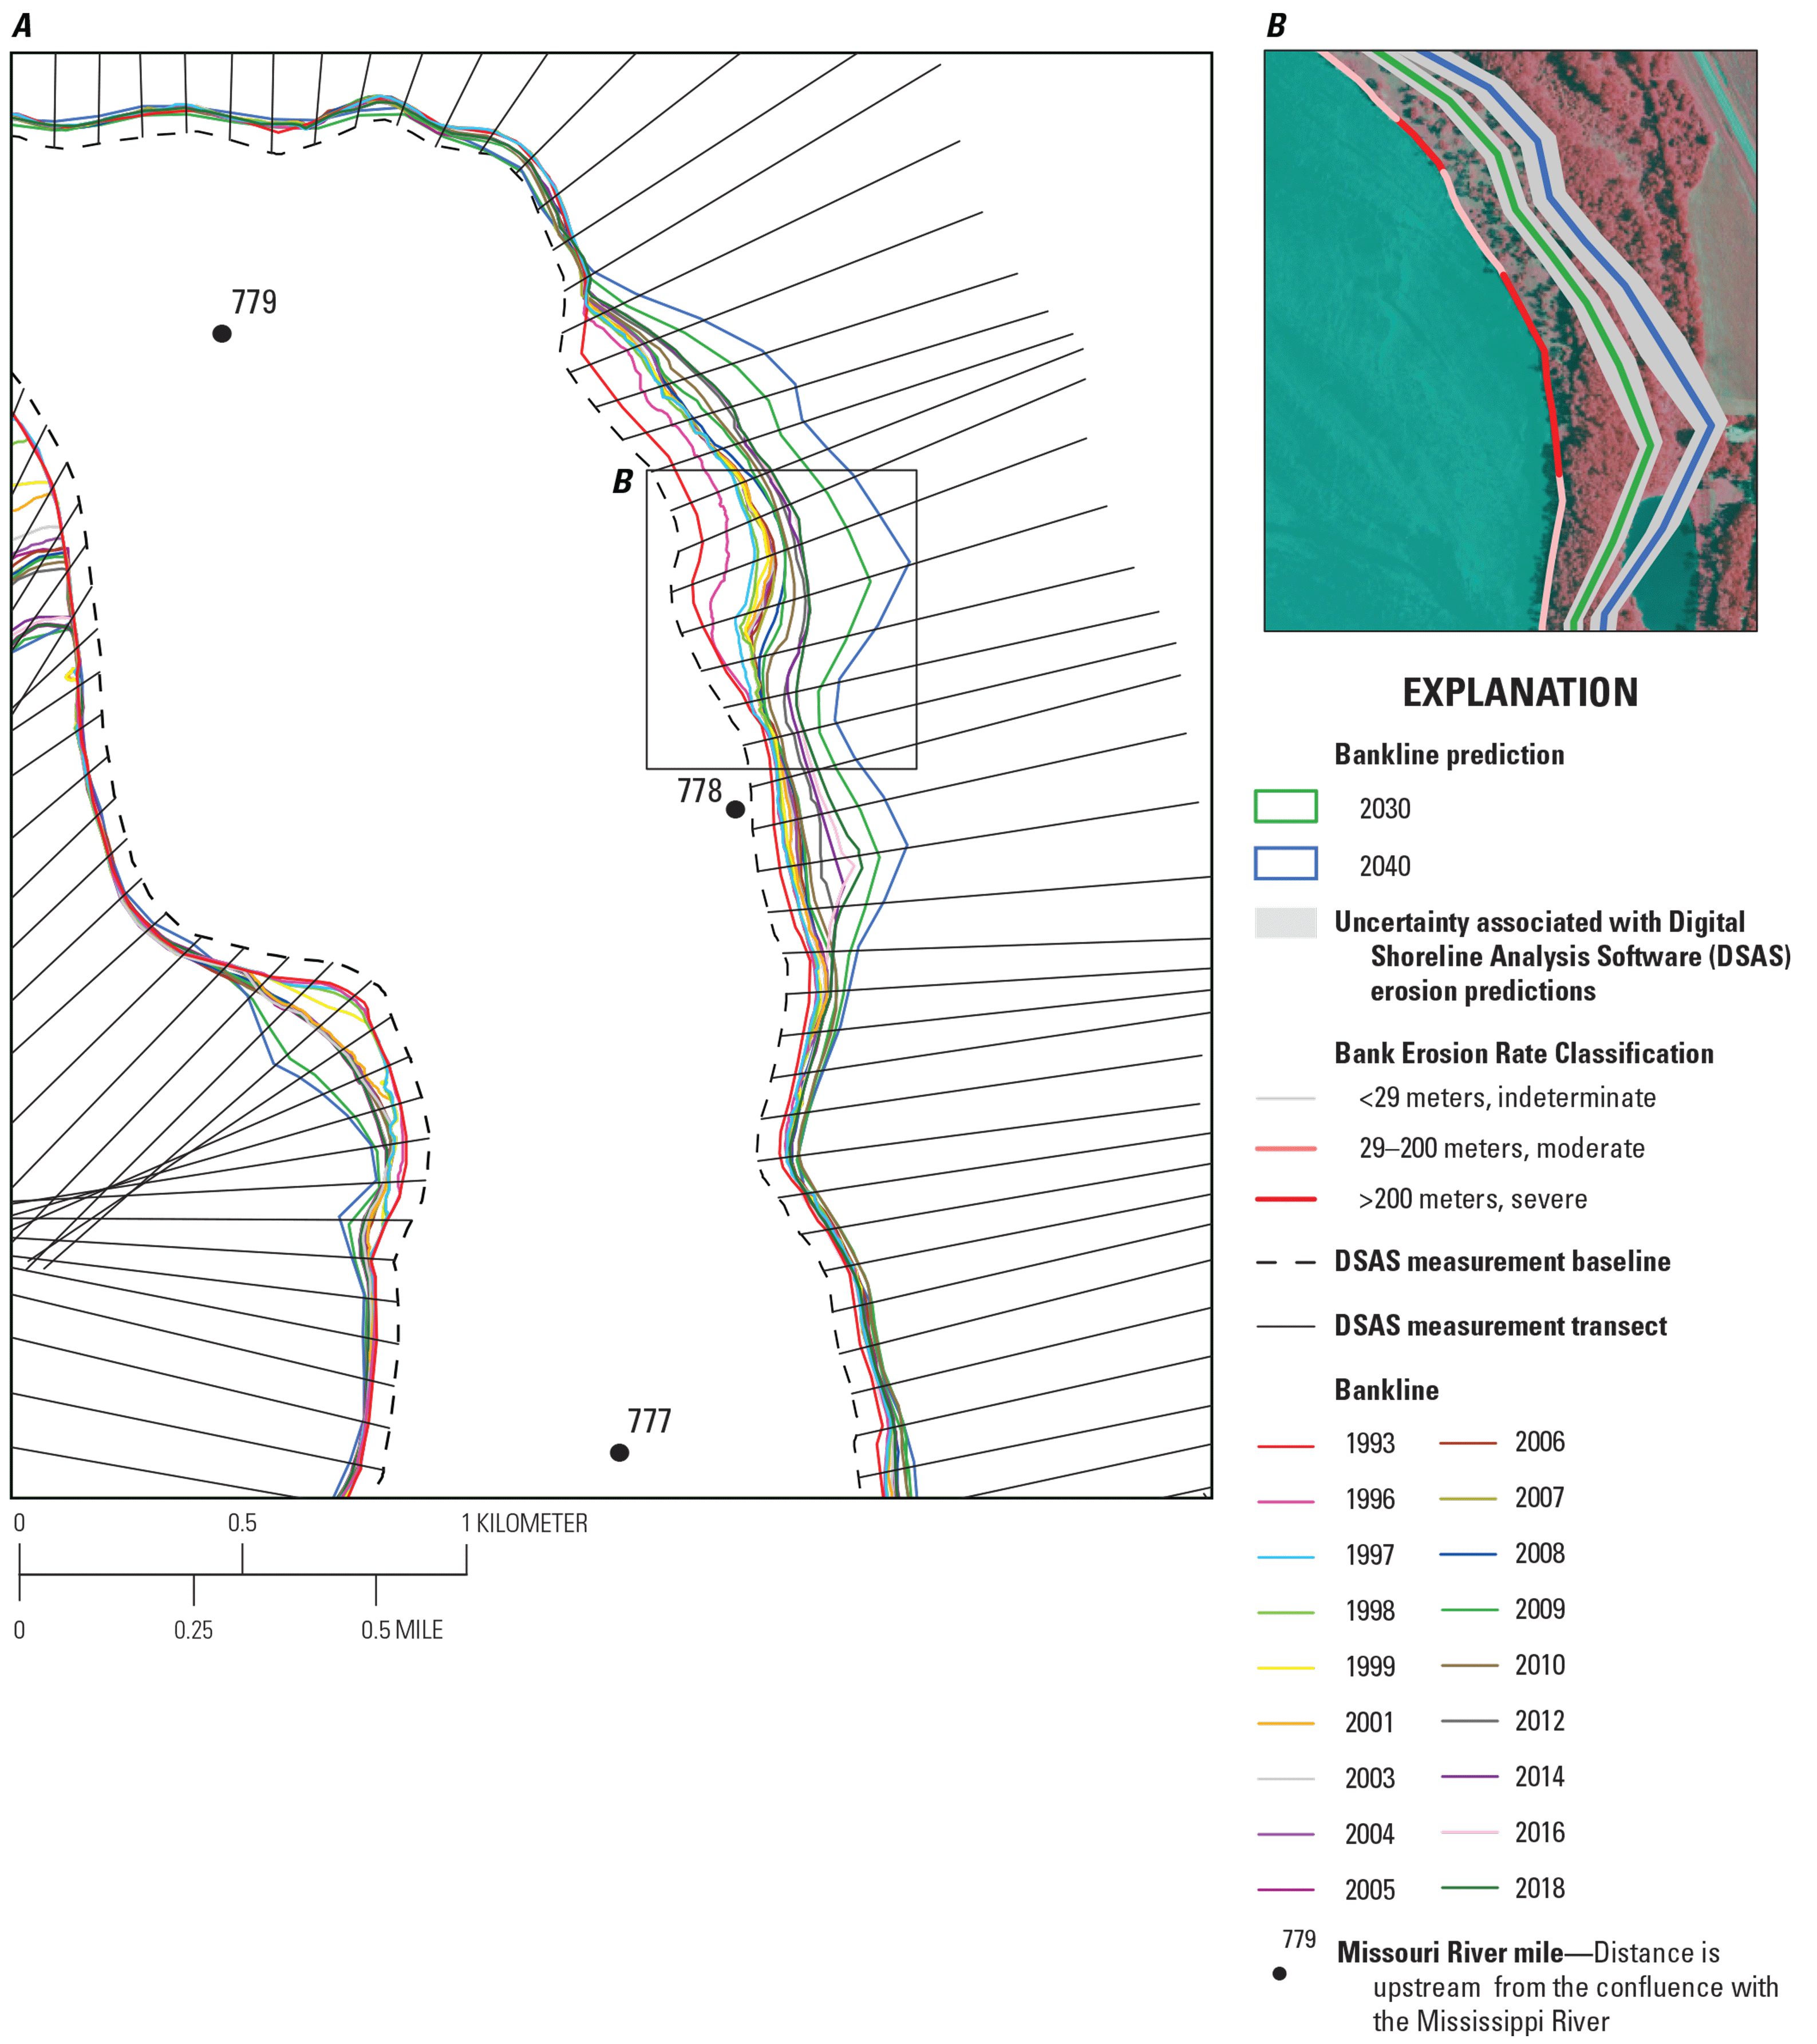
Example of bankline movement in the 59-mile segment of the Missouri National Recreational River. A, Measurements from the U.S. Geological Survey (USGS) Digital Shoreline Analysis Software (DSAS). B, Predictions from the USGS DSAS.
The DSAS software was used to calculate several bankline change statistics: net shoreline movement, which is the migration distance between the 1993 and most recent banklines (2016 or 2018, depending on river segment); the shoreline change envelope, which is the total change between all banklines; and the end point rate, which is produced by dividing net shoreline movement by the span of years in the dataset. Extents of bankline migrations predicted using the DSAS software were converted to shapefiles and are available in the USGS data release (Elliott, 2022).
Bank-erosion rates quantified by the DSAS banks in both segments were grouped into three classes: indeterminate, moderate erosion, and severe erosion (fig. 7B). Classes were determined by comparing calculated movement rates for banks with revetments and unprotected banks. Banks with revetments would be expected to have lower bank-erosion rates, although some bank erosion does occur in some styles of bank revetment in the MNRR. Of the cross sections that intersected revetted banks, 95 percent had a net shoreline movement less than 29 m from 1993 to 2018, or 1.2 meters per year (m/yr), which was used as the threshold for detection of bank movement (fig. 7B). This is a conservative estimate of erosion detection because, in some cases, revetments are made of hard points with unprotected bank segments between them that tend to erode in a “scallop” pattern between hard points. Given the multiple sources of photography and digitized banklines, multiple sources of error were assumed and bank erosion was classified conservatively. The 95th percentile net shoreline movement from 1993 to 2018 for unprotected banks was 200 m, or 12 m/yr; this percentile was chosen as the threshold between moderate erosion and severe erosion classes (fig. 7B).
DSAS software forecasts bank migration rates using linear regressions from historical bankline movement. The linear regression rate in the DSAS software was determined by fitting a least-squares regression line to all shoreline positions at each cross-section location. The DSAS software uses a Kalman (Kalman, 1960) filter based on the linear regression rate for each cross section to model future shoreline positions (Long and Plant, 2012). Forecasts for the MNRR were developed for 10 and 20 years in the future from the date the software was run, which corresponds to 2030 and 2040 (fig. 7). Bank-position forecasts include places with revetment and bedrock, but these banks have been mostly stable in the past, and any predicted movement is within the range of forecasted uncertainty. DSAS shoreline forecast uncertainty is based on the uncertainty calculations of past bank positions, which is based on the uncertainty of a regionally averaged change rate (more details on uncertainty calculations in Himmelstoss and others, 2018b). Bank-erosion hotspots were identified by intersecting the 1993 and 2018 banklines in the 59-mile segment, which produced polygons where the bank was eroded during that time. Upon visual examination, digitizing errors and imagery registration errors were likely responsible for small differences between banklines. These polygon areas were eliminated and polygons with larger areas (greater than 5,000 square meters [m2]) were identified as hotspots.
Results
Analysis of time-series channel cross sections, aerial photography, and modeled flood inundation levels indicates that the 39-mile and 59-mile segments of the MNRR have undergone substantial geomorphic changes in the past century, especially in the decades since closure of upstream dams. Since dam closure, the river process domains in both segments have incised and bed and bank-erosion rates have slowed, which have subsequently led to a decrease in channel-migration rates. Key data generated from the analyses of this study are listed in appendix 1 and available as a data release associated with this report (Elliott, 2022).
Changes in Channel Geometry
Analysis of cross sections quantifies changes in channel geometry in the 39-mile and 59-mile segments of the MNRR from since dam closure. There is variability within river segments over time, and the effects of large floods have altered general trends in channel change. In general, long-term trends vary by the three types of Missouri River process domains: riverine, delta, and reservoir.
Trends in Channel Geometry
Erosional processes have dominated since dam closure in the riverine process domains of the MNRR; the delta has experienced a mix erosion and deposition, and deposition has been the main process in Lewis and Clark Lake. Channel capacity, as measured in net cross-section area, has increased in the river process domain of the 39-mile segment and the entire 59-mile segment and decreased in the Lewis and Clark Delta and reservoir from 1955 to 2011 (fig. 8A). Although individual cross sections show substantial variability, overall trends are consistent among the river segments, the delta, and the reservoir (figs. 9–18, tables 9, 10).
Table 9.
Areas of deposition and erosion for U.S. Army Corps of Engineers cross sections in the Missouri National Recreational River and adjacent river segments.[—Left][m2, square meter; m2/yr, square meter per year]
Table 9.
Areas of deposition and erosion for U.S. Army Corps of Engineers cross sections in the Missouri National Recreational River and adjacent river segments.[—Right][m2, square meter; m2/yr, square meter per year]
Table 10.
Percent of Missouri National Recreational River cross sections with depositional and erosional trends for each time period.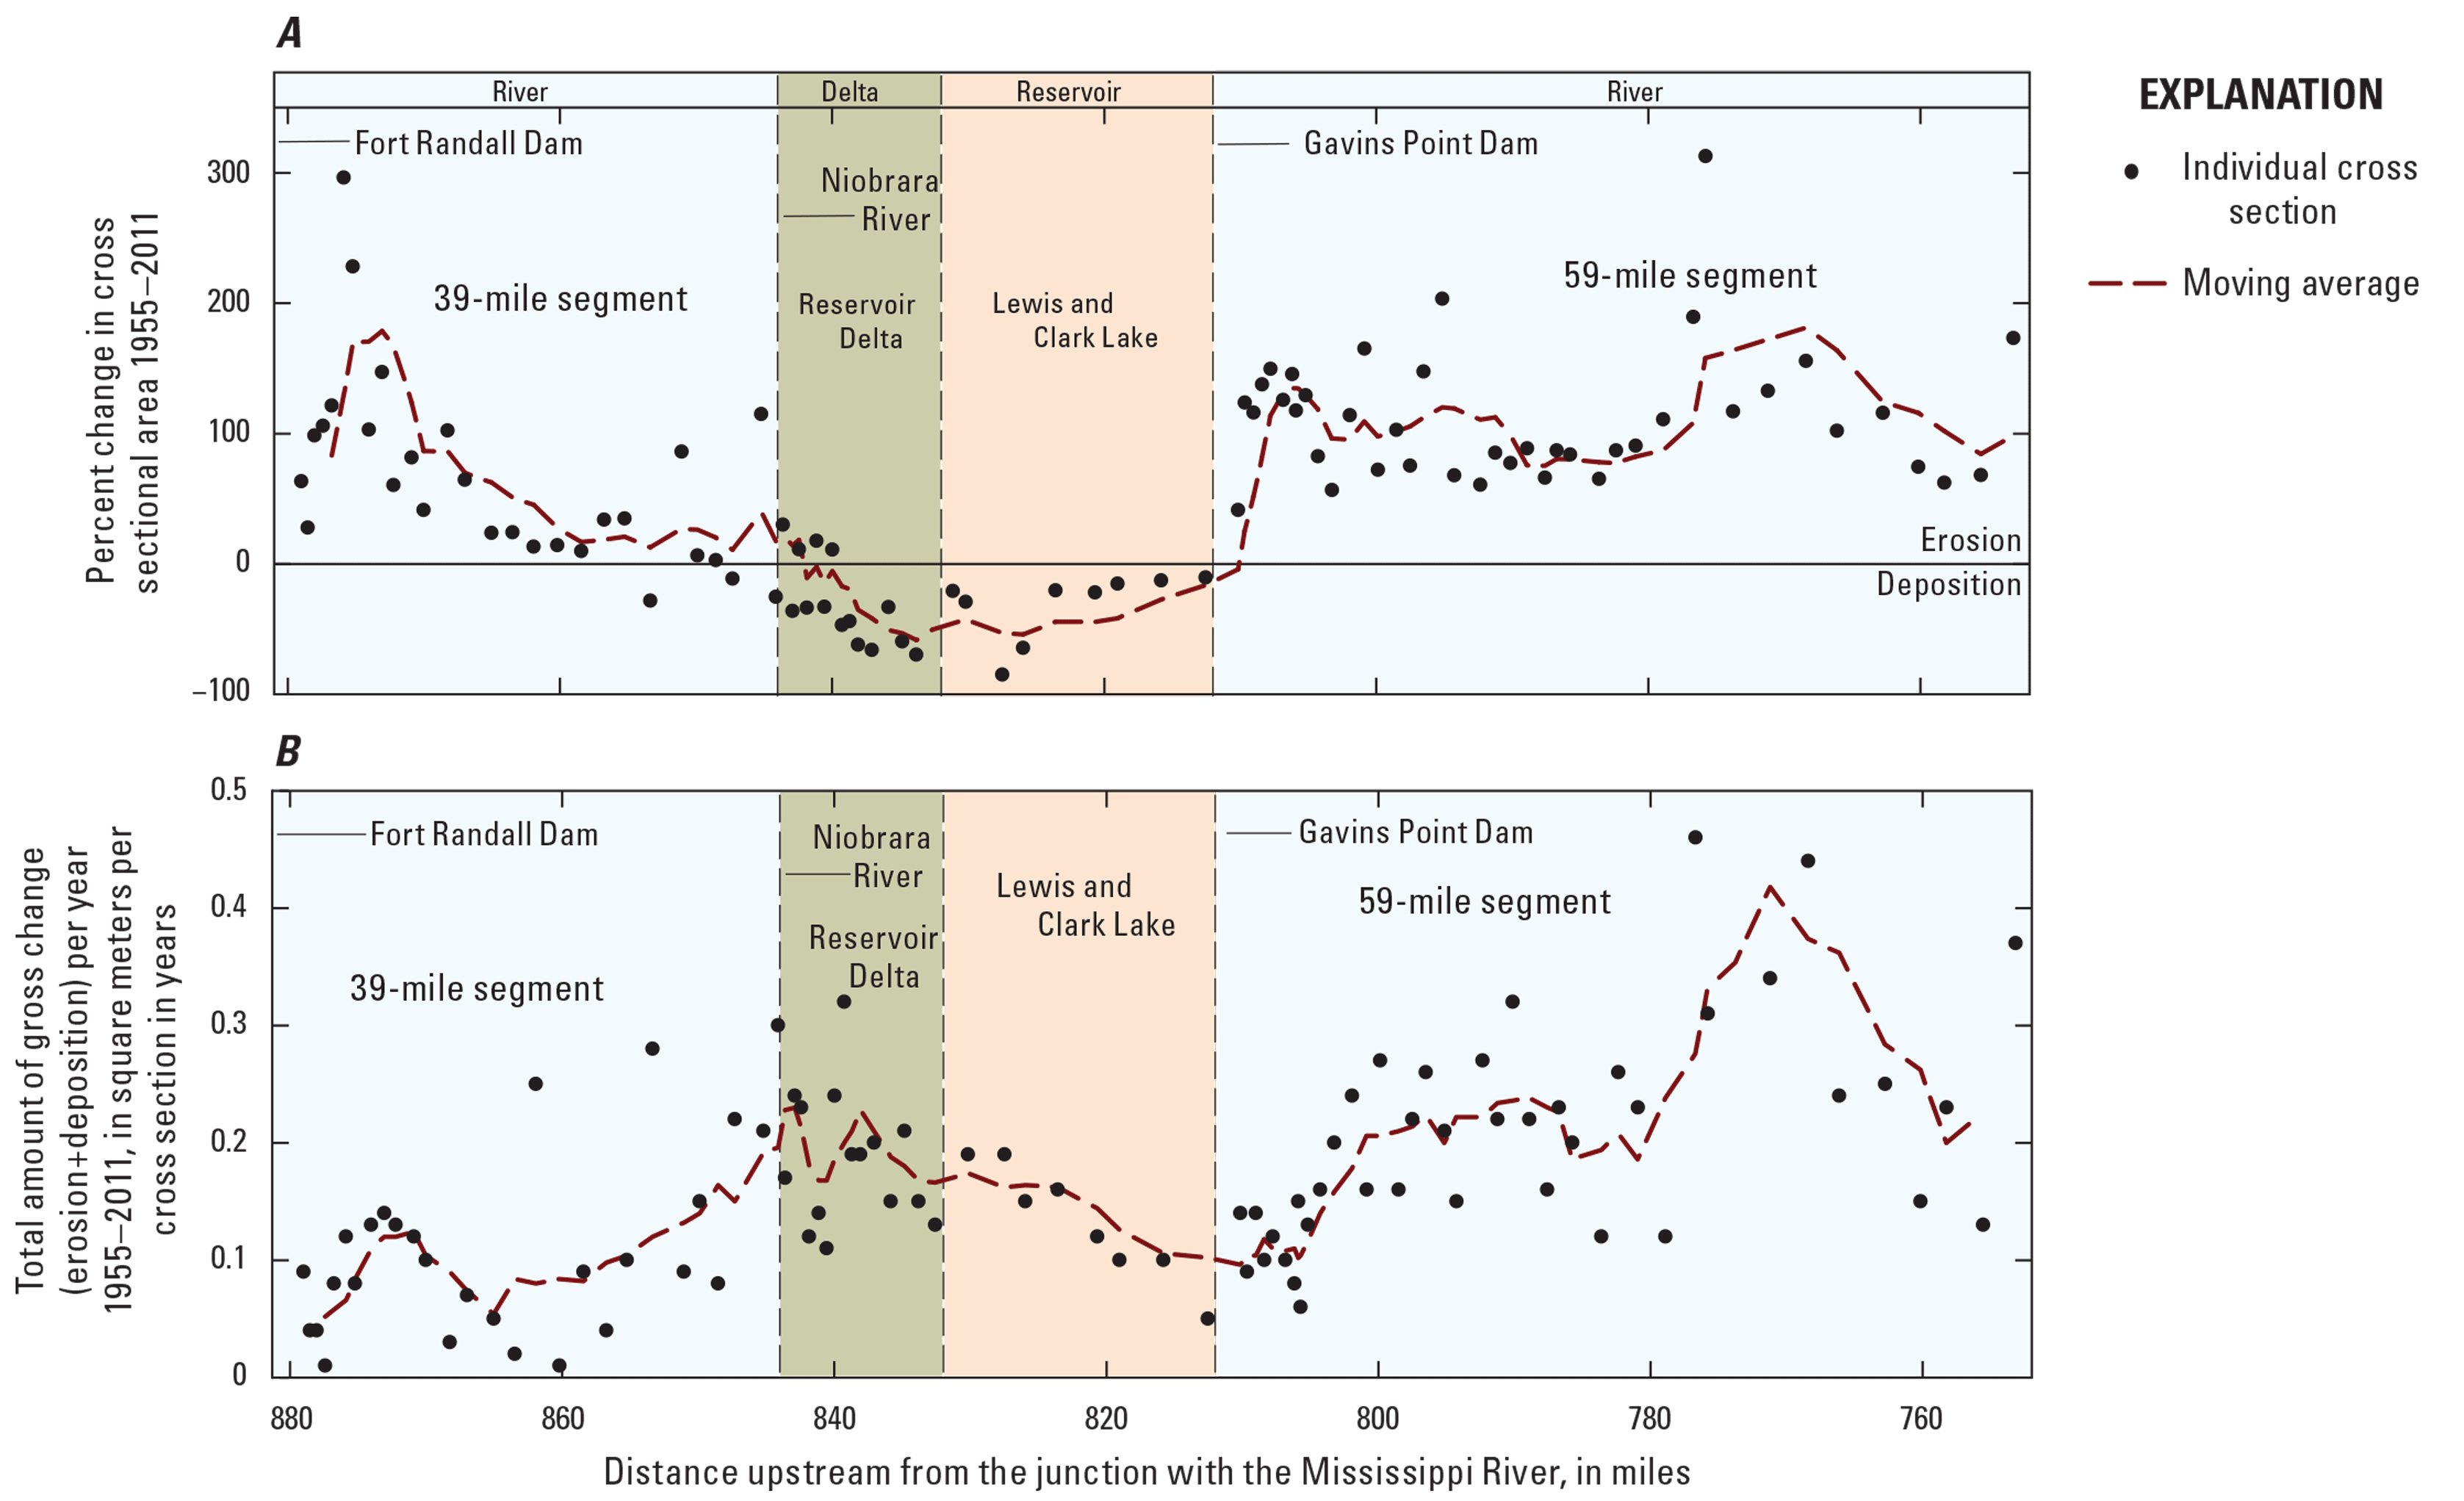
Channel change in the Missouri National Recreational River, 1955–2011 from cross sections surveyed by the U.S. Army Corps of Engineers. A, Channel capacity change in cross-sectional area from 1955–2011 from Fort Randall Dam to Ponca State Park, Missouri River mile 880–752, from cross sections surveyed by the U.S. Army Corps of Engineers. B, Total amount of gross change per cross section per year 1955–2011 from Fort Randall Dam to Ponca State Park, Missouri River mile 880–752, from cross sections surveyed by the U.S. Army Corps of Engineers. At the time of publication, the USACE data were not publicly available.
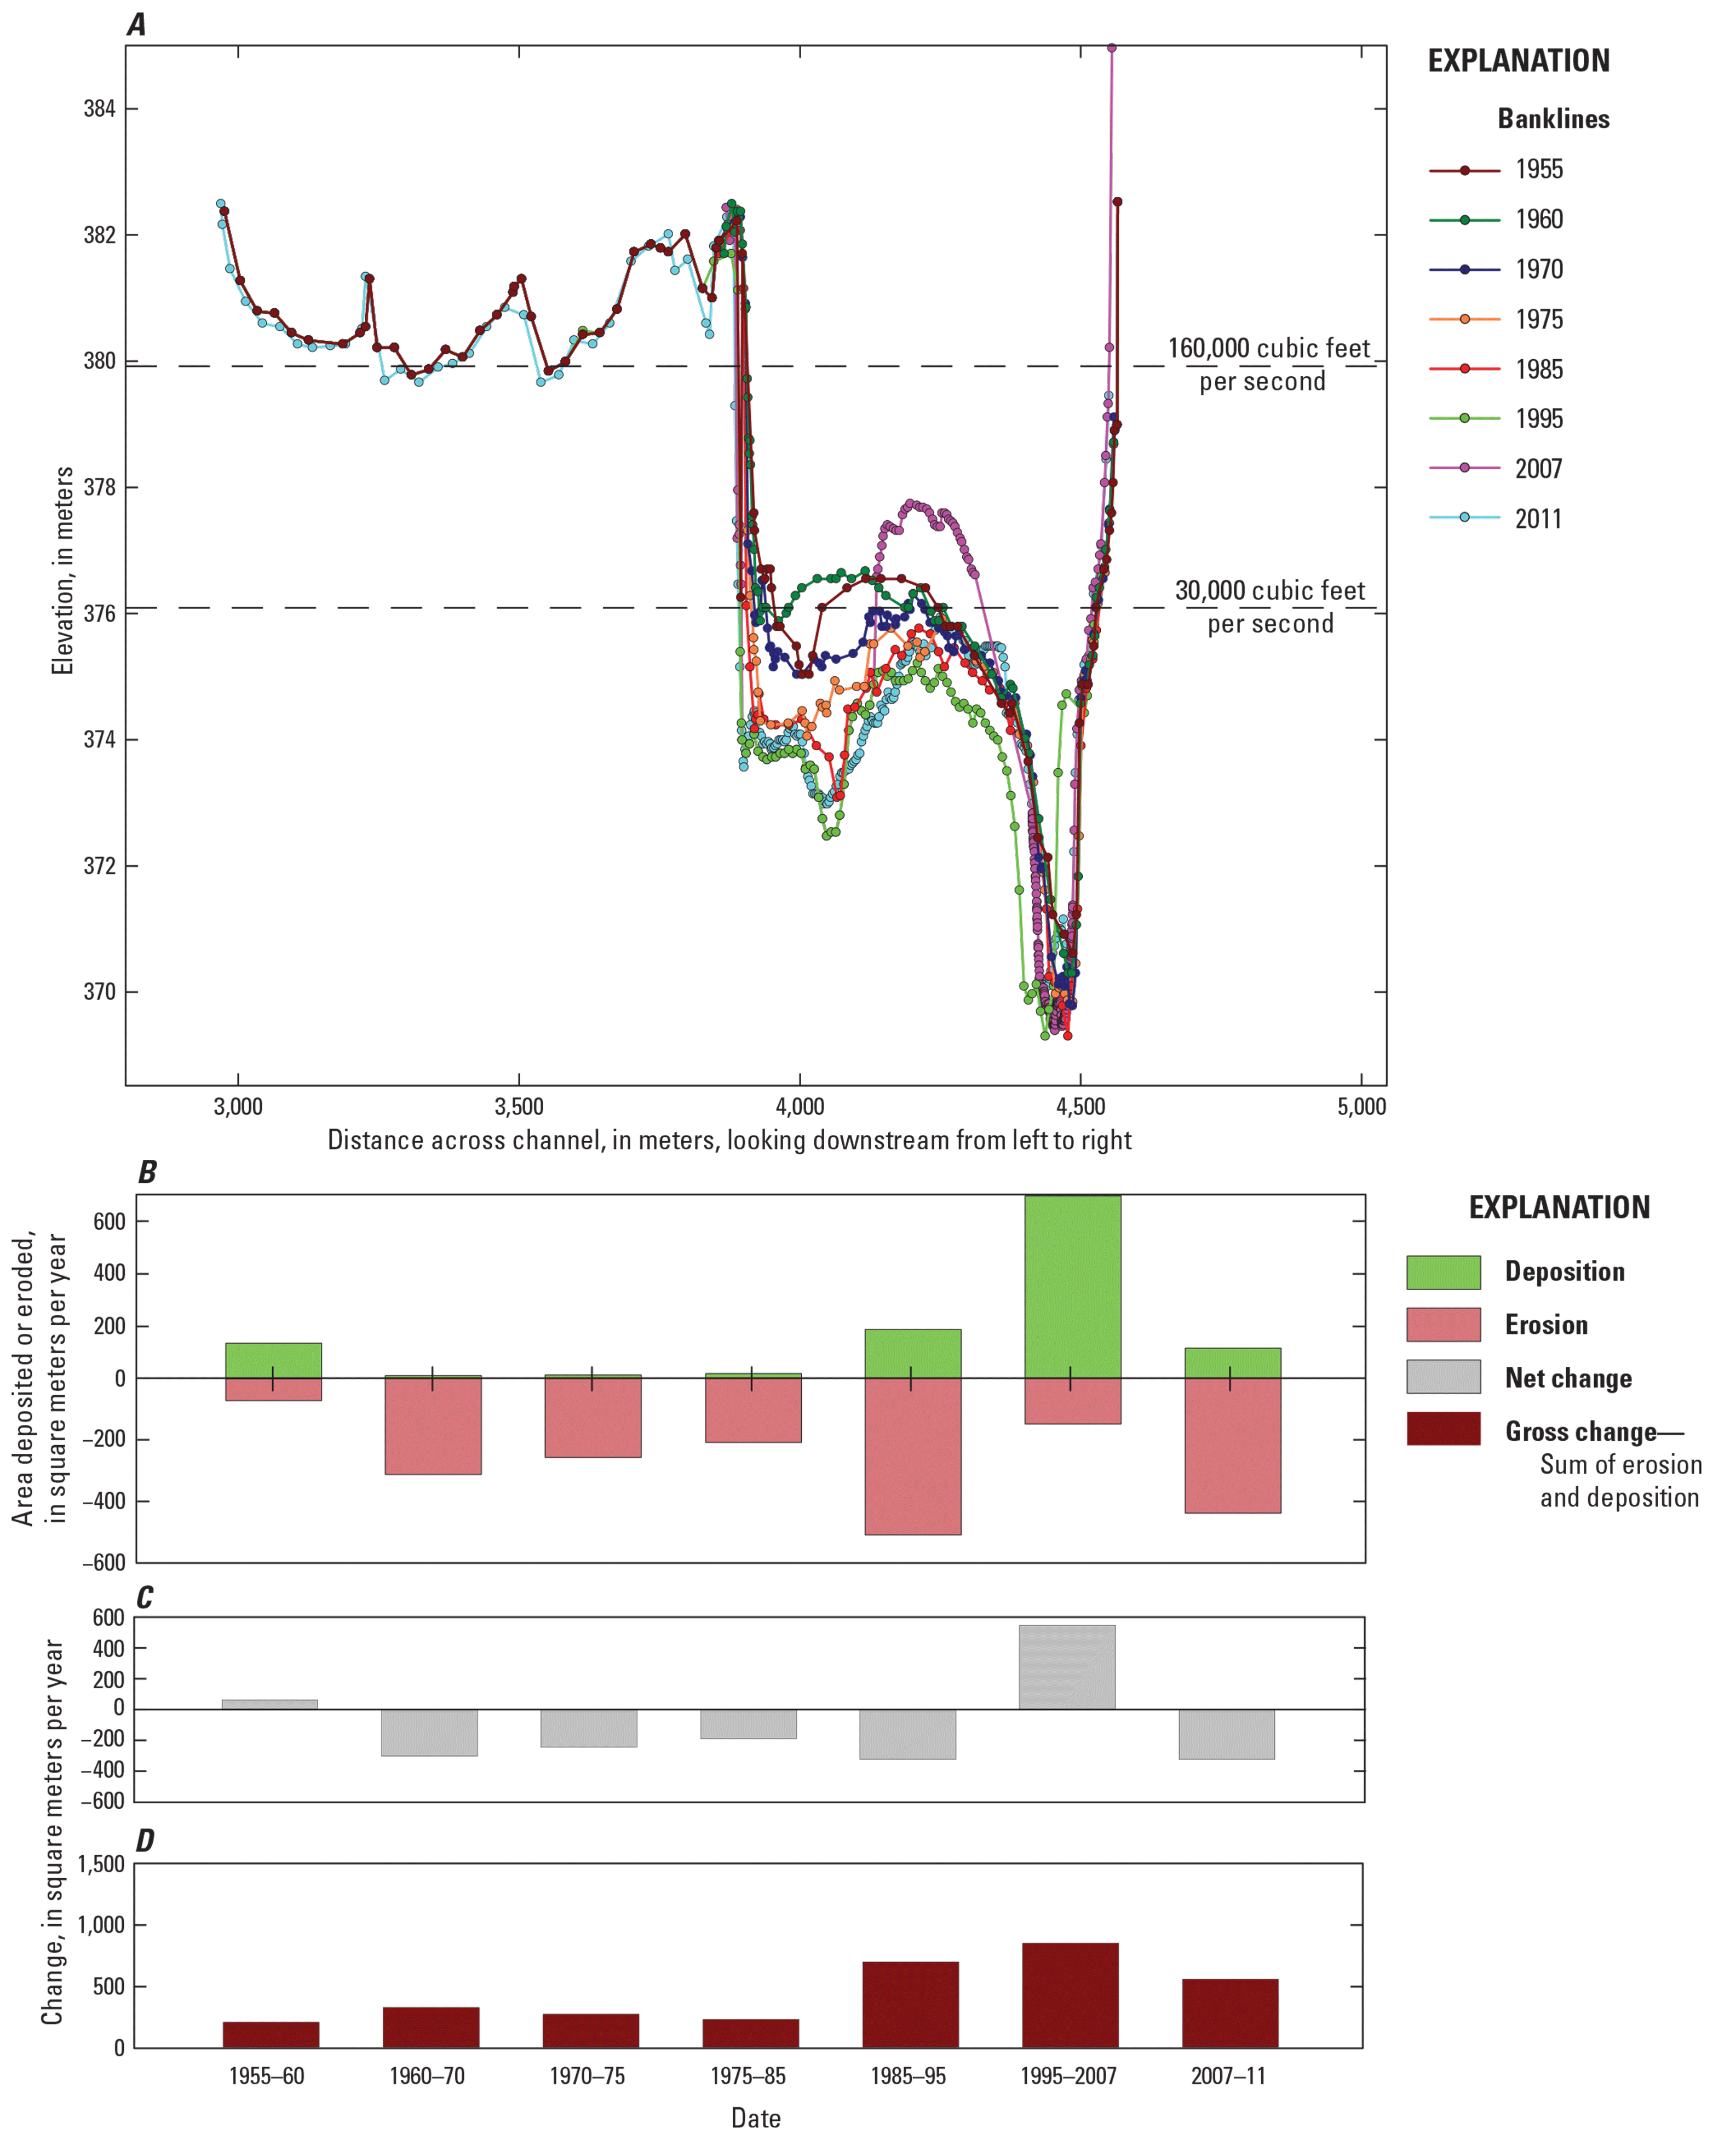
Channel changes at river mile 878, 3.2 kilometers downstream from Fort Randall Dam in the 39-mile segment of the Missouri National Recreational River. A, Cross section showing U.S. Army Corps of Engineers (USACE) surveys since dam closure. B, Amount of sediment deposited or eroded. C, Net change. D, Gross change between survey years. Water-surface elevations are from USACE HEC–RAS modeling. At the time of publication, the USACE data were not publicly available.
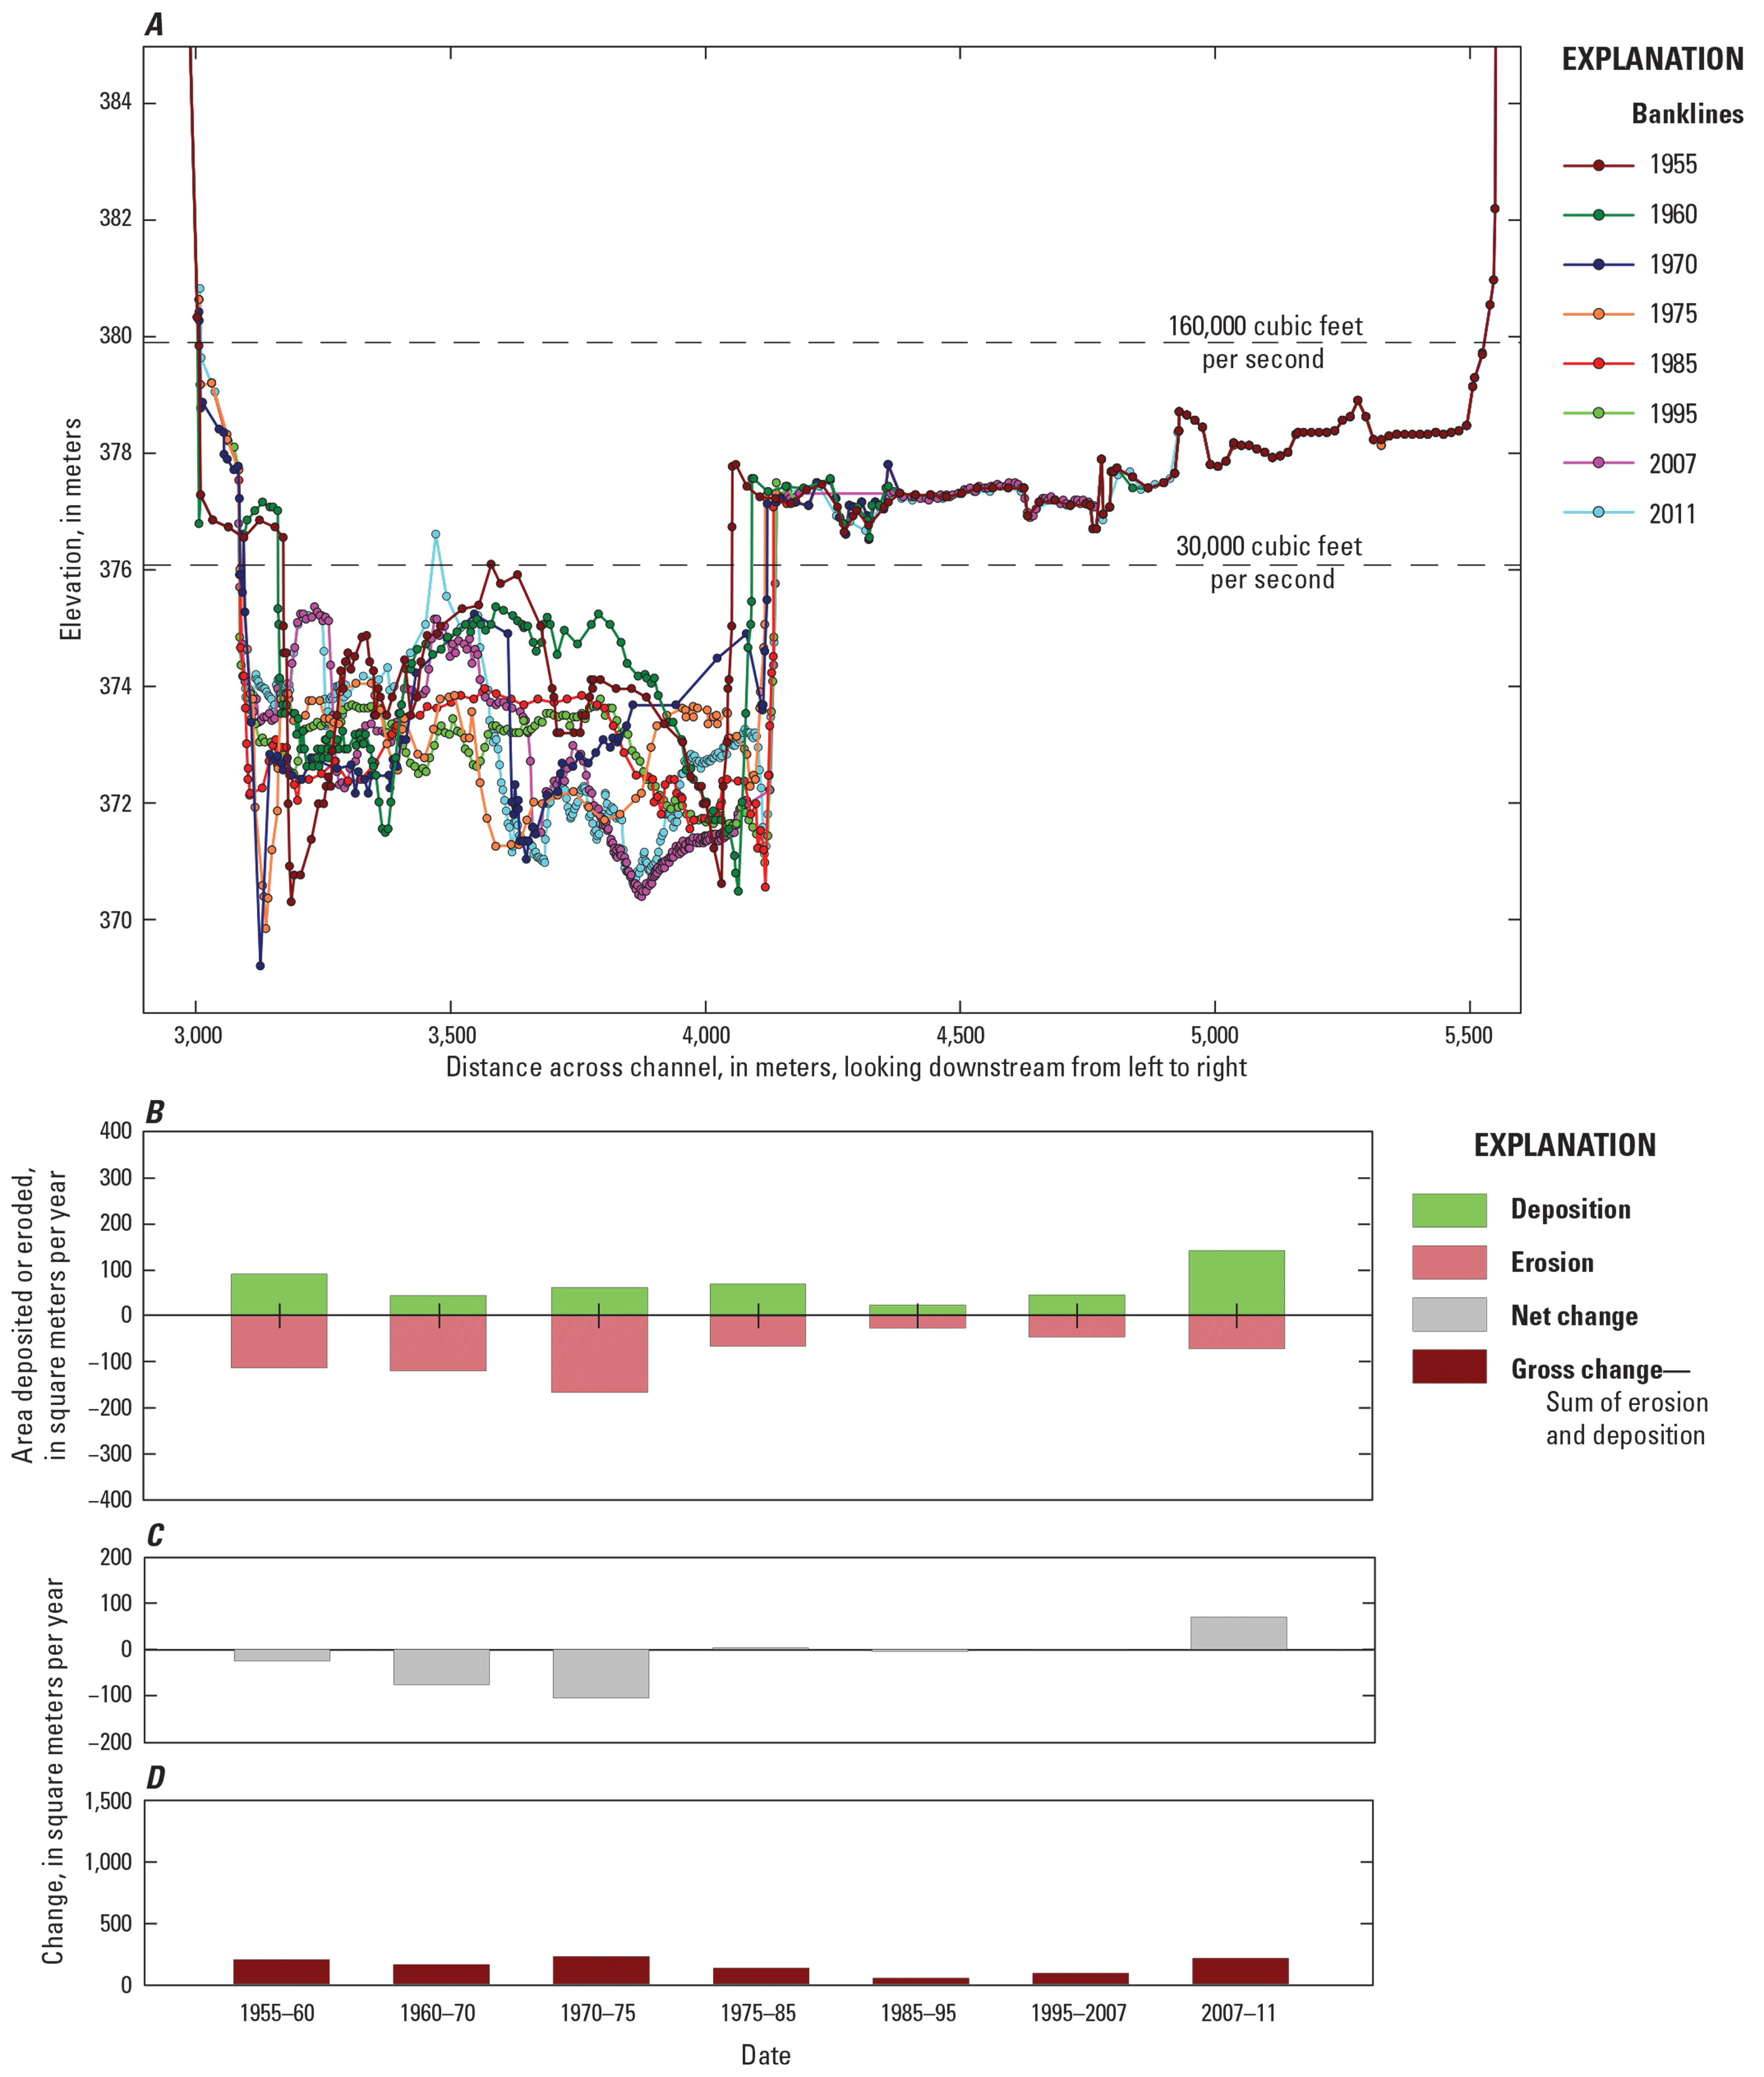
Channel changes at river mile 867, 20.3 kilometers downstream from Fort Randall Dam in the 39-mile segment of the Missouri National Recreational River. A, Cross section showing U.S. Army Corps of Engineers (USACE) surveys since dam closure. B, Amount of sediment deposited or eroded. C, Net change. D, Gross change between survey years. Water-surface elevations are from USACE HEC–RAS modeling. At the time of publication, the USACE data were not publicly available.
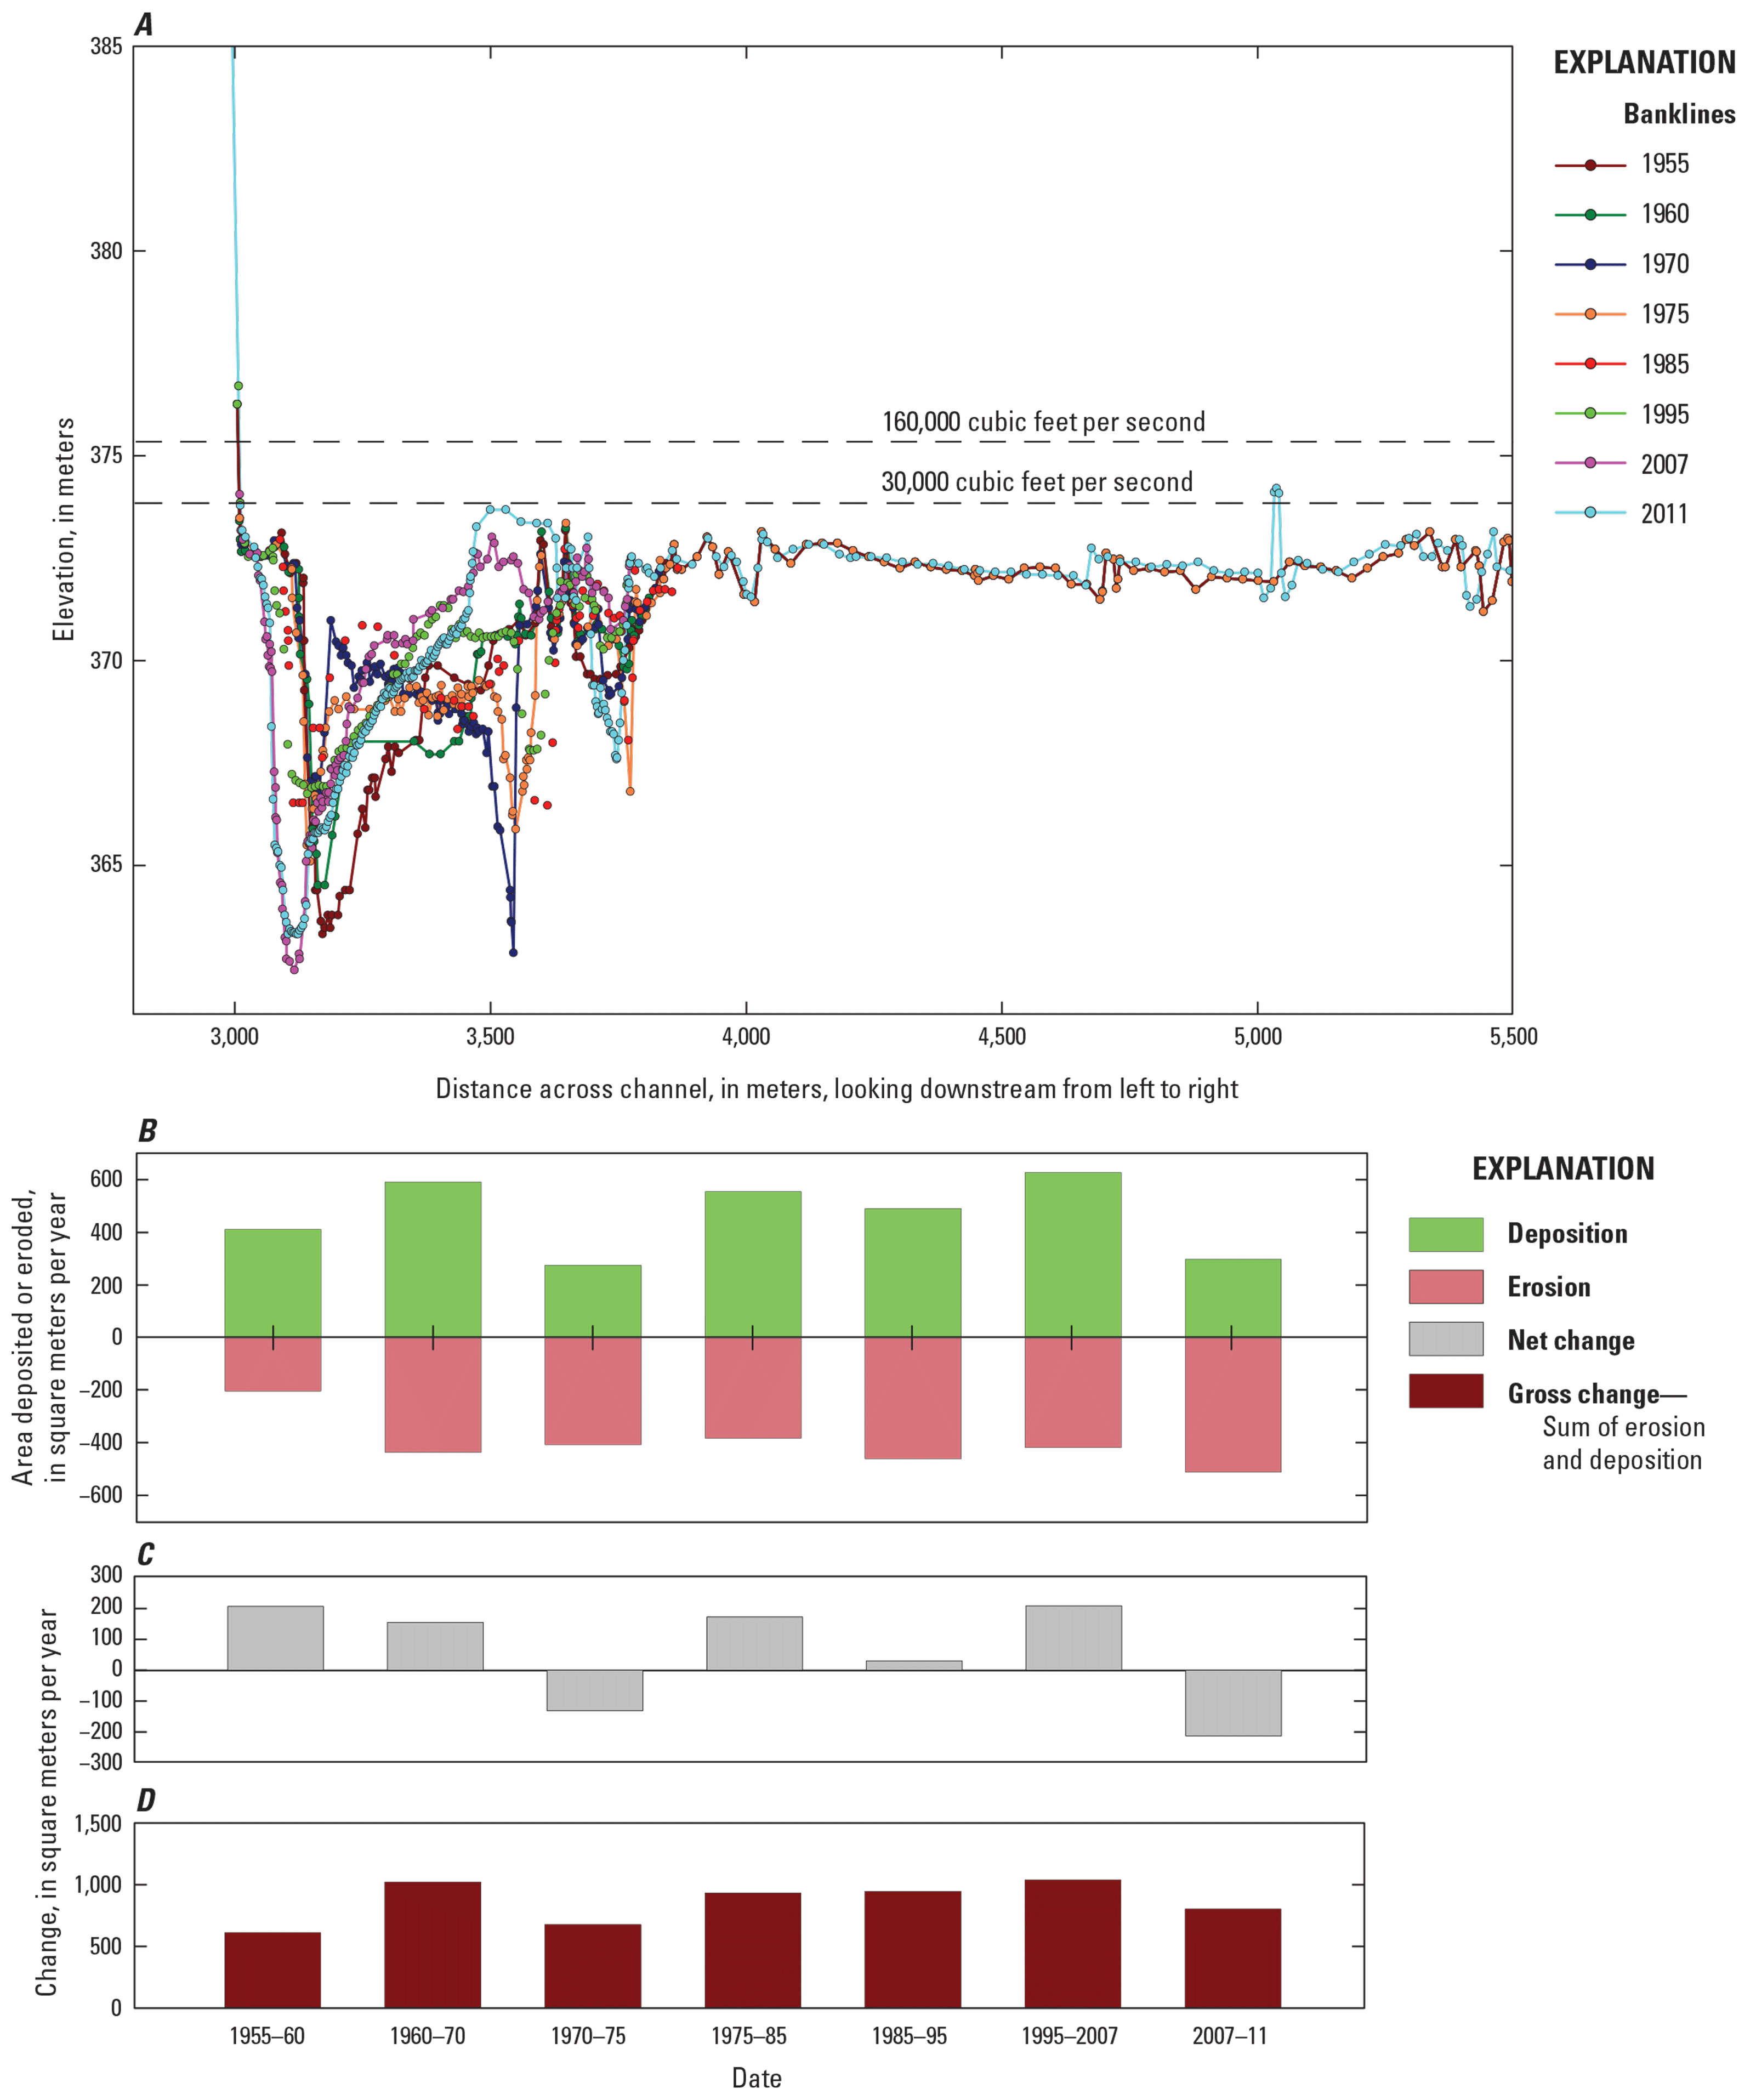
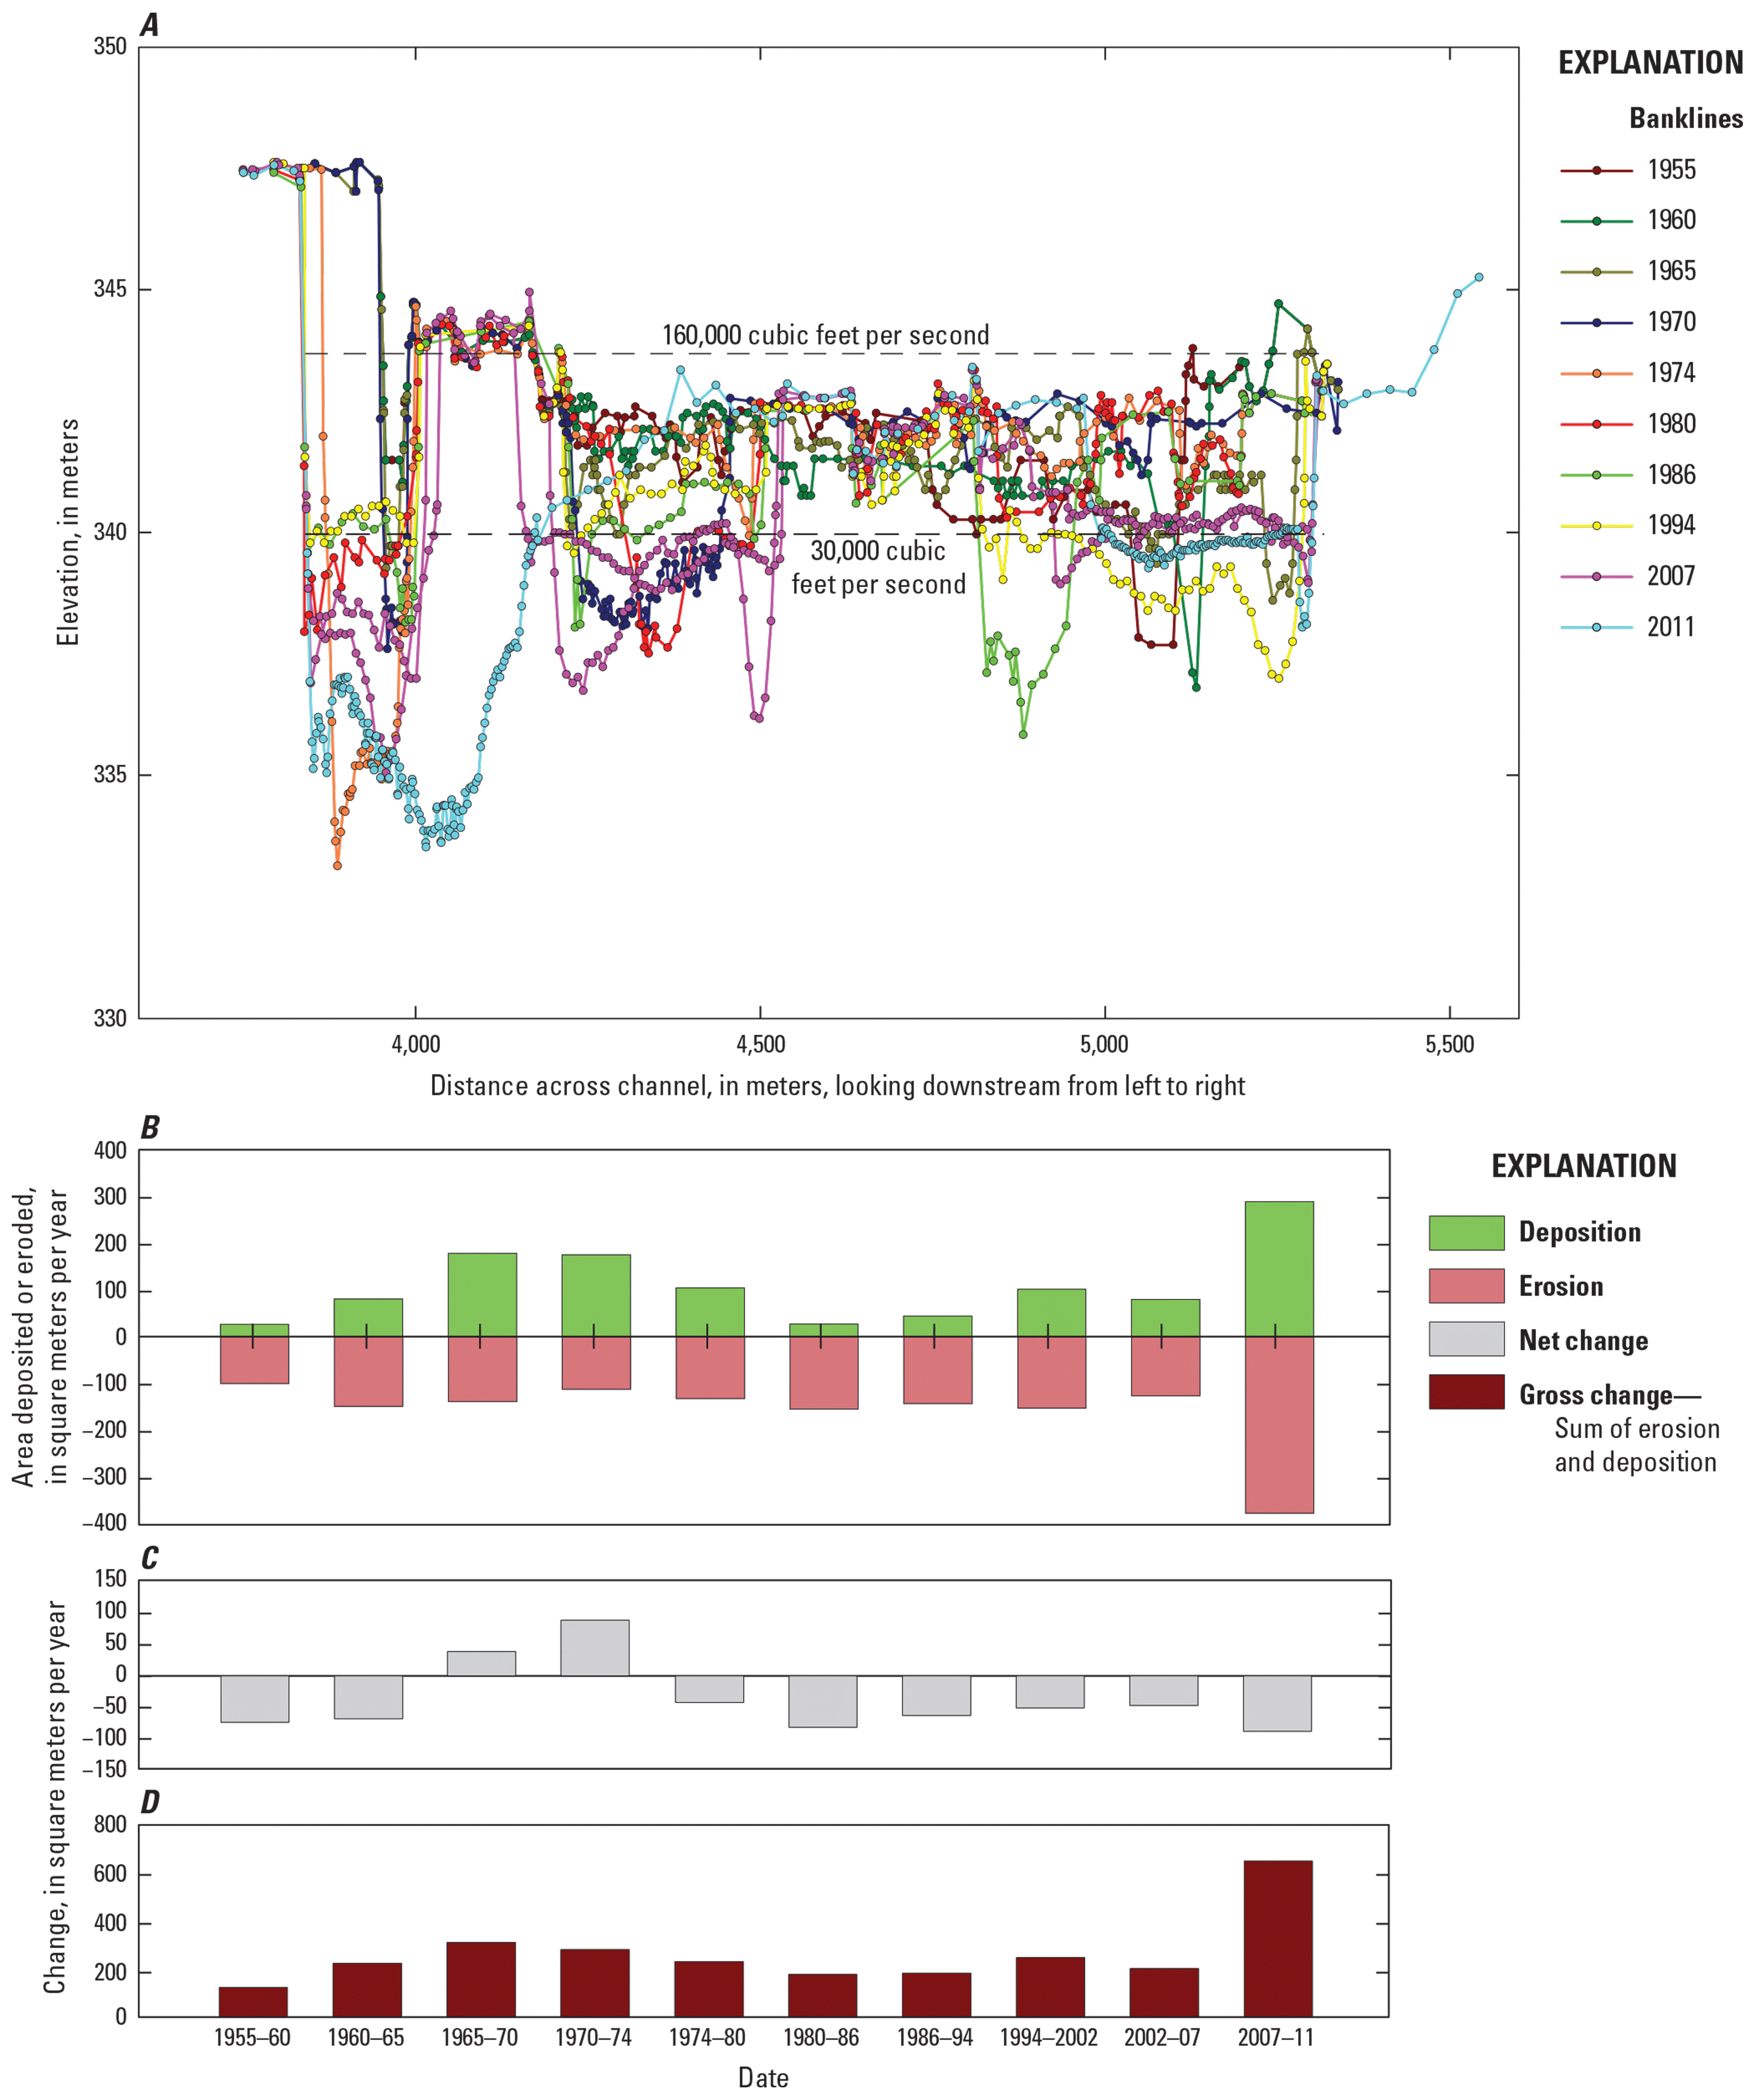
Channel changes at river mile 847.3, 52.6 kilometers downstream from Fort Randall Dam in the 39-mile segment of the Missouri National Recreational River. A, Cross section showing U.S. Army Corps of Engineers (USACE) surveys since dam closure. B, Amount of sediment deposited or eroded. C, Net change. D, Gross change between survey years. Water-surface elevations are from USACE HEC–RAS modeling. At the time of publication, the USACE data were not publicly available.
Channel changes at river mile 843.6, 57.9 kilometers downstream from Fort Randall Dam in the 39-mile segment Missouri National Recreational River at the confluence with the Niobrara River. A, Cross section showing U.S. Army Corps of Engineers (USACE) surveys since dam closure. B, Amount of sediment deposited or eroded. C, Net change. D, Gross change between survey years. Water-surface elevations are from USACE HEC–RAS modeling. At the time of publication, the USACE data were not publicly available.
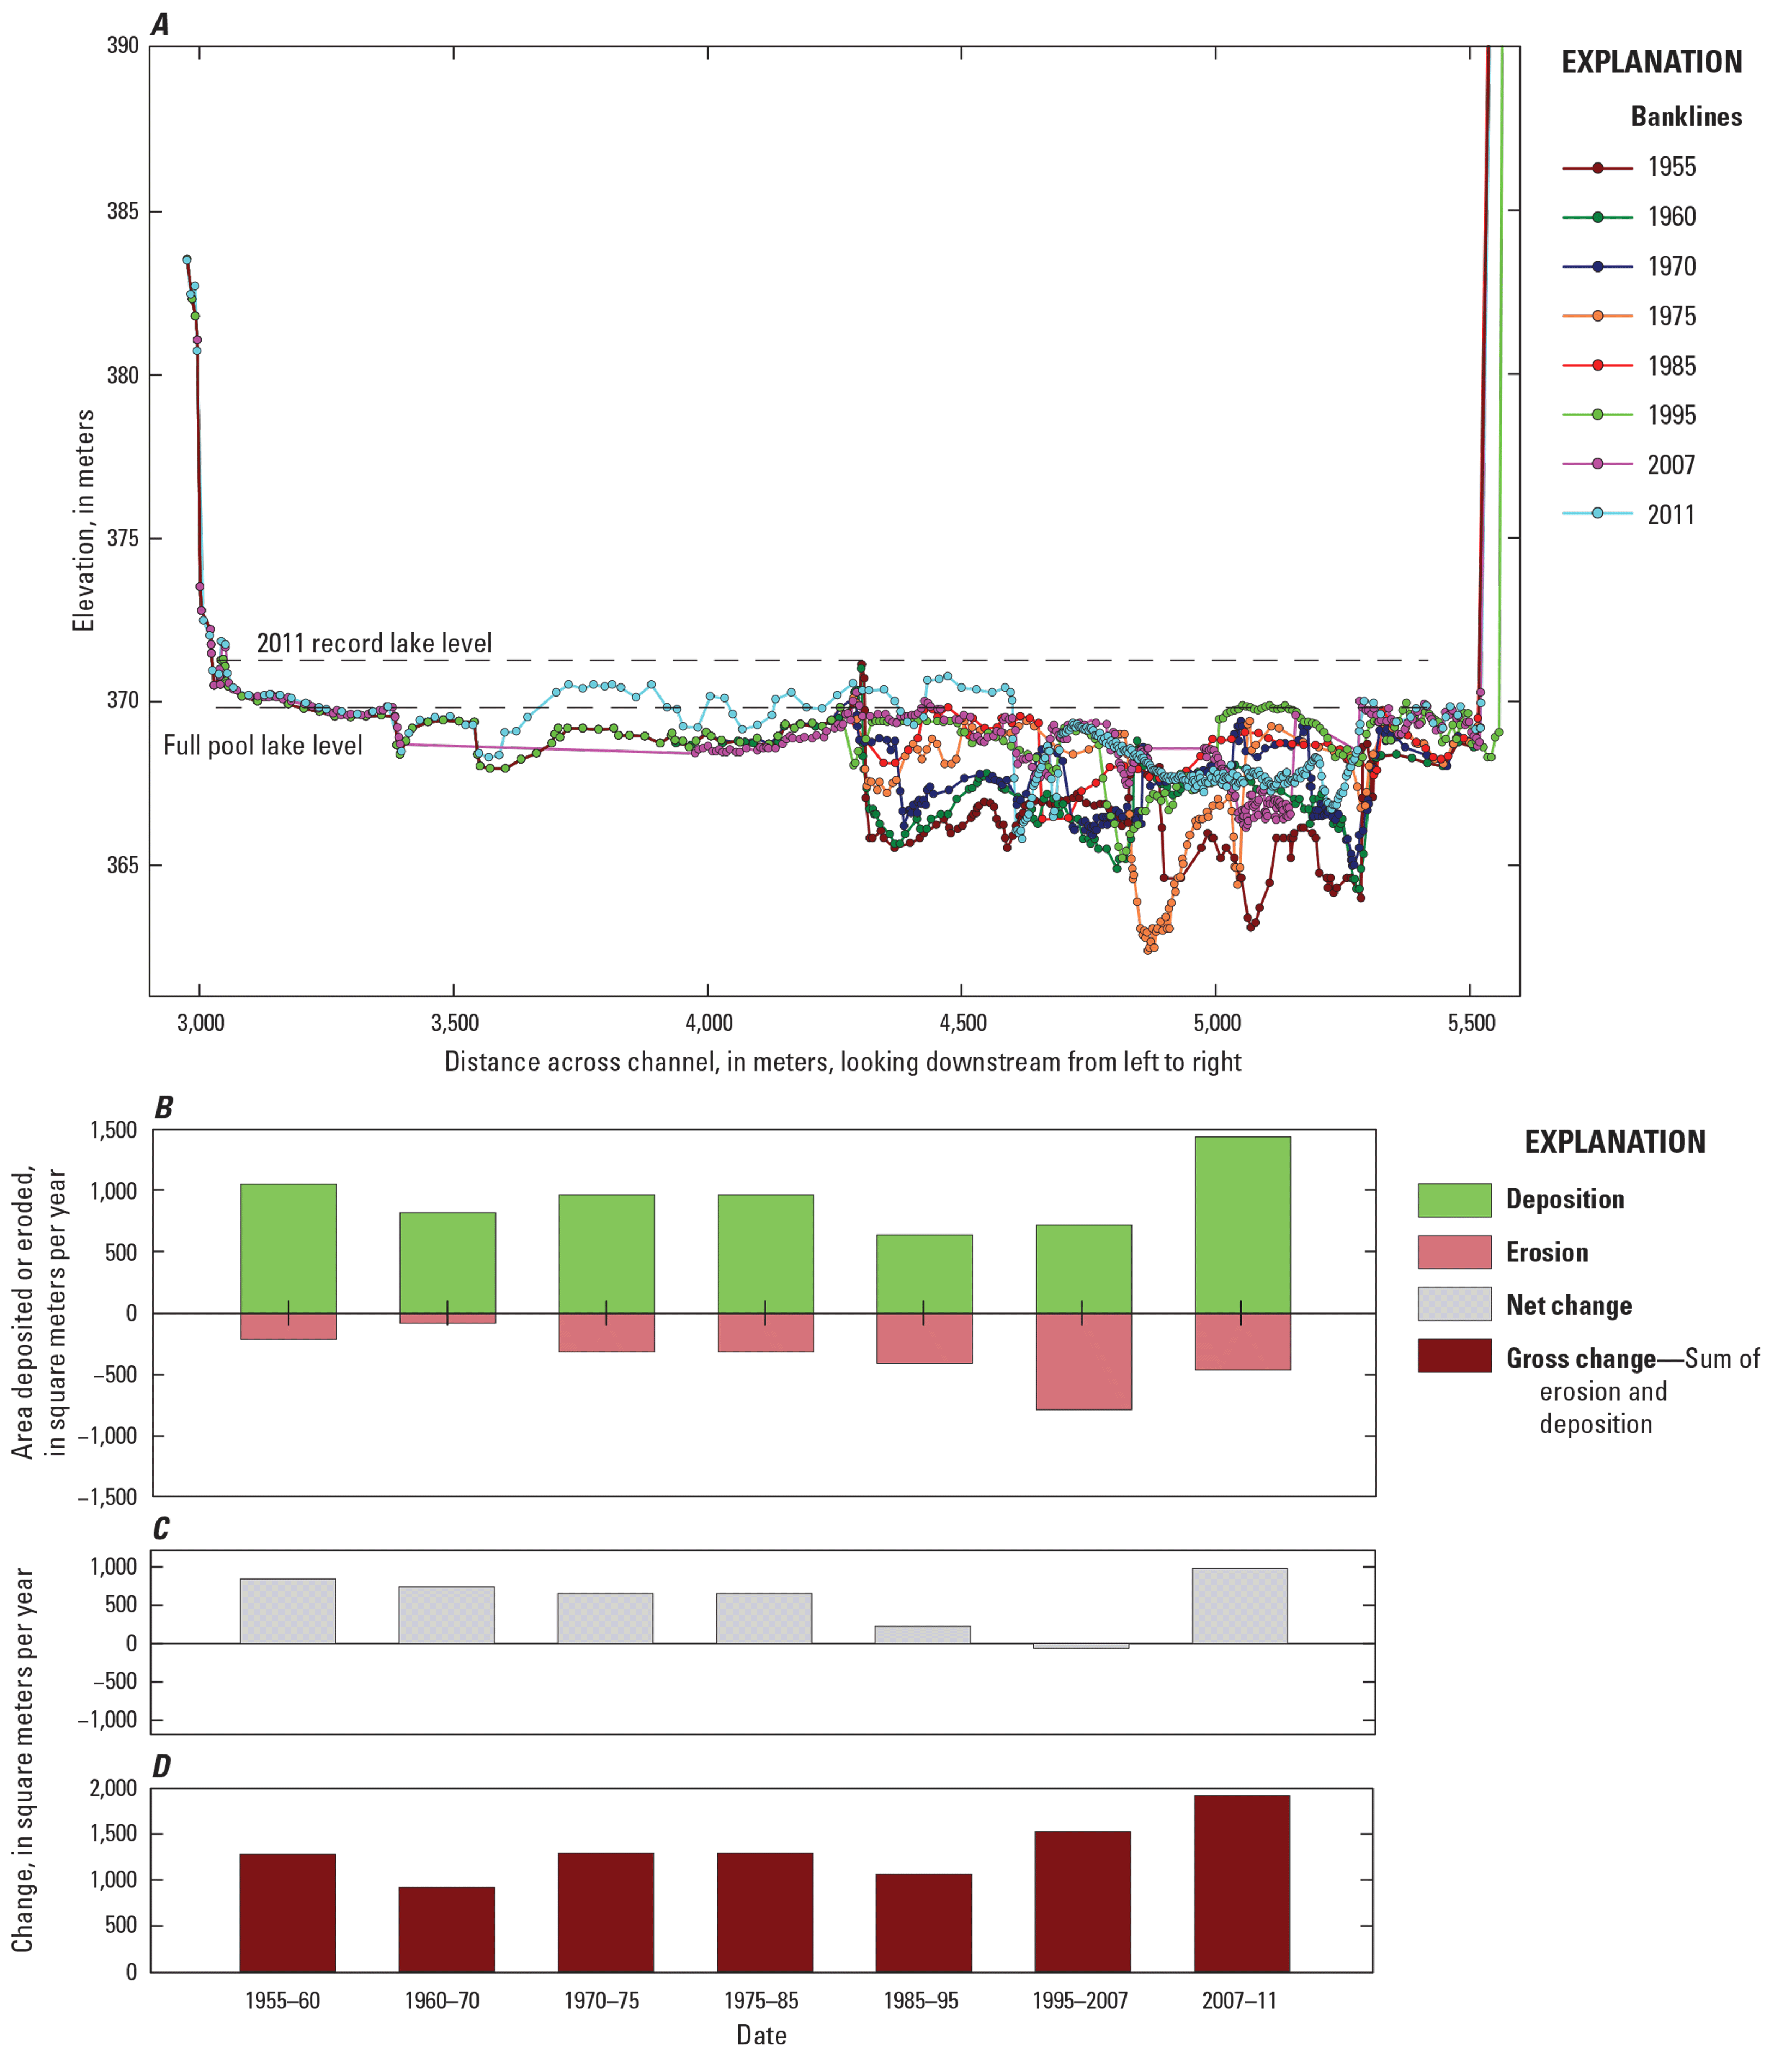
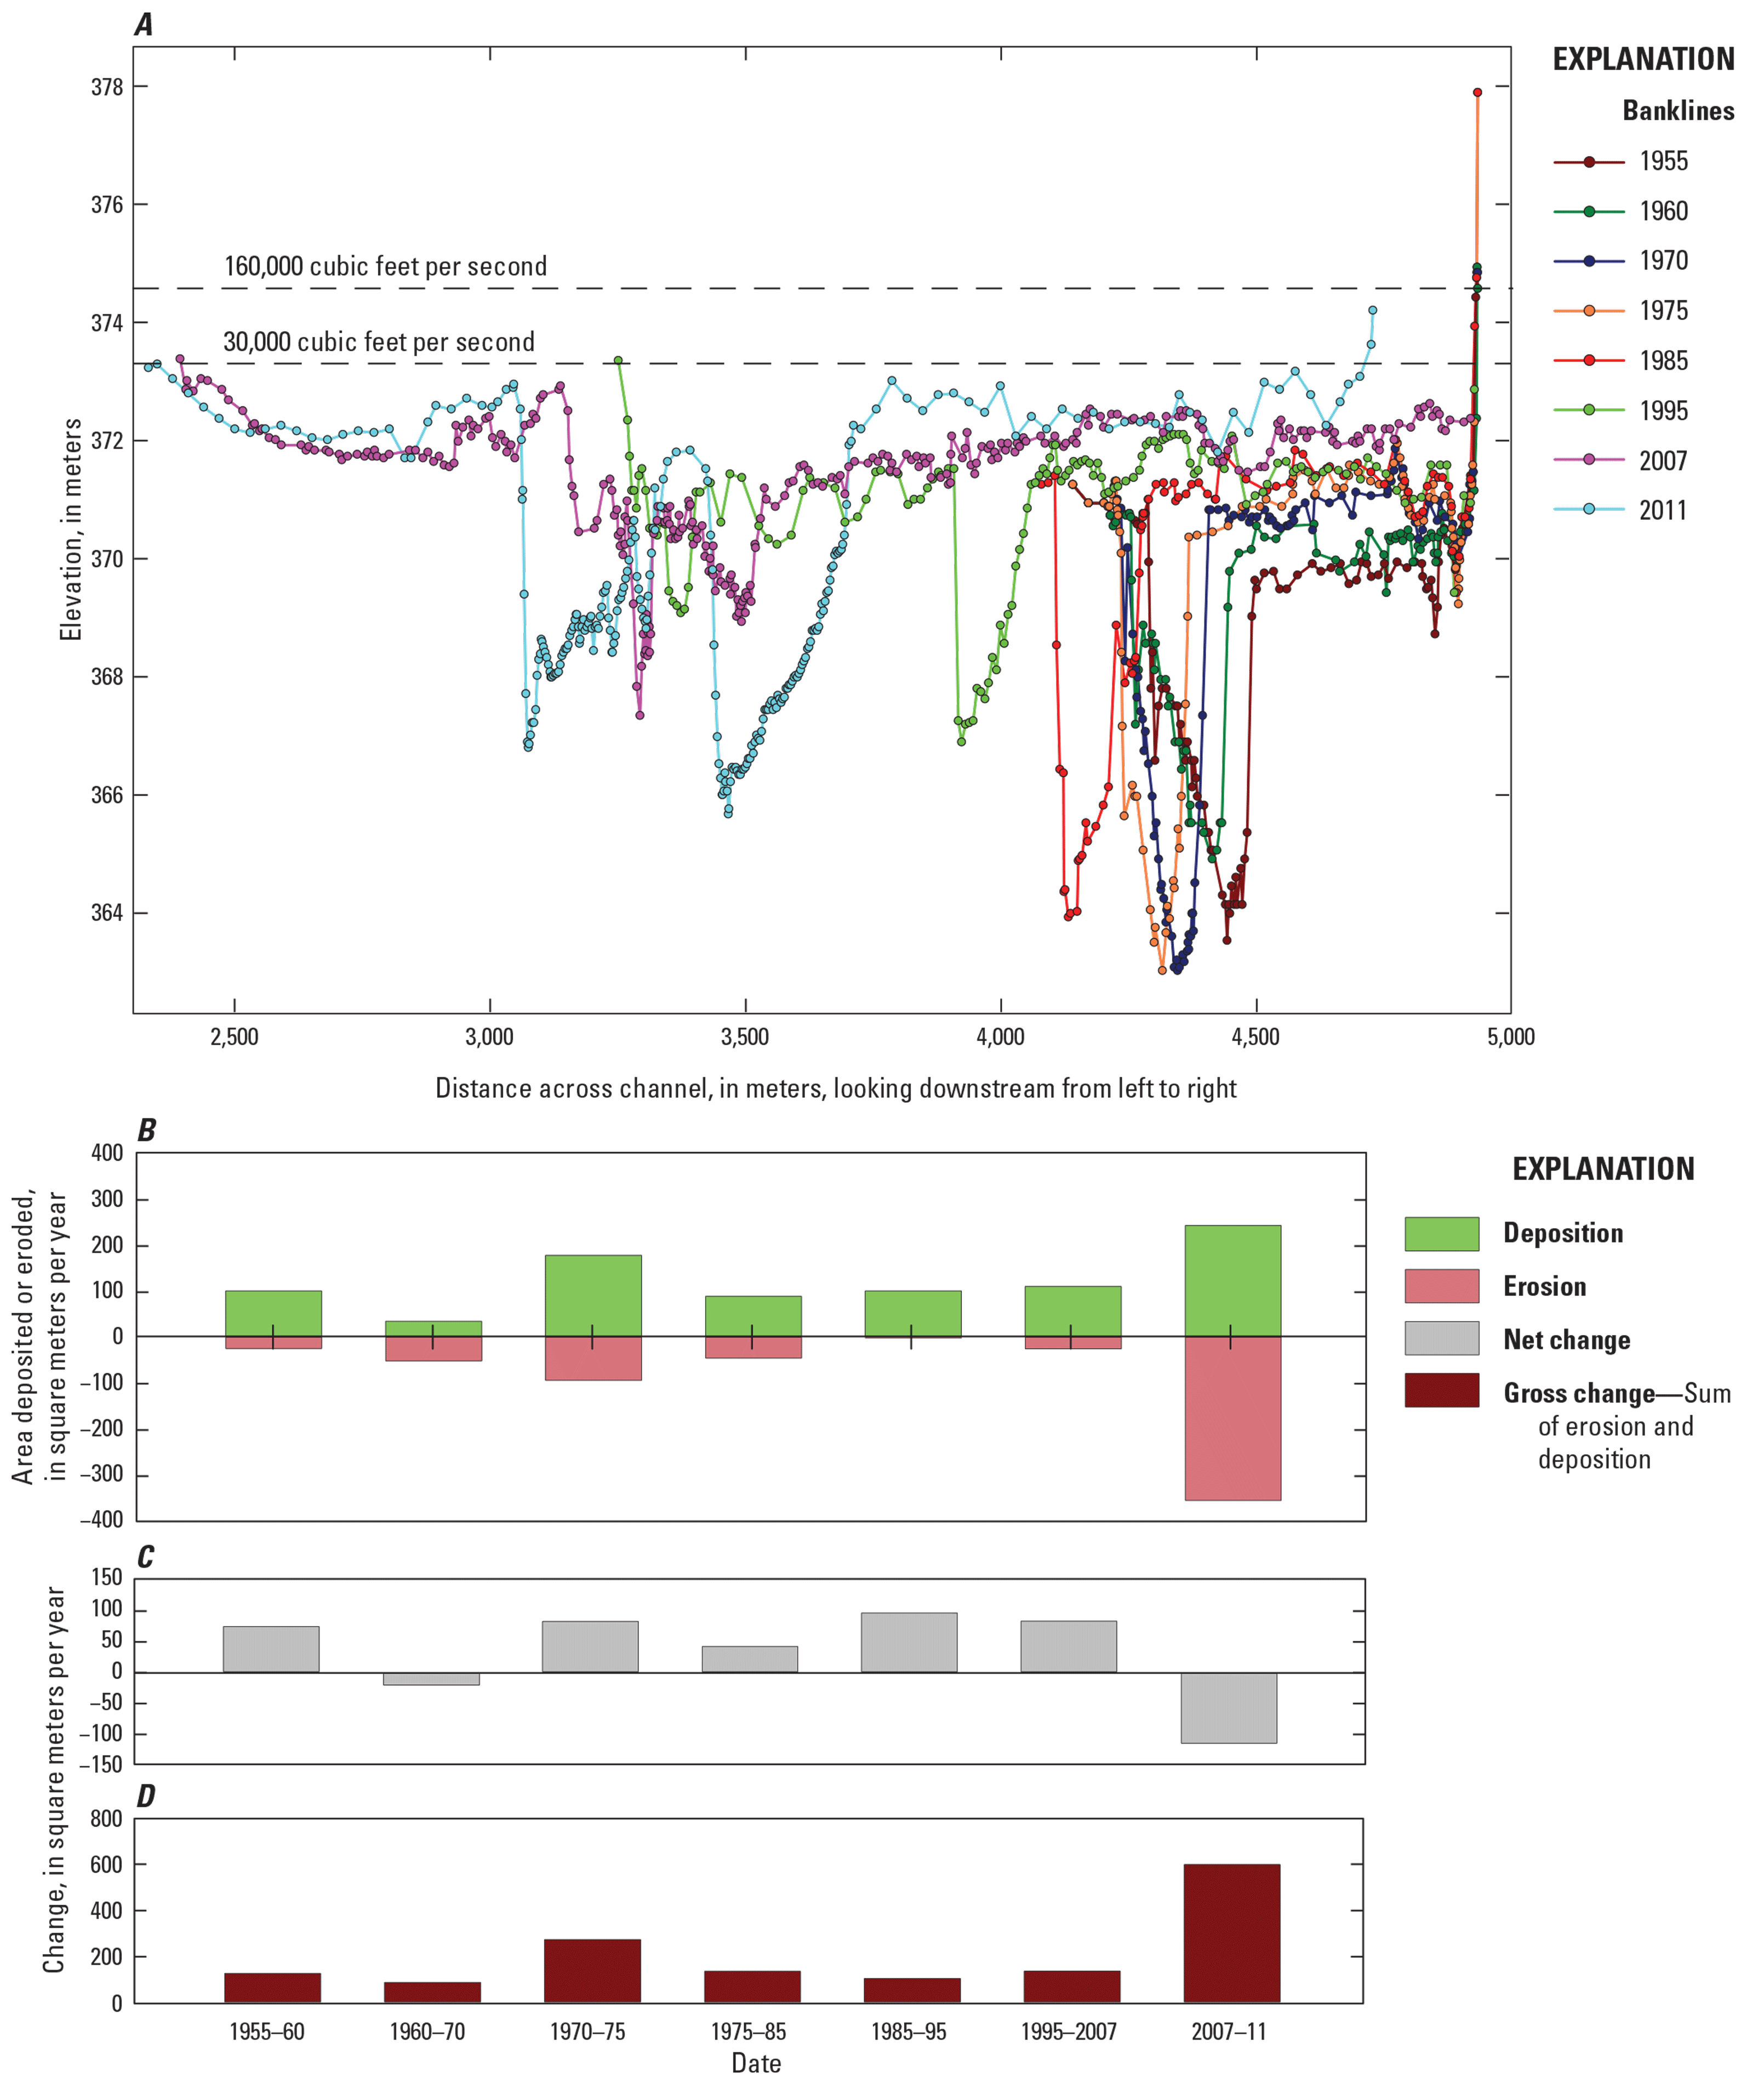
Channel changes at river mile 837, 41 kilometers upstream from Gavins Point Dam in the delta of Lewis and Clark Lake. A, Cross section showing U.S. Army Corps of Engineers (USACE) surveys since dam closure. B, Amount of sediment deposited or eroded. C, Net change. D, Gross change between survey years. Water-surface elevations are from USACE HEC–RAS modeling. At the time of publication, the USACE data were not publicly available.
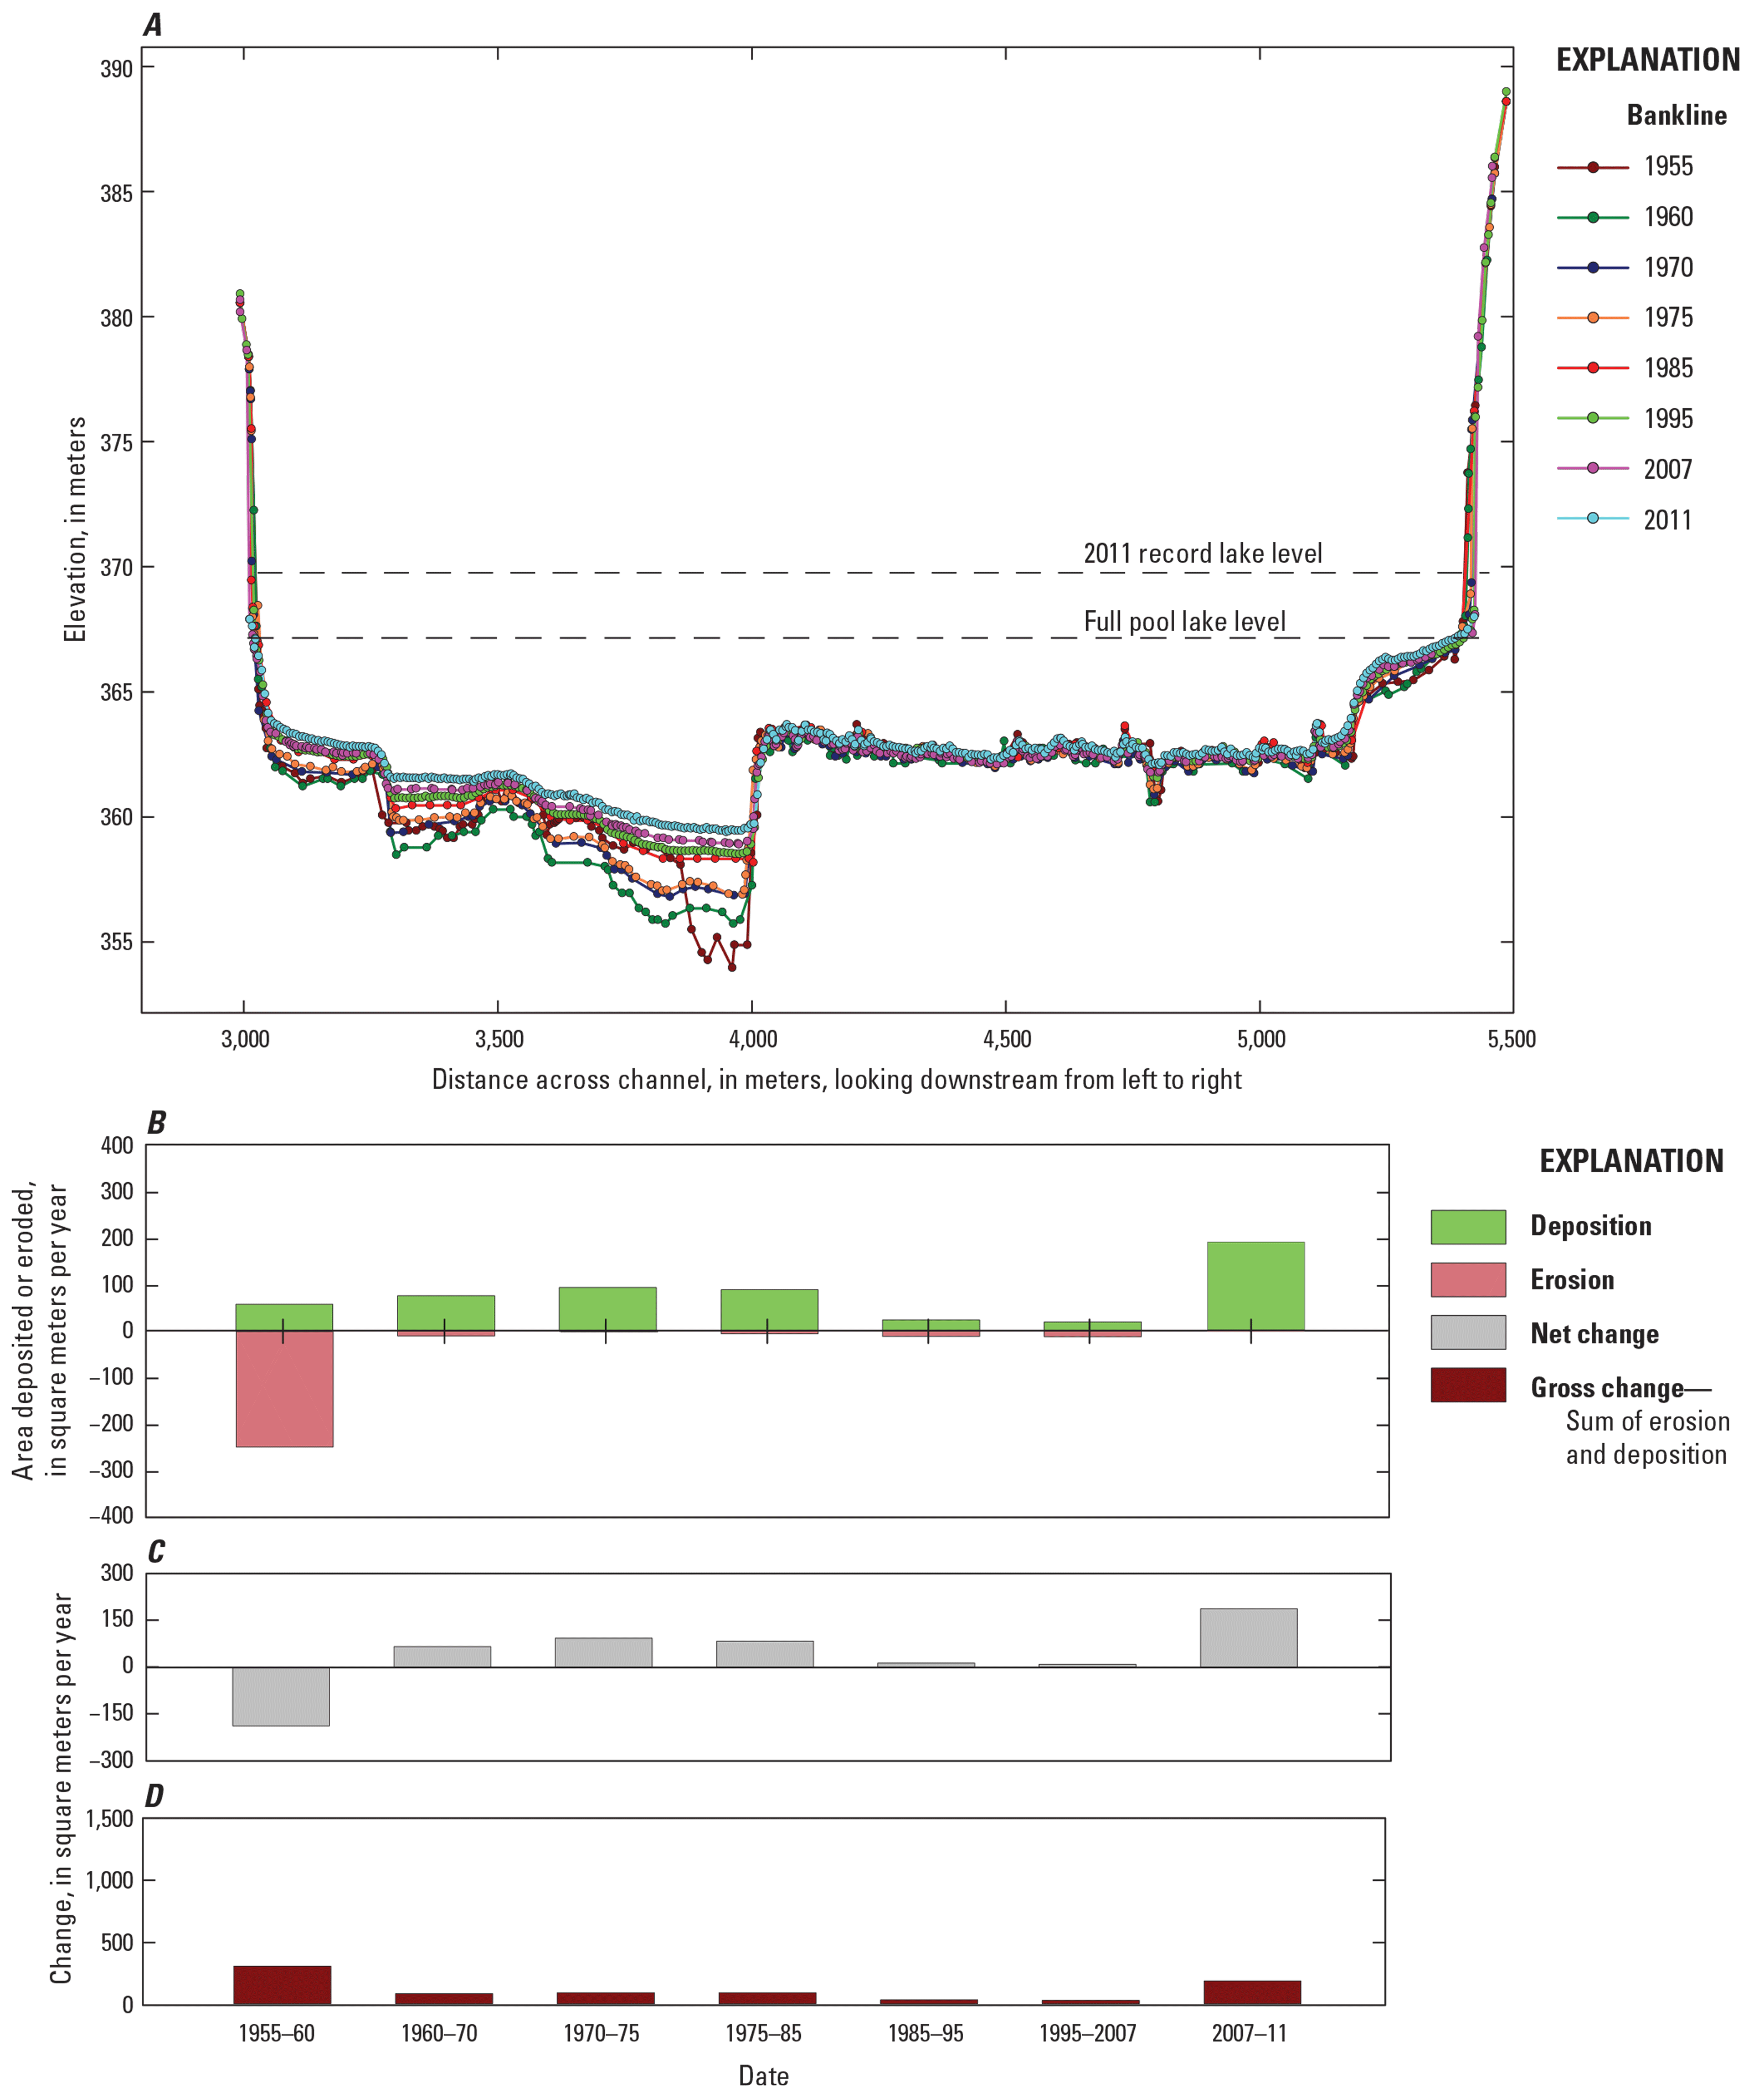
Channel changes at river mile 819, 11 kilometers upstream from Gavins Point Dam in Lewis and Clark Lake. A, Cross section showing U.S. Army Corps of Engineers (USACE) surveys since dam closure. B, Amount of sediment deposited or eroded. C, Net change. D, Gross change between survey years. Water-surface elevations are from USACE HEC-RAS modeling. At the time of publication, the USACE data were not publicly available.
Channel changes at river mile 805.2, 9.4 kilometers downstream from Gavins Point Dam in the 59-mile segment of the Missouri National Recreational River. A, Cross section showing U.S. Army Corps of Engineers (USACE) surveys since dam closure. B, Amount of sediment deposited or eroded. C, Net change. D, Gross change between survey years. Water-surface elevations are from USACE HEC–RAS modeling. At the time of publication, the USACE data were not publicly available.
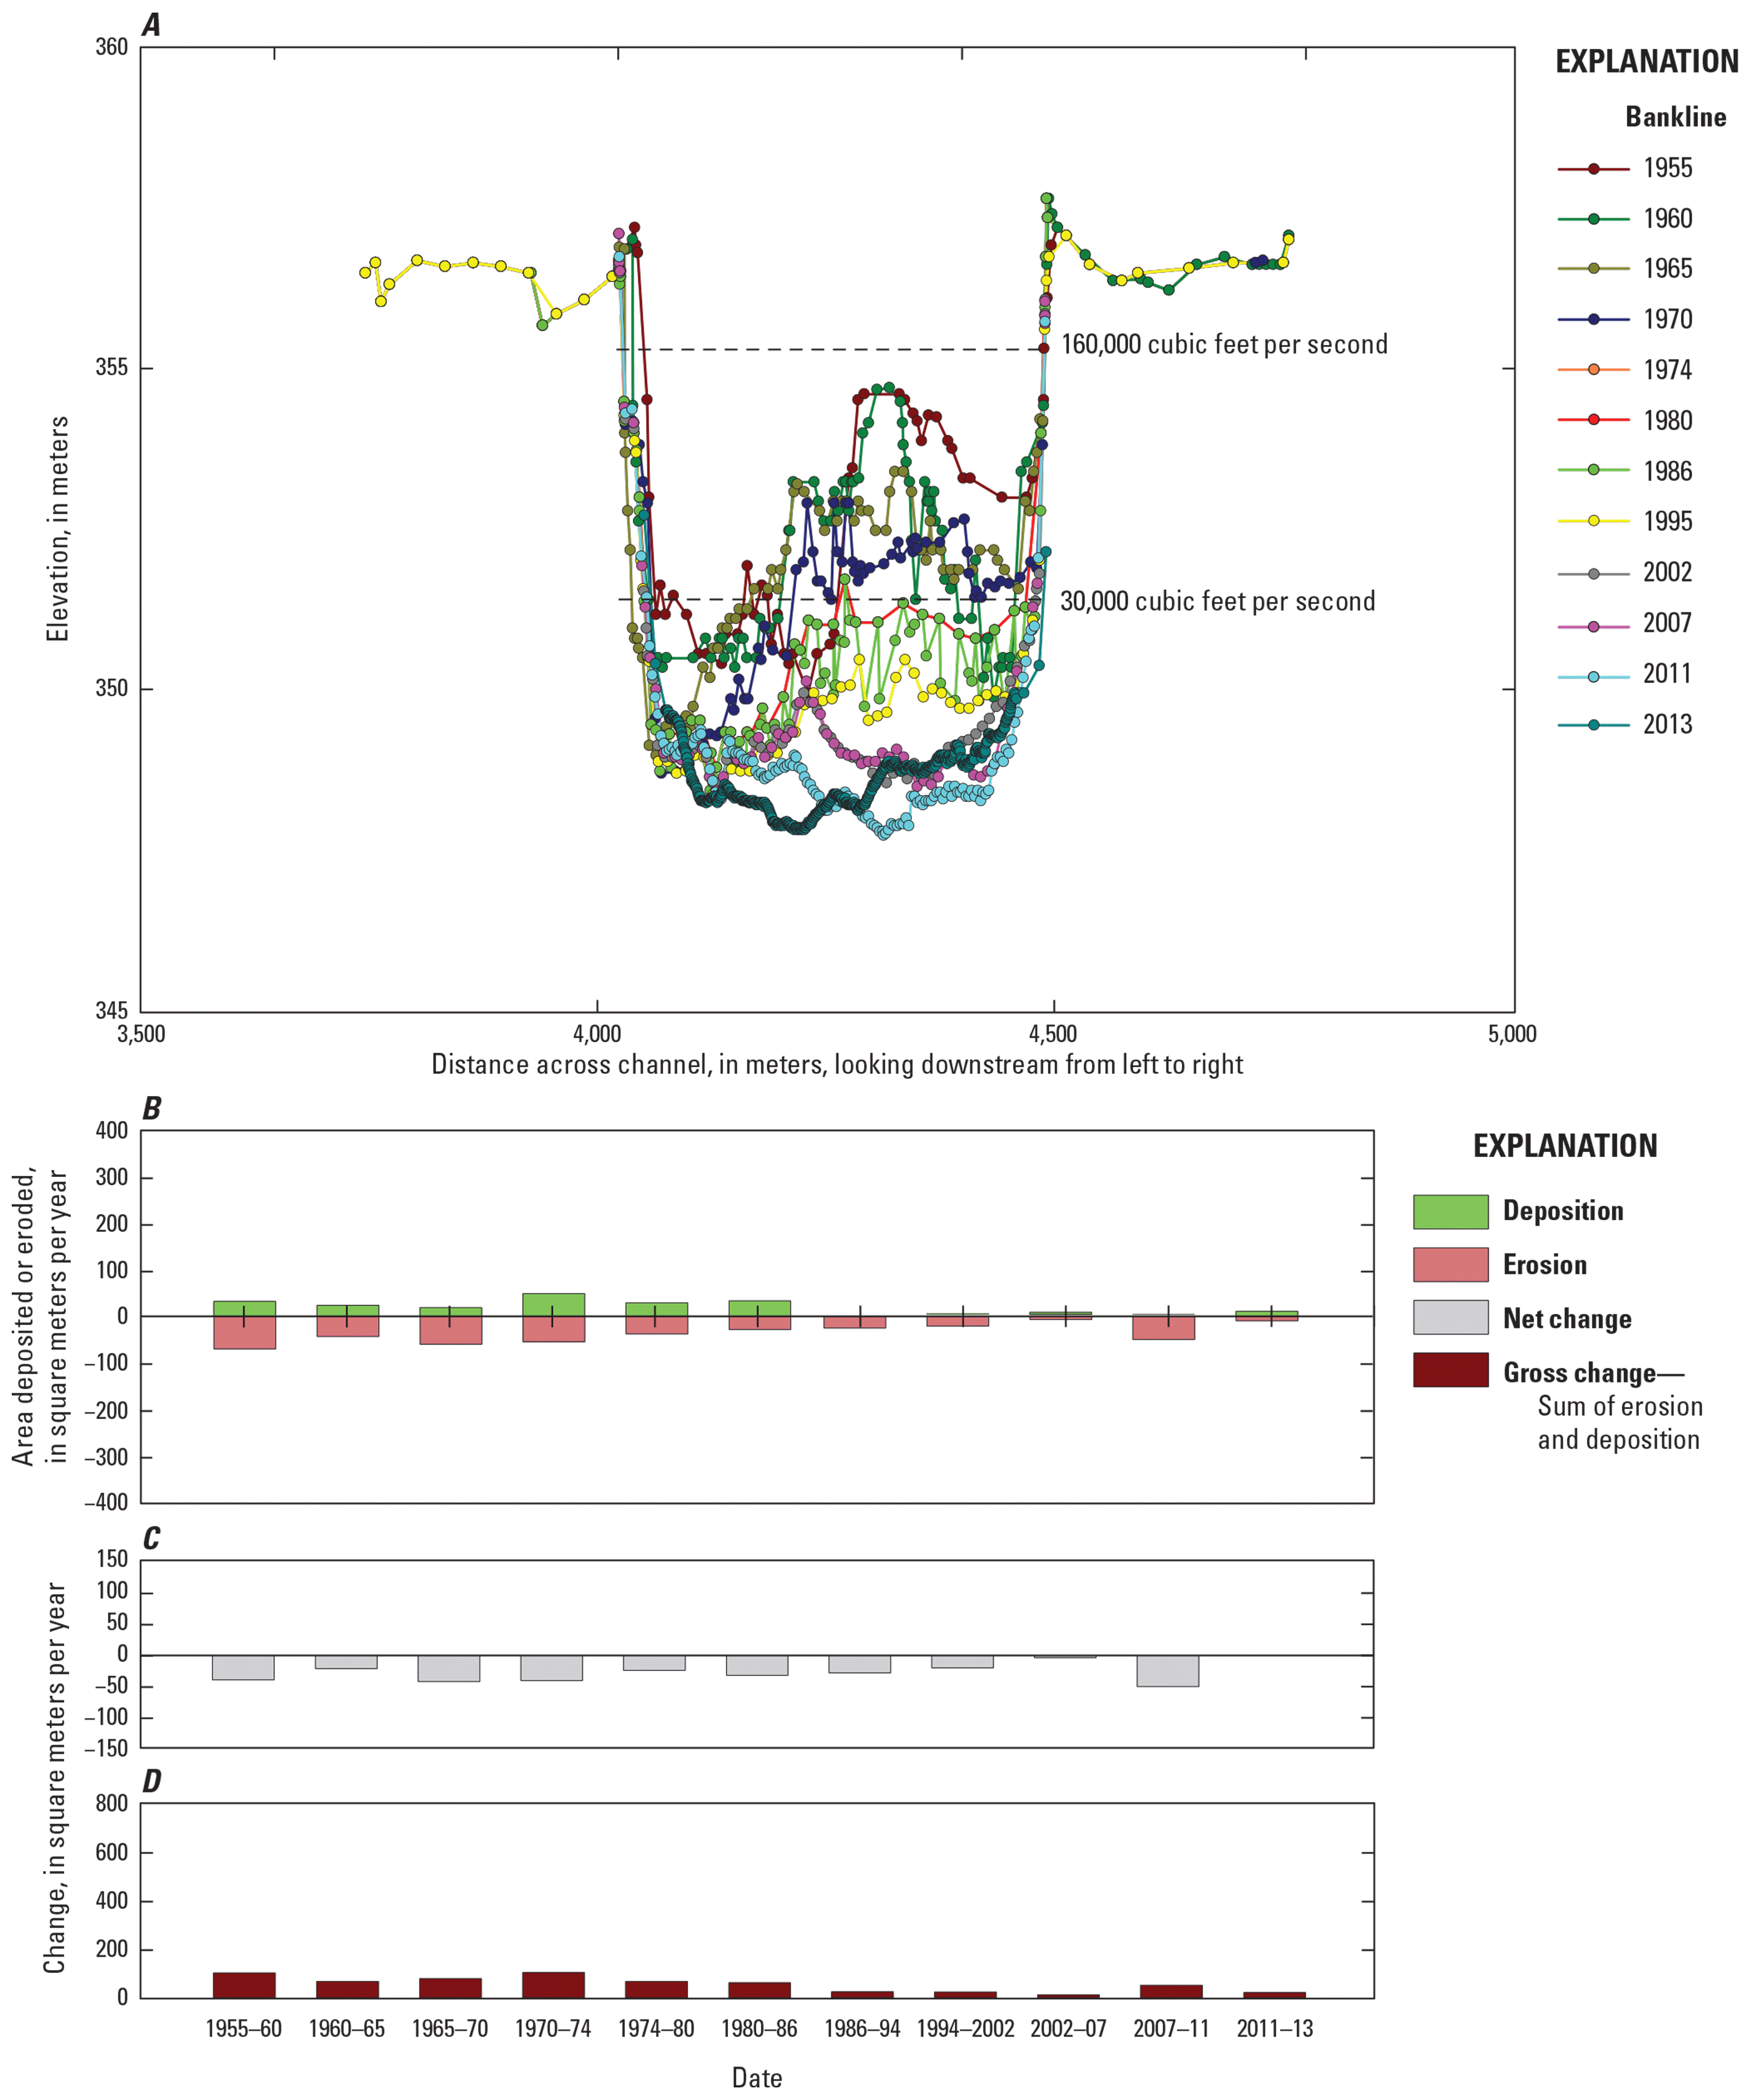
Channel changes at river mile 791.2, 31.8 kilometers downstream from Gavins Point Dam in the 59-mile segment of the Missouri National Recreational River. A, Cross section showing U.S. Army Corps of Engineers (USACE) surveys since dam closure. B, Amount of sediment deposited or eroded. C, Net change. D, Gross change between survey years. Water-surface elevations are from USACE HEC–RAS modeling. At the time of publication, the USACE data were not publicly available.
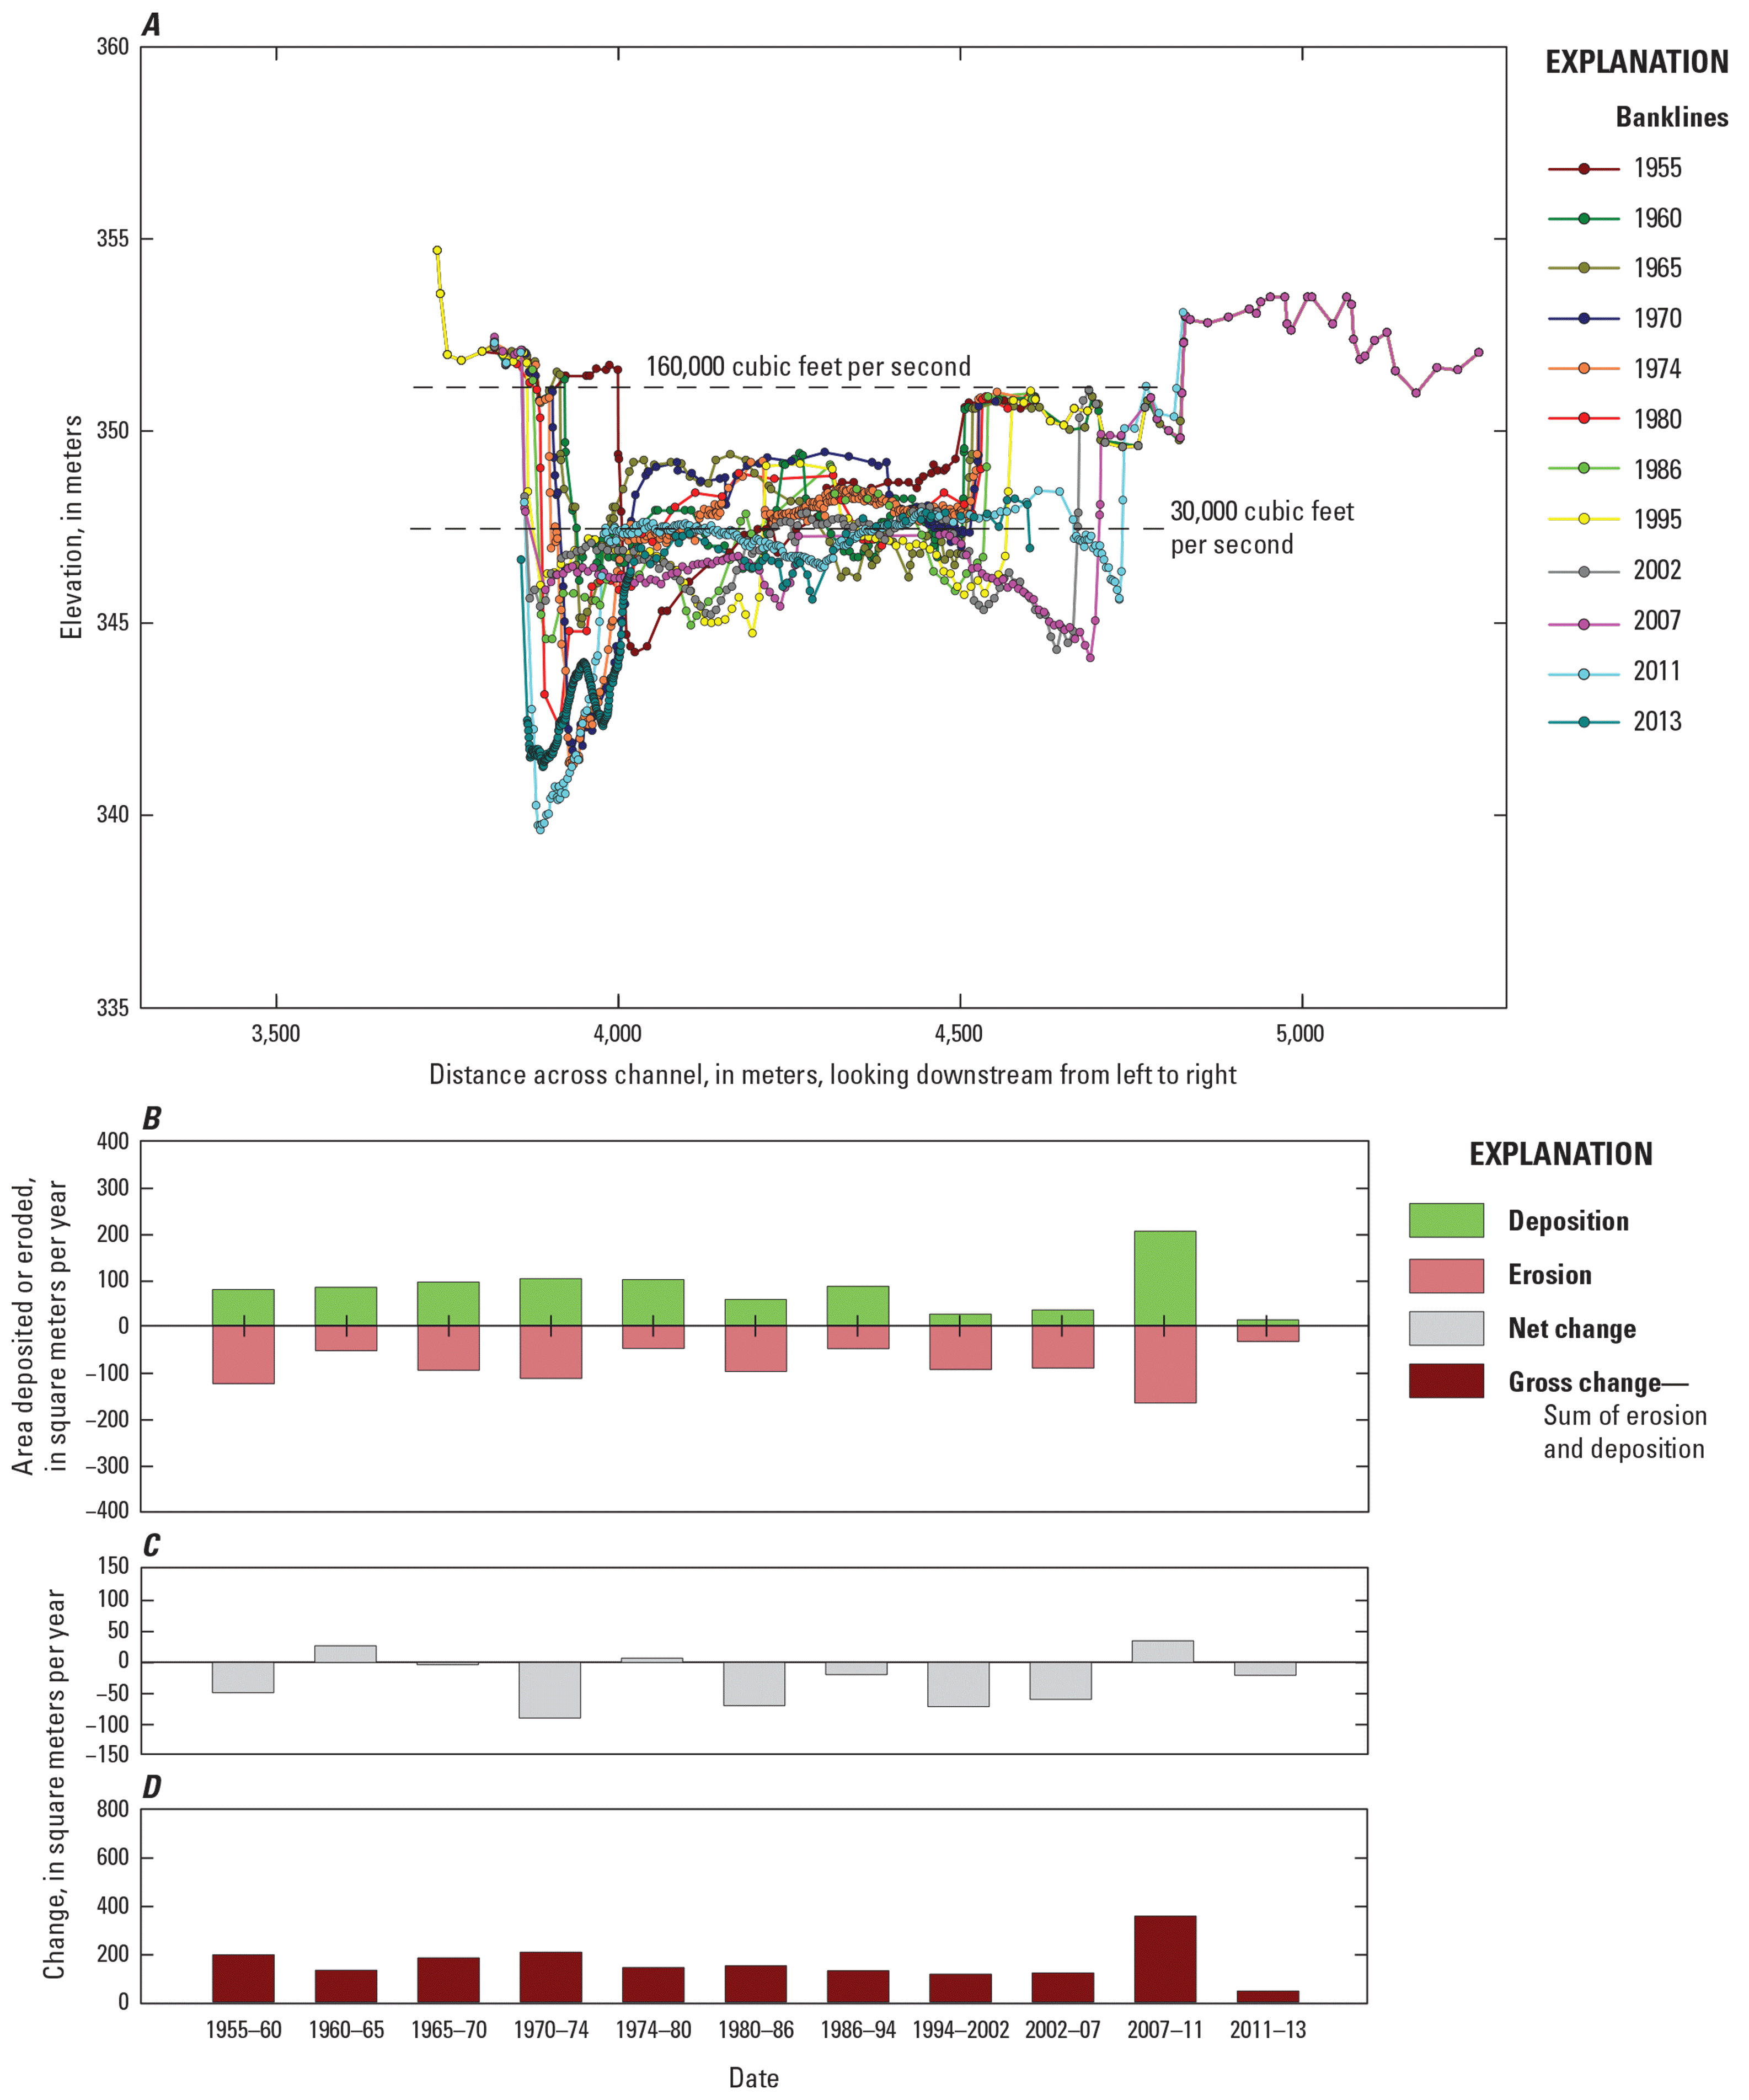
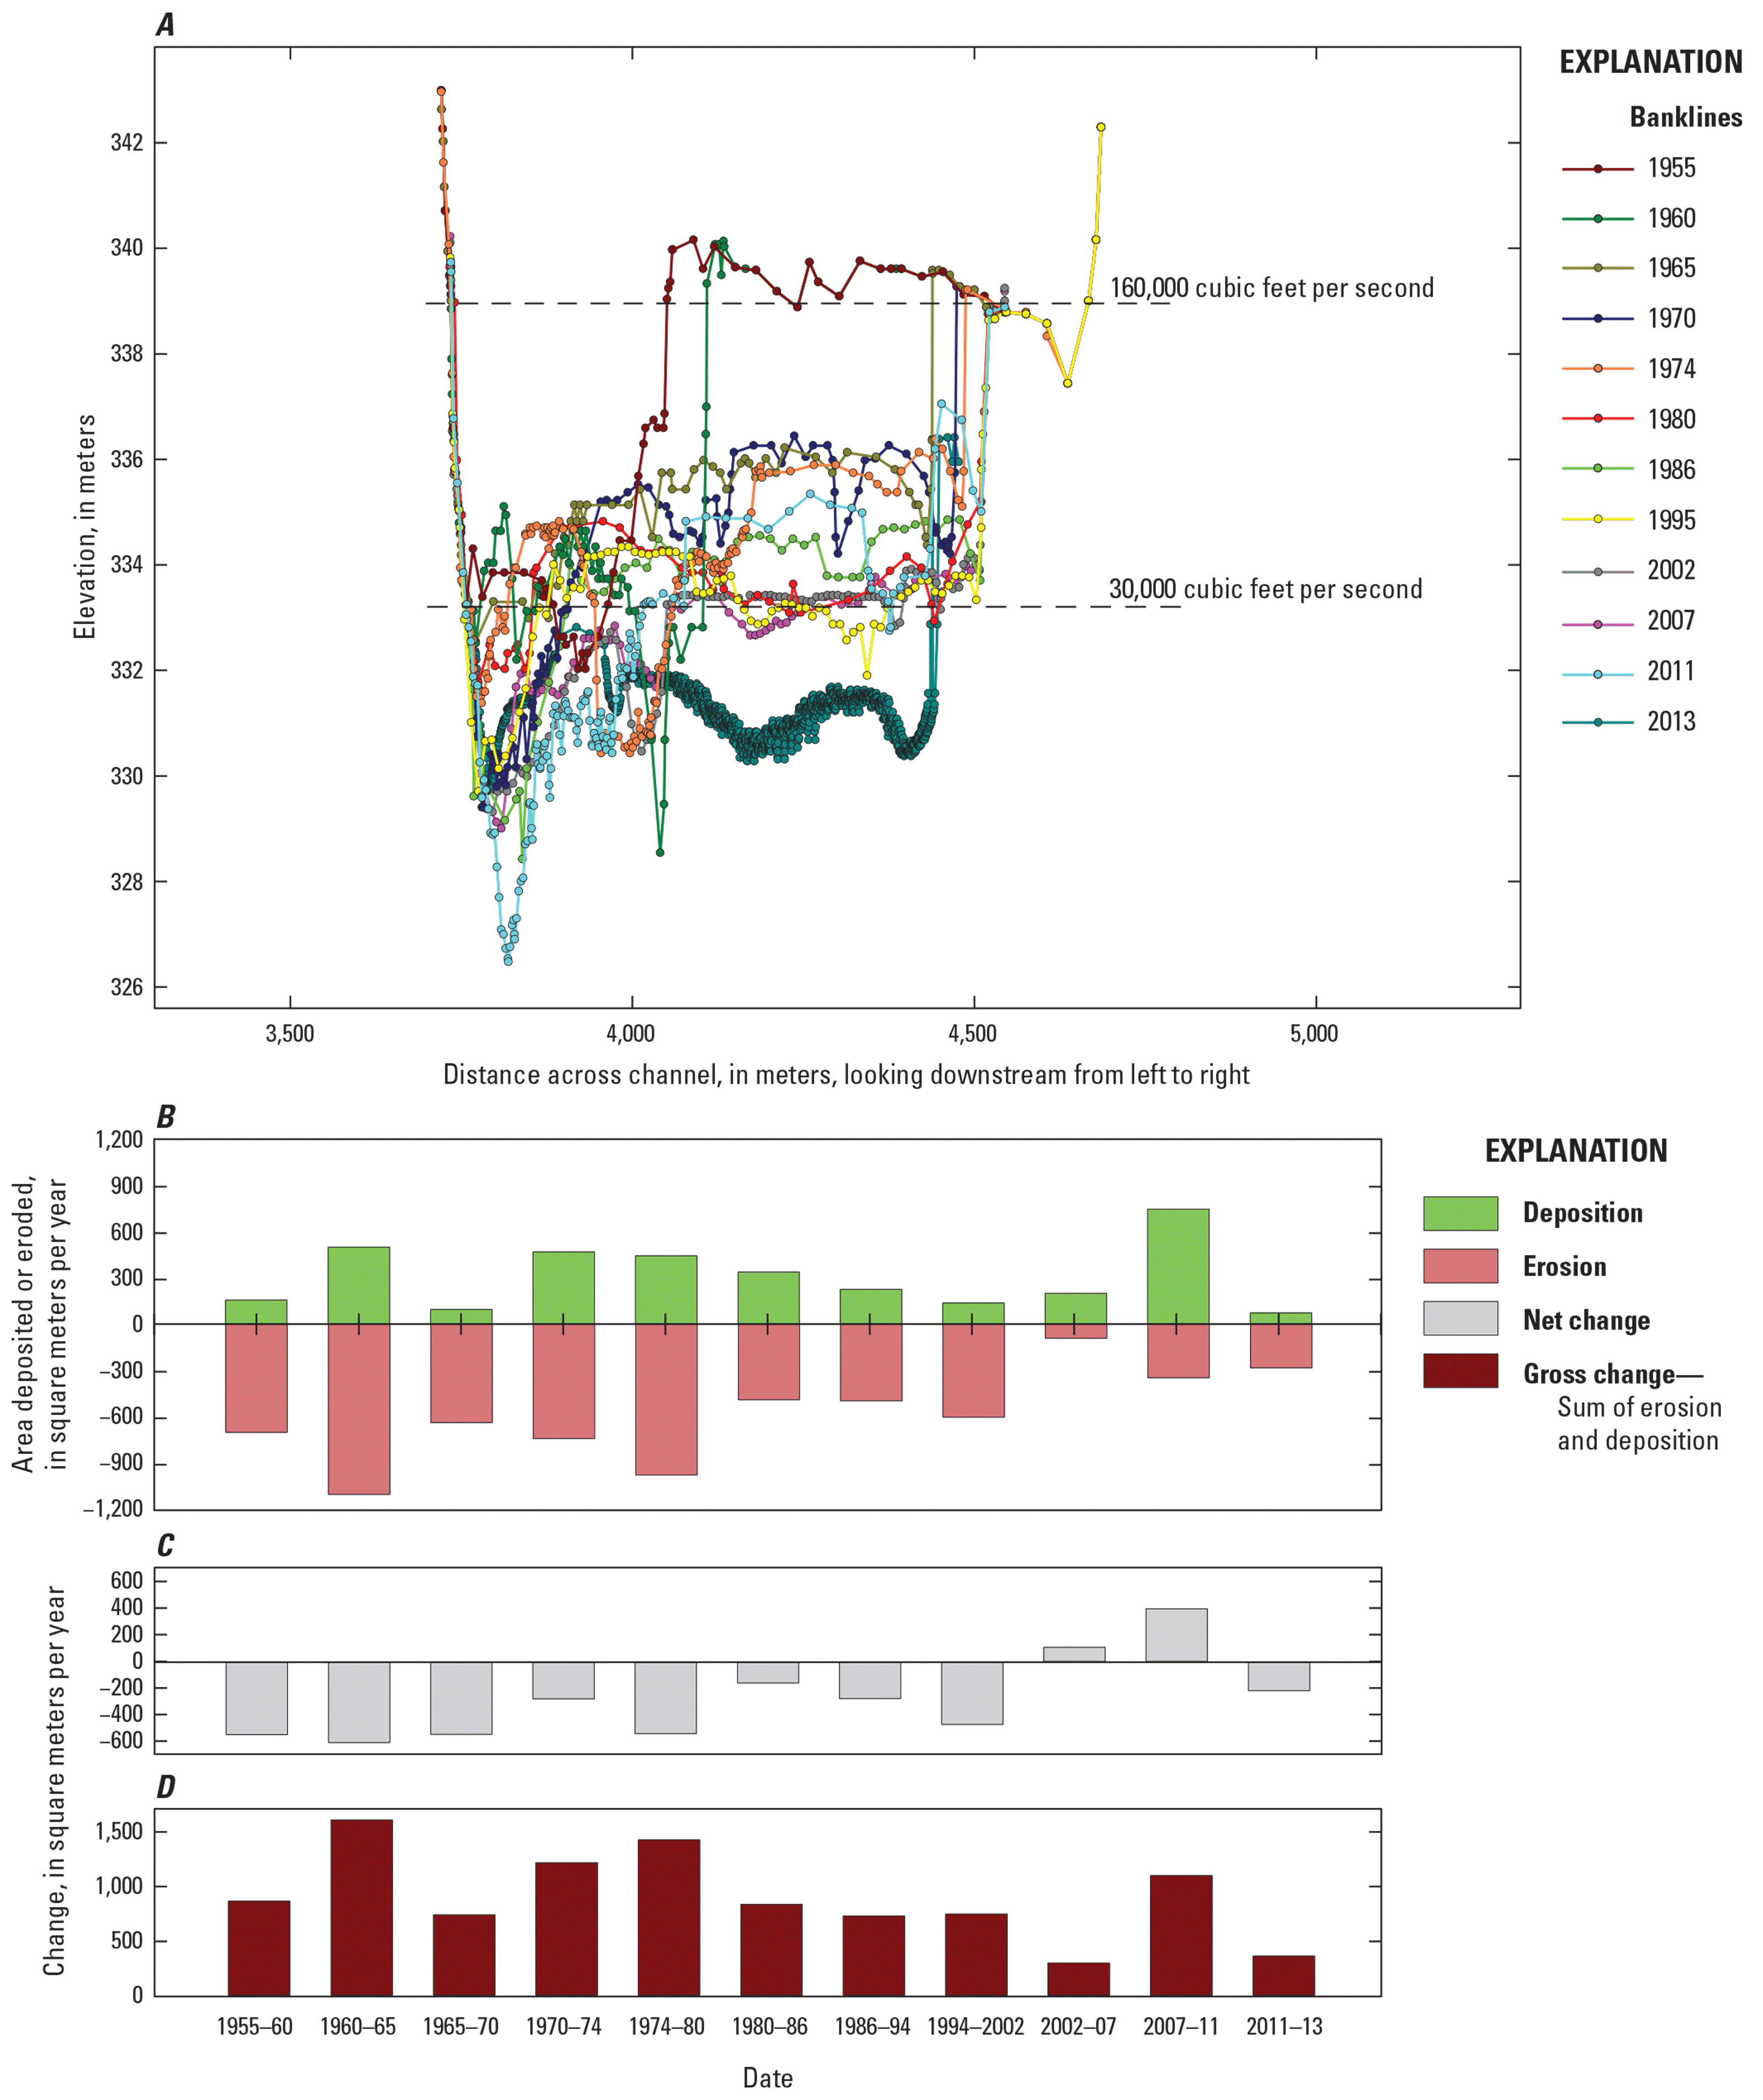
Channel changes at river mile 771.2, 64 kilometers downstream from Gavins Point Dam in the 59-mile segment of the Missouri National Recreational River. A, Cross section showing U.S. Army Corps of Engineers (USACE) surveys since dam closure. B, Amount of sediment deposited or eroded. C, Net change. D, Gross change between survey years. Water-surface elevations are from USACE HEC–RAS modeling. At the time of publication, the USACE data were not publicly available.
Channel changes at river mile 753.2, 92 kilometers downstream from Gavins Point Dam in the 59-mile segment of the Missouri National Recreational River. A, Cross section showing U.S. Army Corps of Engineers (USACE) surveys since dam closure. B, Amount of sediment deposited or eroded. C, Net change. D, Gross change between survey years. Elevation data from 2013 is approximately 70 meters downstream from the cross section and in approximately the same orientation. Water-surface elevations are from USACE HEC–RAS modeling. At the time of publication, the USACE data were not publicly available.
39-Mile Segment
In the 39-mile segment, from 1955 to 2011, cross sections closer to the dam (fig. 9) show consistently higher rates of erosion compared to downstream (figs. 8A, 10–11). Erosion rates begin to decrease around river mile 865, and although there is some cross-section variability, mean erosion rates continue to decrease to the confluence with the Niobrara River at river mile 844 (figs. 8A, 9–11, table 9). Total gross change from 1955 to 2011, a measure of cross section dynamics, is the total amount of erosion and deposition at each cross section averaged by the total number of years. Cross sections that have the most gross change are further from the dam and closer to the Niobrara River (fig. 8B). When averaged among cross sections and years, results indicate the 39-mile segment from river mile 879 to 844 had erosion rates of similar magnitudes every time period, with the highest rates occurring in 1955–60, 1970–75, and 2007–11 (fig. 19A). There was net erosion for every time period (between −16.9 and −35.6 m2/yr per cross section) except 1985–95 and 1995–2007, although those rates were low (7.6 and 3.7 m2/yr per cross section) (fig. 19A). In all time periods, erosion and deposition occurred; net erosion occurred in 64 percent of the cross sections across all time periods (table 10). The largest amount of total geomorphic work, or gross change (sum of erosion and deposition), in mean area per cross section per year was higher in 1955–60 (165 m2/yr per cross section), 1970–75 (155 m2/yr per cross section), and 2007–11 (255 m2/yr per cross section). The large increase in deposition and erosion between 2007 and 2011 corresponds to the time period that brackets the high-flow event of 2011 and marked a considerable increase after a trend of decreasing amounts of deposition and erosion for several decades (fig. 19A; table 9).
Channel width in all cross sections in the river portion of the 39-mile segment either did not change or increased moderately for all time periods (table 11). The average increase in channel width was 67 m. Most widening occurred in the first 20 years of the post-dam period from 1955 to 1975, during which channel width increased at 8 percent per year. That rate slowed to 2 percent from 1975 to 1995 and to 1 percent from 1995 to 2011 (table 11).
Table 11.
Percent of cross sections in the river portion of the 39-mile segment and the 59-mile segment of the Missouri National Recreational River with trend in channel width change for time periods.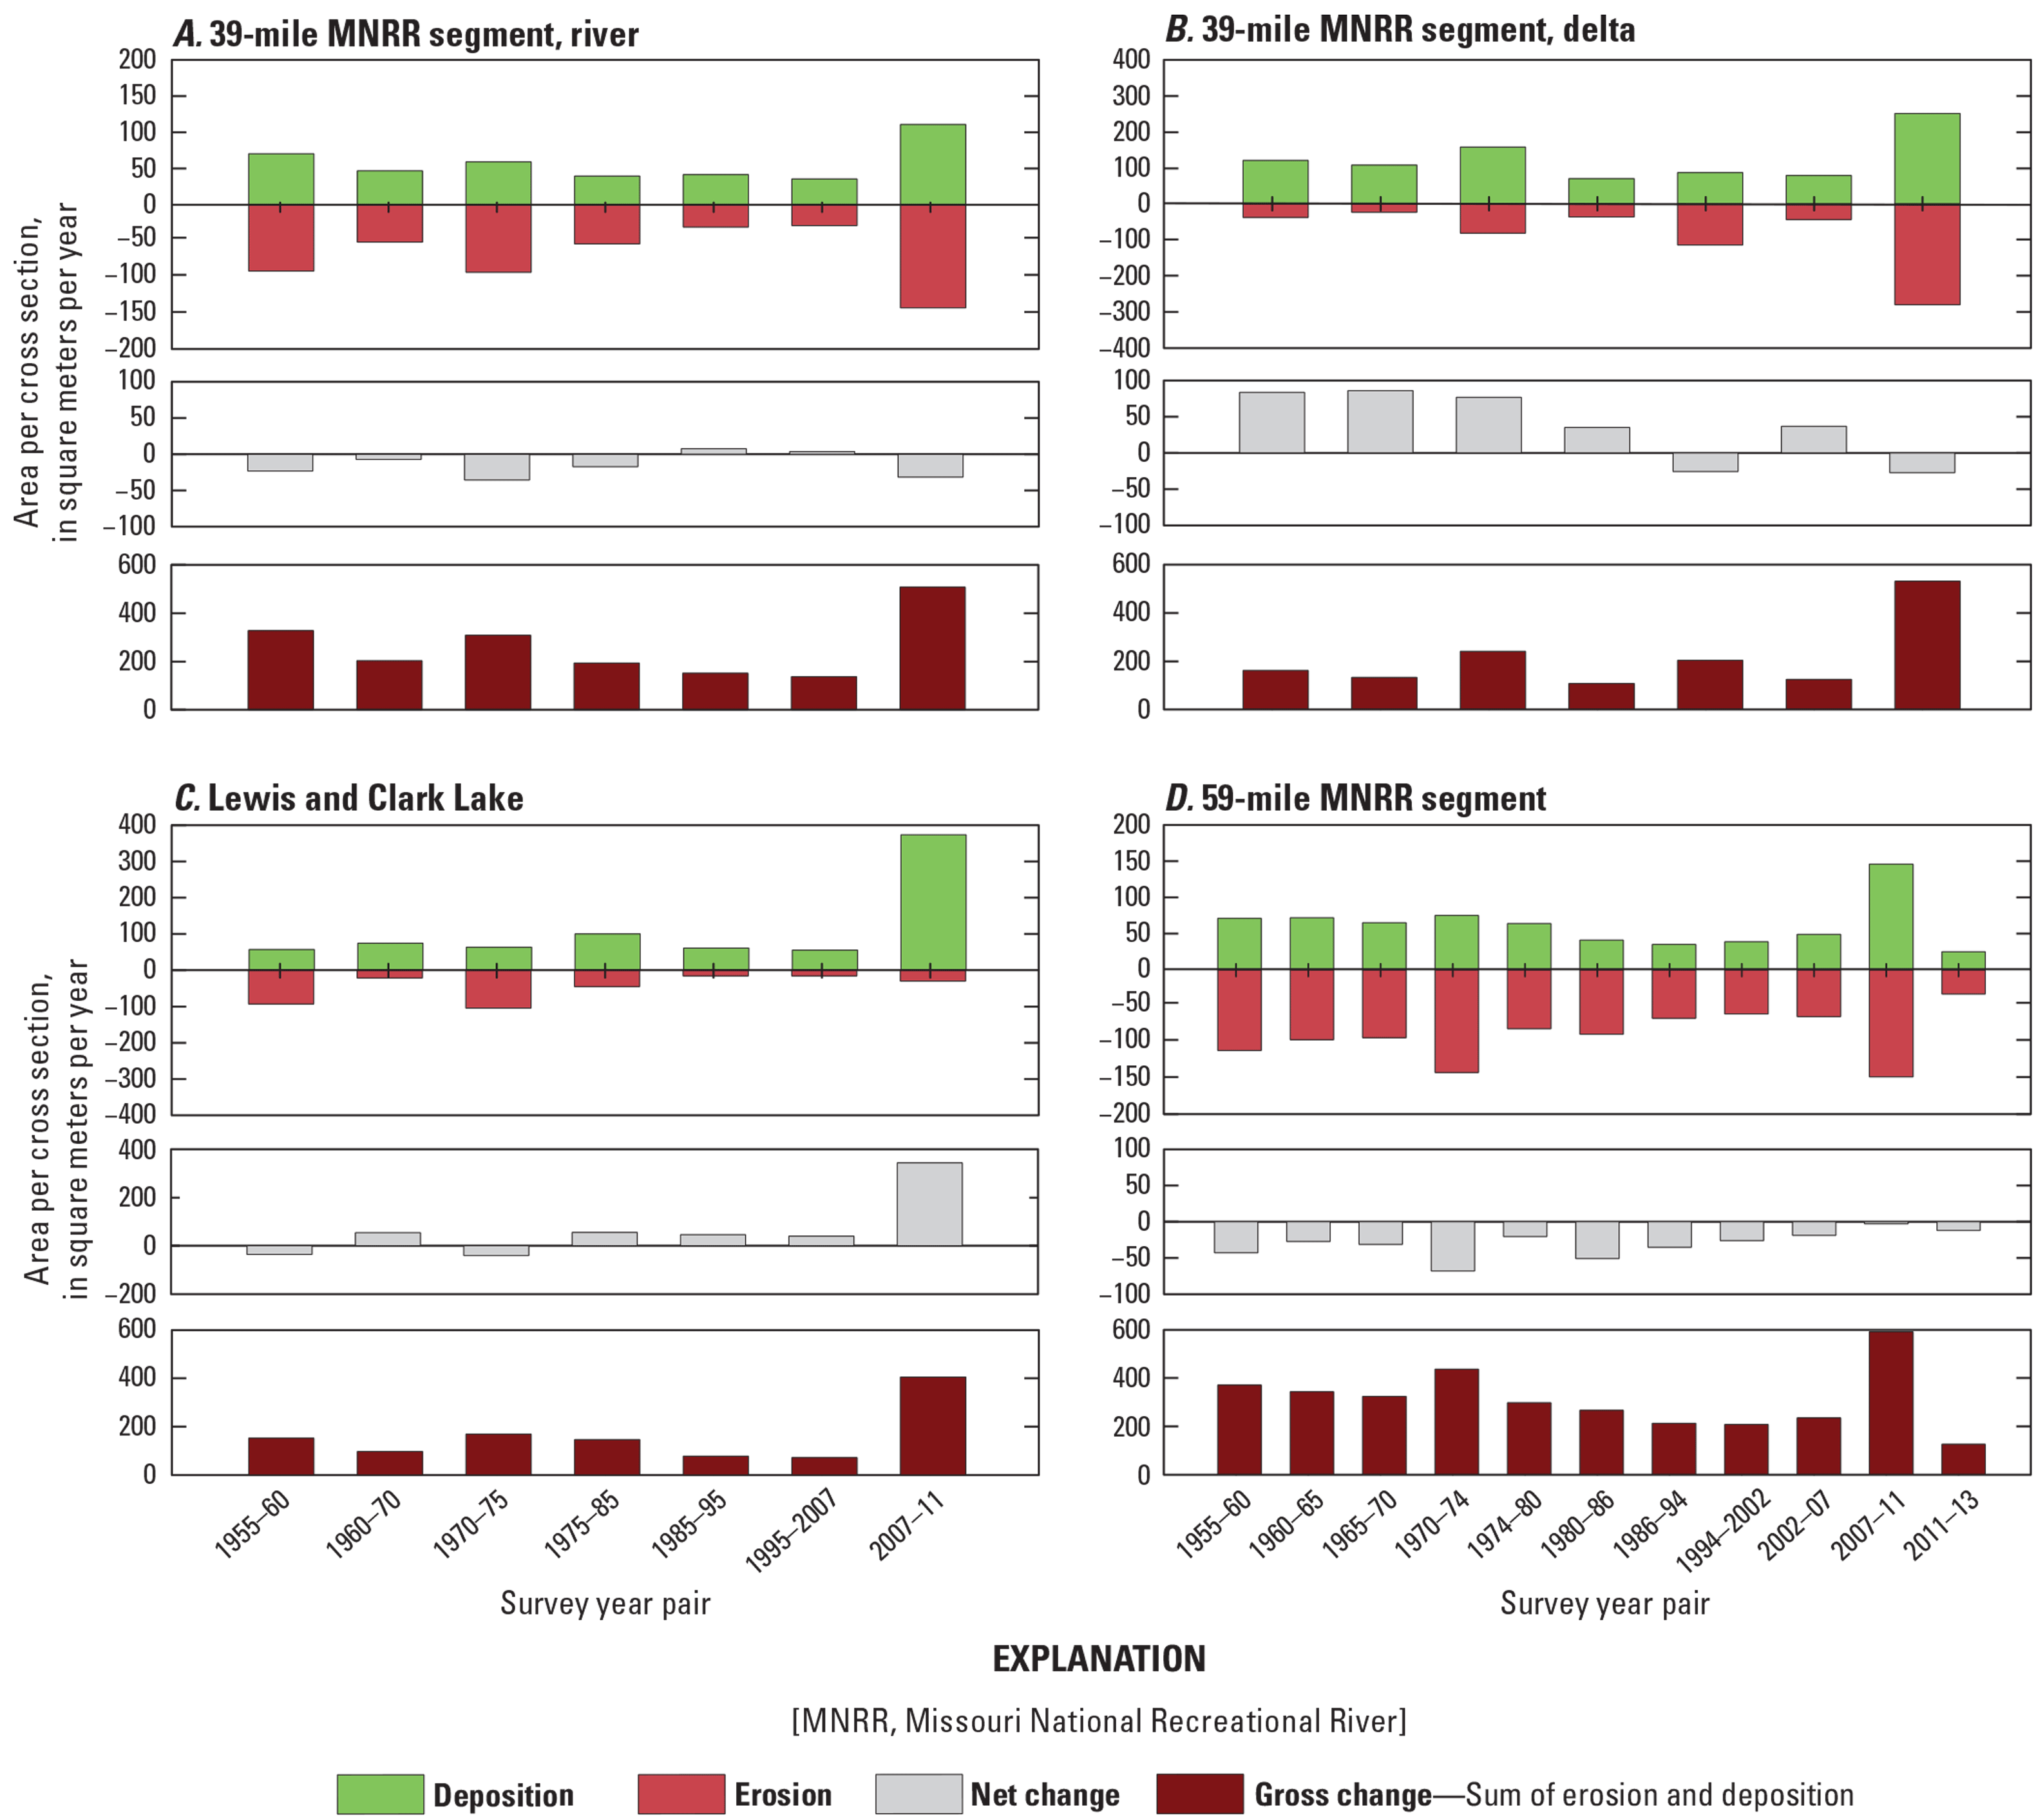
Summary of cross-section erosion and deposition, net change, and gross change for the Missouri River segments through time. A, 39-mile Missouri National Recreational River (MNRR) segment, river mile 987.6–844. B, 39-mile MNRR downstream segment and Lewis and Clark Lake Delta, river mile 844–826. C, Lewis and Clark Lake, river mile 826–811. D, 59-mile MNRR segment, river mile 811–752.
Delta
In the Lewis and Clark Lake Delta, which includes the confluence region of the Niobrara River at river mile 843.5 (fig. 4), trends in deposition and erosion since dam closure were markedly different than upstream of the Niobrara River confluence (fig. 8A). Total gross change from 1955 to 2011 was higher than in the reach upstream of the Niobrara River (fig. 8B). On average, cross sections had net deposition since 1955 (fig. 19B; tables 9, 10). Substantial changes in channel geometry have occurred near the Niobrara River confluence, where the channel has moved considerably since dam closure (fig. 12). From dam closure until the 1985-1995 time period, over 90 percent of cross sections in the delta had net deposition (table 10). From 1995 to 2007 nearly a third of the cross sections had net erosion. In contrast, from 2007 to 2011 59 percent of the cross sections showed net erosion (table 10). Similar to the segment further upstream, the largest amount of geomorphic work (531.8 m2/yr per cross section) occurred from the 2011 flood; the 2007–11 time period had similar amounts of erosion and deposition (252.4 m2/yr per cross section and 279.4 m2/yr per cross section) (fig. 19B) and net erosion of 27.0 m2/yr per cross section.
Reservoir
Analysis of cross sections indicates that Lewis and Clark Lake has been mostly depositional since the closure of Fort Randall and Gavins Point Dams (figs. 8A, 13–14). Cross sections in the headwaters of Lewis and Clark Lake have been characterized by considerable spatial and temporal variation (fig. 13), whereas near the dam there has been uniform deposition (fig. 14). The largest depositional event occurred between 2007 and 2011 when sustained high flows from the 2011 flood moved sediment from the upstream river and delta into the reservoir (fig. 8A, 19C; table 10). Total gross change from 1955 to 2011 was higher closer to the Niobrara River and decreased downstream in the reservoir (fig. 8B). Deposition has outpaced erosion every time period except for 1955–60 and 1970–75 (fig. 14, 19C). Deposition rates have been fairly consistent and dropping slightly since 1975 until the 2001–11 time period (55.2 m2/yr per cross section from 1975 to 1985, 45.9 m2/yr per cross section from 1985 to 1995, and 39.7 m2/yr per cross section from 1995 to 2007, fig. 19). This rate increased by more than 8 times during the 2007–11 time period when 375.4 m2/yr per cross section was deposited, most of which was likely during the 2011 flood.
59-Mile Segment
In the 59-mile segment, mean cross-section area has increased through erosional processes since the closure of Gavins Point Dam (fig. 8A). Total gross change from 1955 to 2011 is lower close to the dam, increases around river mile 803, and then increases more again from river mile 780 to 760 (fig. 8B). In all intervals except 2011–13, more than 50 percent of cross sections had a net erosional trend; during some periods 90 percent of the cross sections had net erosion (table 9). Immediately downstream from the dam, the channel banks are confined by coarse rock revetment (fig. 15), which restricts lateral adjustment of the channel and focuses erosional energy vertically. The lack of sediment supply from the dam, coupled with the higher stresses in the reach immediately downstream, have caused the bed to coarsen (armor) from the dam to at least river mile 805 (Elliott and others, 2009) and USACE sampling indicates a trend of bed coarsening through time downstream from the dam to about river mile 795 (West Consultants Inc., 2002). The full extent and timing of bed armoring are not known. Farther downstream from the dam, and through most of the 59-mile segment, cross sections show substantial variability in channel geometry changes through time as banks retreat and sandbars deposit and erode (figs. 16–18). Analysis of cross sections indicates all time periods experienced both deposition and erosion, although erosion was the net trend in every time period, and the net rate of erosion decreased through time, suggesting the river is trending towards equilibrium (fig. 19D; table 10). The 2007–11 time period had the largest amount of erosion (149.6 m2/yr per cross section) and deposition (146.4 m2/yr per cross section). This time period also had the largest overall amount of gross geomorphic change, which was more than twice the rate of all time periods since 1974–80 (295.9 m2 per cross section per year) (table 9). This time period encompasses the 2011 flood and demonstrates that this large flood event eroded and deposited large amounts of sediment within the river segment. Net change during this time interval, however, was relatively low (−3.2 m2/yr per cross section), indicating reorganization of sediment within the segment was dominant over export from the segment (fig. 19D). A limited number of cross sections show that the post-2011 flood time period 2011–13 had lower erosion and deposition rates (erosion of 37.8 m2/yr per cross section and deposition of 25.5 m2/yr per cross section) but higher rate of net change (−12.3 m2/yr per cross section) than the 2007–11 time period (fig. 19D).
An analysis of bank retreat in the 59-mile segment cross-section dataset indicates average cross-section width increased in most cross sections from 1955 to 1974 and 1974 to 1994 (table 11). From 1994 to 2011, 47 percent of cross sections experienced no change, 45 percent widened, and 8 percent of the cross sections narrowed (table 11). The average percent change in channel width was highest from 1955 to 1974, 14 percent, when cross sections in the 59-mile segment widened an average of 108 m (table 11).
Cumulative Volume Changes
Cumulative volume-change plots decrease the variability in individual cross-section trends by spatially integrating cross-sectional area changes to emphasize overall trends, which are primarily erosional in river process domains and depositional in the delta and reservoir process domains (fig. 20). In the 39-mile segment, cumulative channel volumes decline across all years at all cross sections between the dam and river mile 860. Closer to the Niobrara River confluence, at river mile 844 the channel volume curves transition to positive slopes across all years, indicating a shift to bed aggradation. An anomalous increase in deposition occurred between 1985 and 1995 around river mile 860. From 2007 to 2011, which encompasses changes associated with the 2011 flood, there was a sharp increase in erosion near river mile 850, a fairly flat rate in the delta, and a sharp increase in deposition in Lewis and Clark Lake downstream from river mile 828, indicating export of sediment from the upstream river and delta segments into the reservoir (fig. 20).
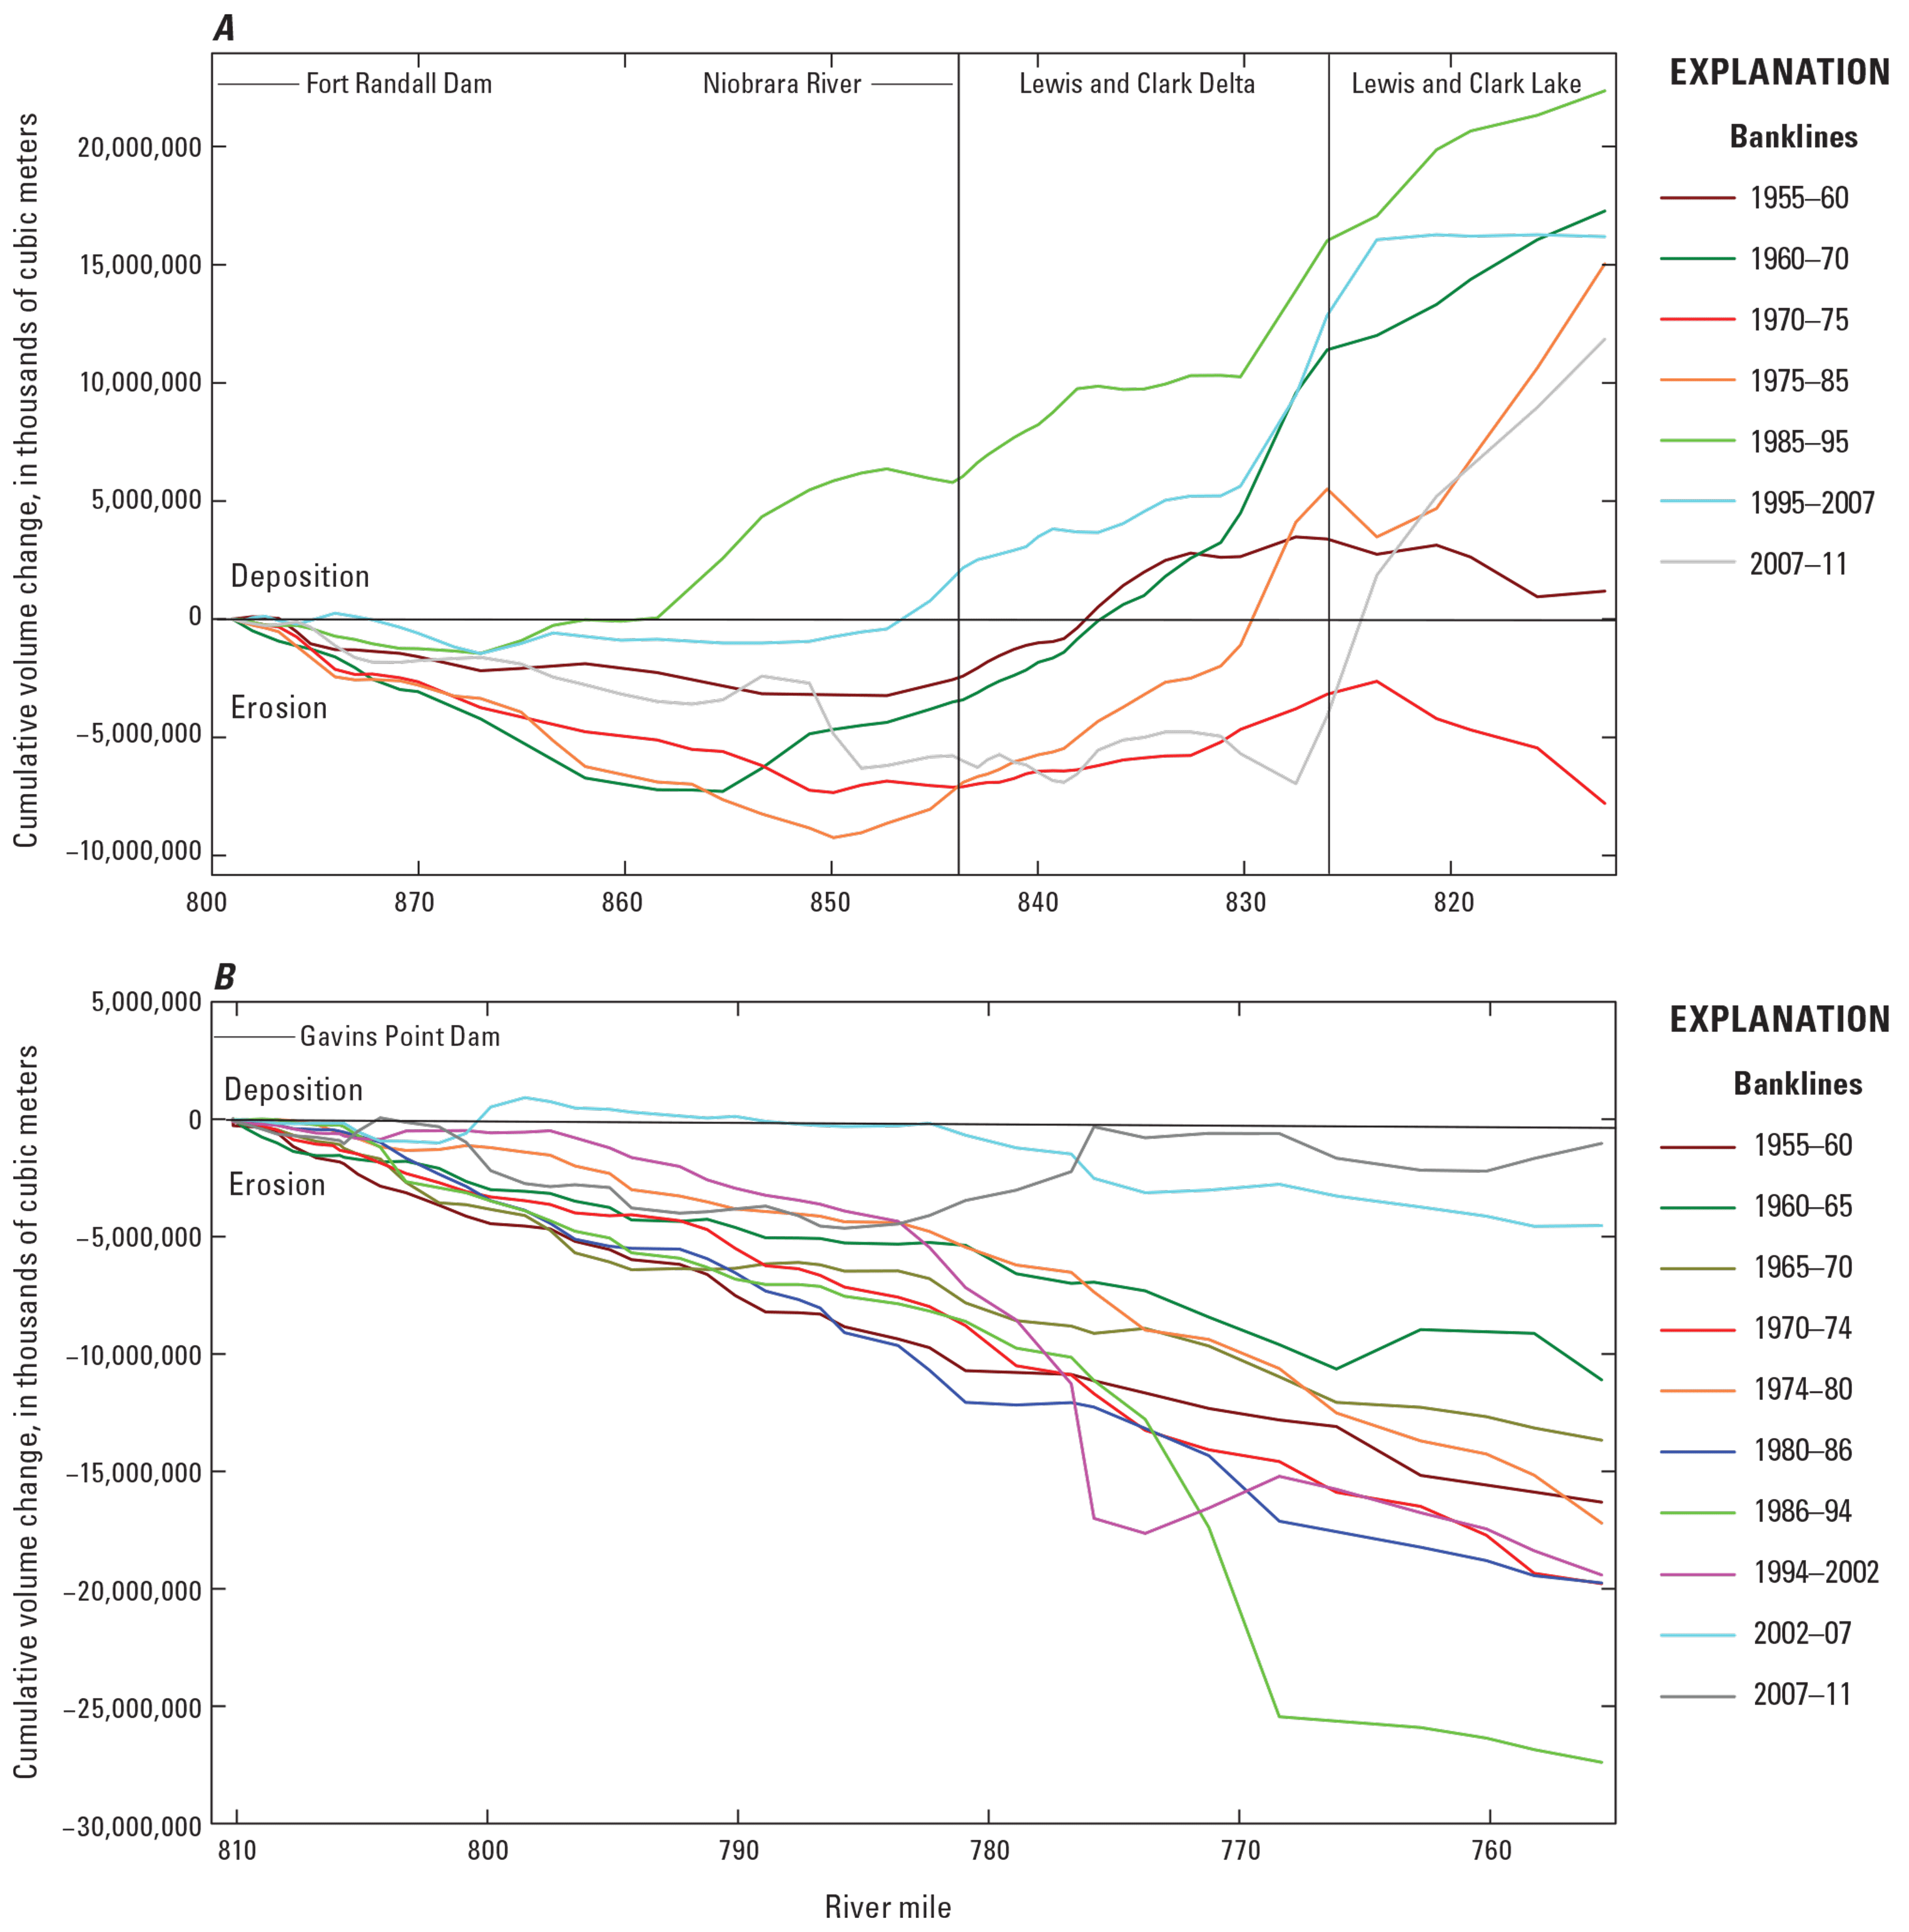
Cumulative volume change for cross sections surveyed by the U.S. Army Corps of Engineers from 1955 to 2011. A, Missouri National Recreational River (MNRR) segment, Lewis and Clark Lake Delta, and Lewis and Clark Lake. B, 59-mile MNRR segment.
Cumulative volume-change plots in the 59-mile segment show trends of bed erosion over time intervals and in the entire segment. The 2002–07 time period shows slight sediment aggradation between river mile 802 and 800, and negligible changes from river mile 800 to 820 (fig. 20). Likewise, from 2007 to 2011, sediment accumulated between river mile 784 and 775, with only minor changes in volume downstream (fig. 20). In some intervals there have been sharp increases in erosion volume, such as near river mile 776 from 1994 to 2002 and 768 from 1986 to 1994 (fig. 20). The overall modest cumulative volume change indicates that erosion and deposition were relatively equal in many cross sections even though the gross geomorphic work accomplished by the 2011 flood was high (fig. 19D).
Trends from the 2011 Flood
The 2011 surveys occurred within weeks after recession of the 2011 flood in both MNRR segments. Changes from 2007 to 2011 in the 59-mile segment demonstrate that the 2011 flood scoured the bed and deposited large sandbars (figs. 21B, 21D). Although there are limited bed-elevation data for other large flood events, large sandbars are visible in aerial photographs taken after the 1952, 1997, 2011, and 2019 flood events (table 2; fig. 22; see also Sweeney and others, 2019). There are limited data documenting the changes in channel geometry of these two river segments since 2011. The 2013 survey in the 59-mile segment has only 14 cross sections to compare with previous surveys but shows relatively low and similar rates of deposition and erosion (fig. 19). Cross sections surveyed in 2011 and 2013 show that this small net change in channel area between time periods was caused by sediment to deposition in deeper parts of the channel and erosion of sandbars deposited by the 2011 flood (fig. 21).
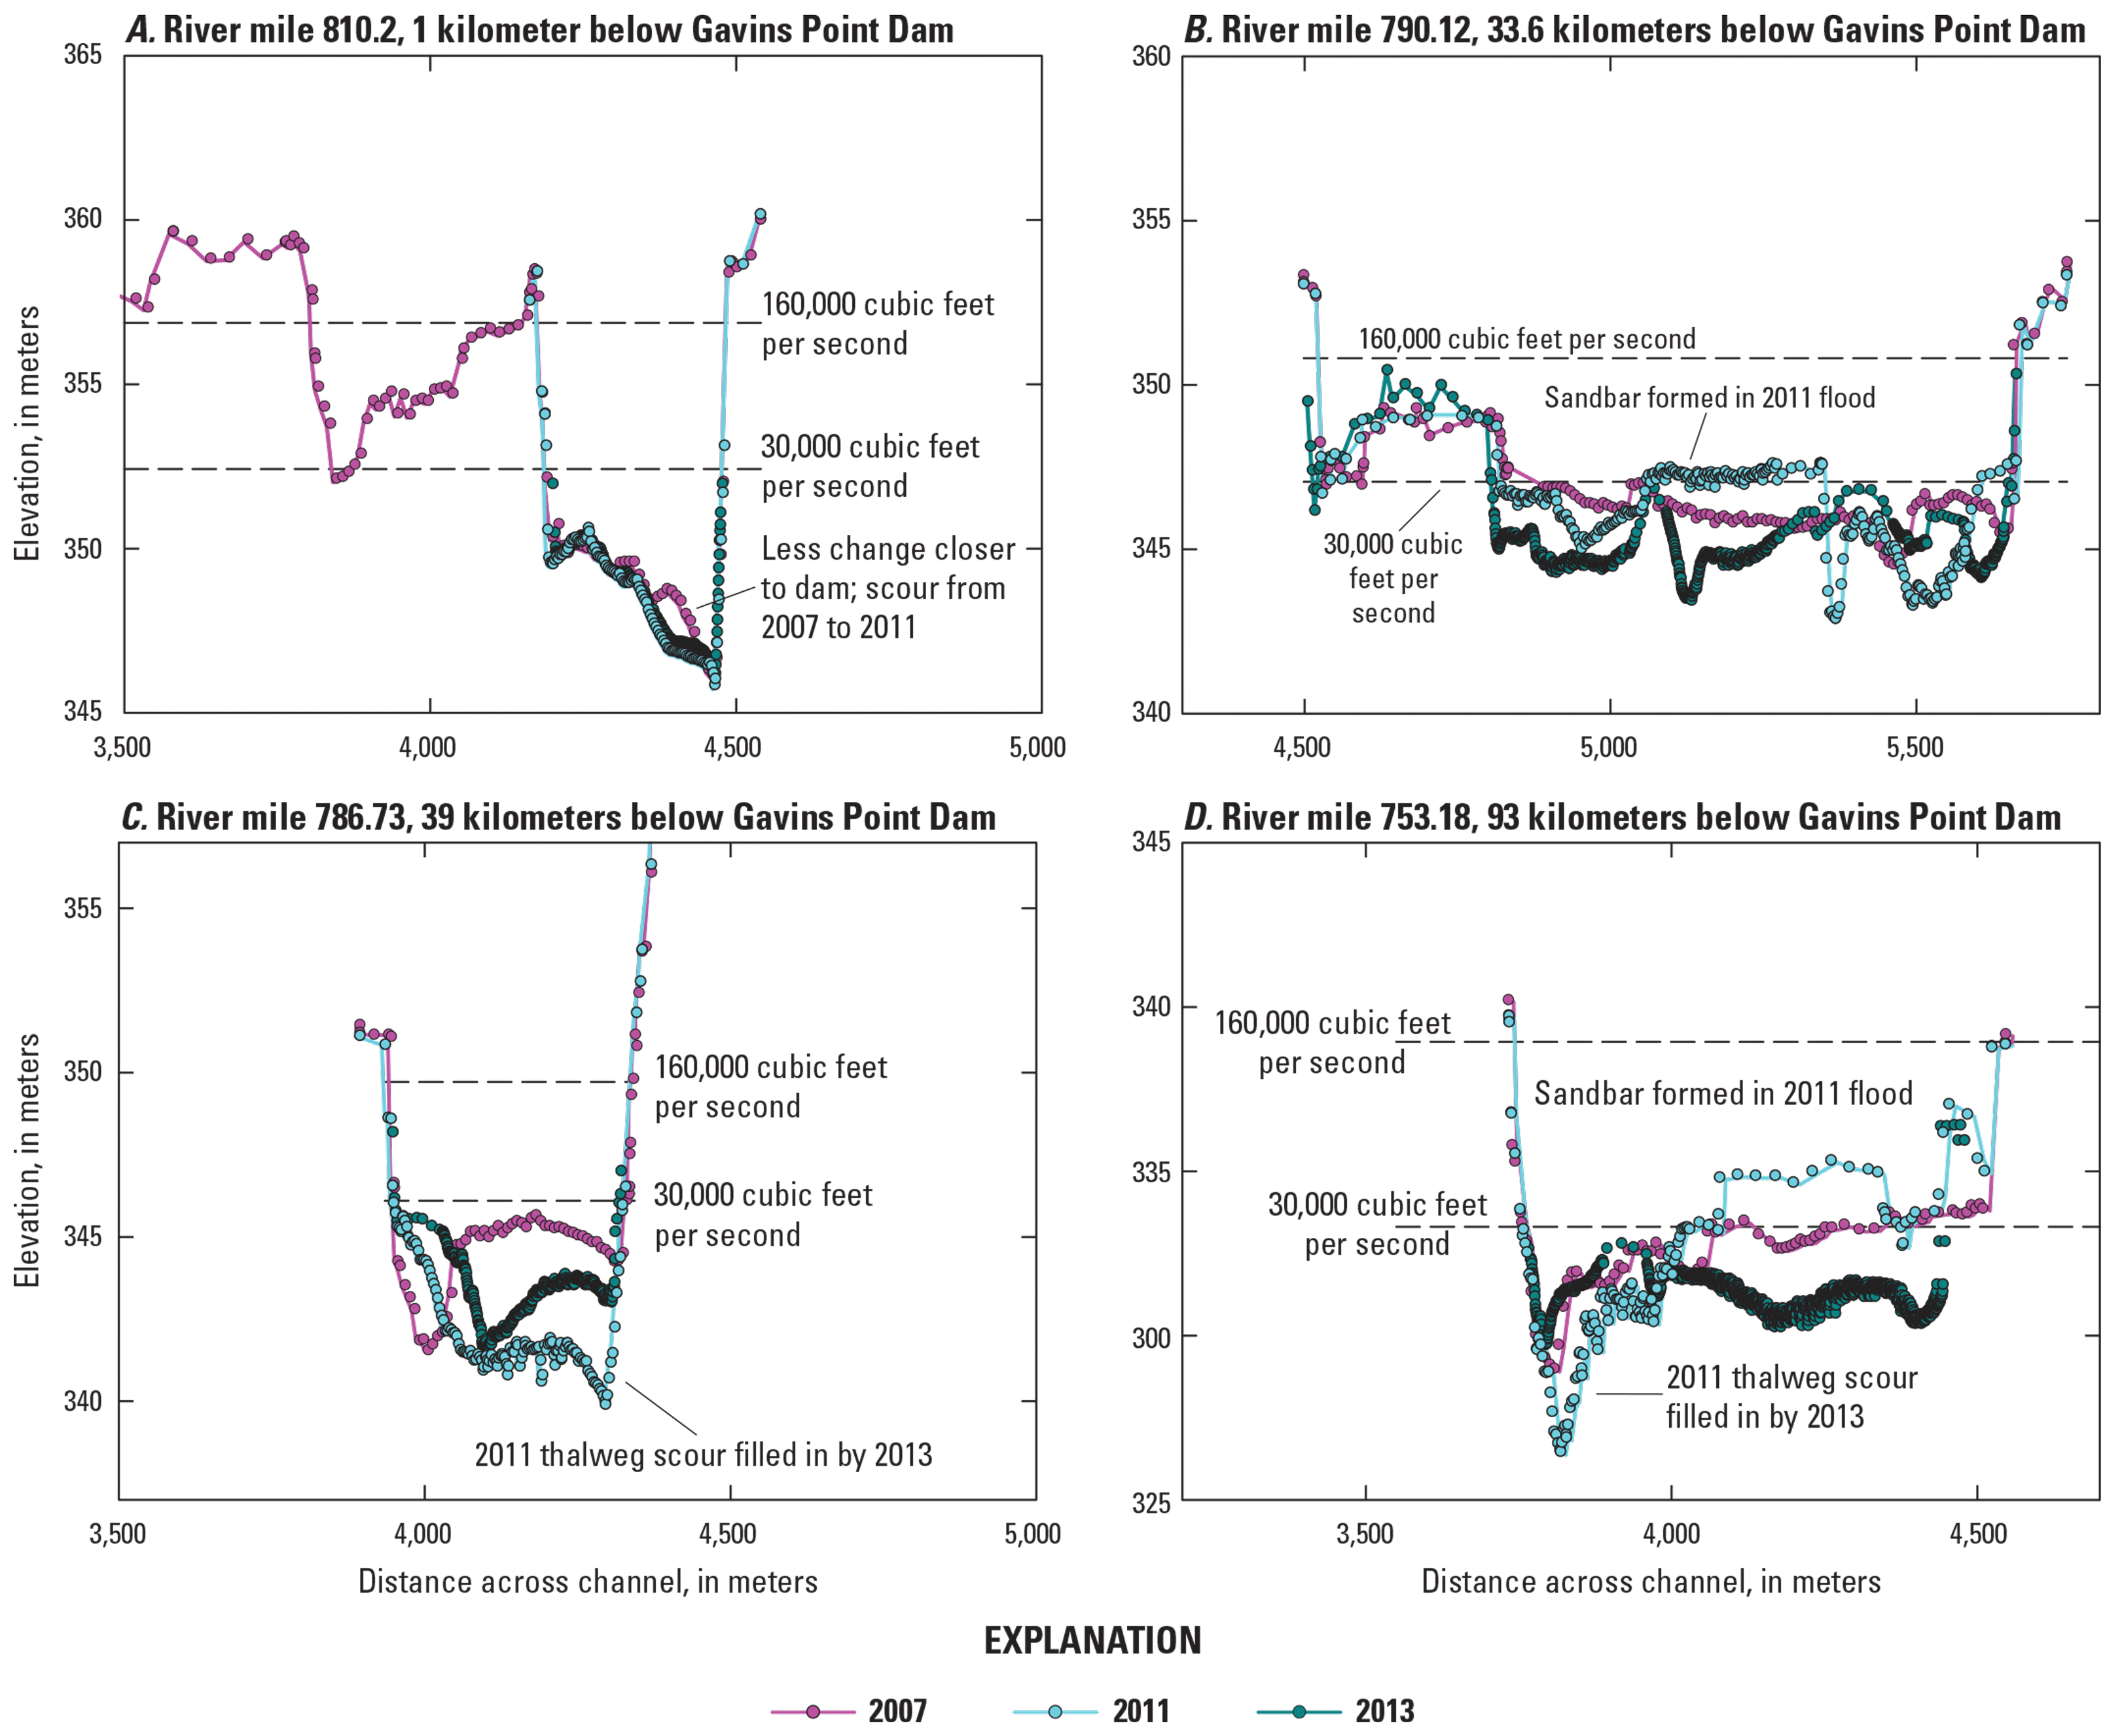
Selected cross sections in the 59-mile segment of the Missouri National Recreational River showing cross sections surveyed in 2007, 2011, and 2013 bracketing the 2011 high-flow event. A, The 2013 survey line at river mile 810.2 is oriented parallel and approximately 40 meters upstream from historic cross section. B, The 2013 survey line at river mile 790.12 is oriented parallel and approximately 10 meters upstream from historic cross section. C, The 2013 survey line at river mile 786.7 is oriented parallel approximately 70 meters upstream from historic cross section. D, The 2013 survey line at river mile 753.18 is oriented parallel approximately 70 meters downstream from historic cross section.
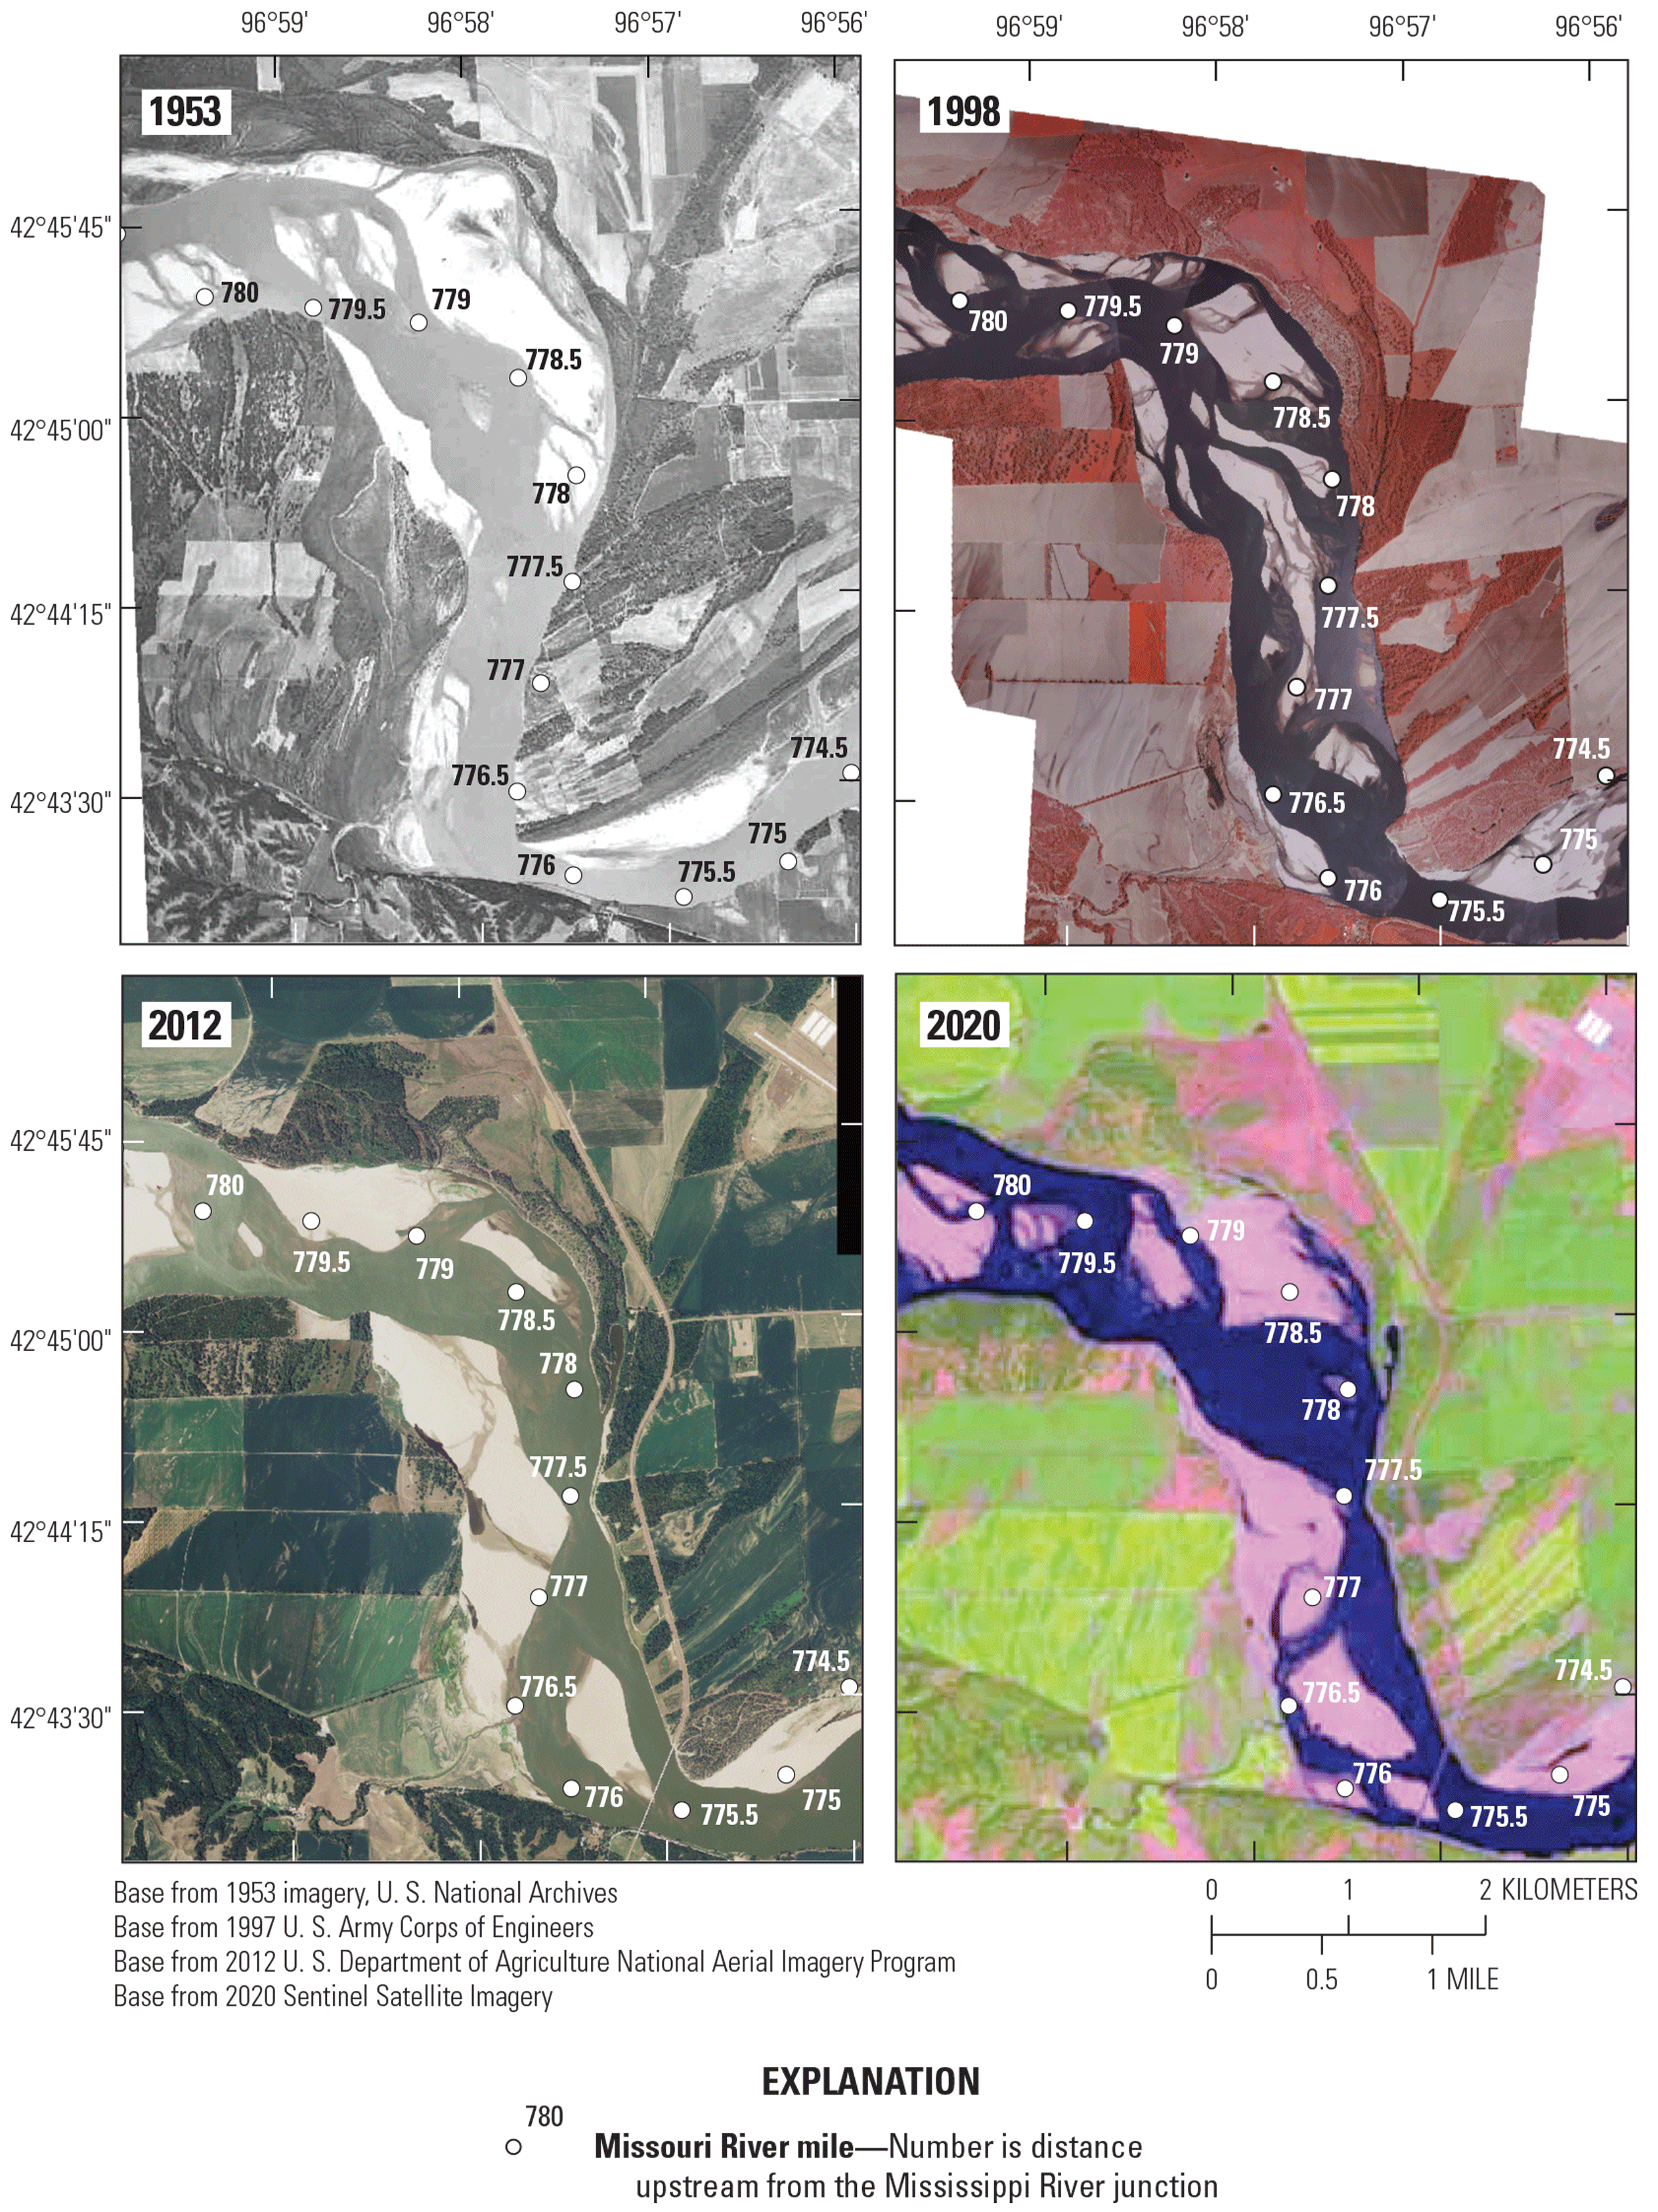
Large emergent sandbars exposed in a selected section of the 59-mile segment of the Missouri National Recreational River in the years following high-flow events in 1953, 1998, 2012, and 2020.
Thalweg-Elevation Trends
Channel thalweg elevation observed at monitoring cross sections has decreased since dam closure downstream from Fort Randall and Gavins Point Dams, but the magnitudes and rates of bed incision differ between the two MNRR segments. In this report, the term “aggradation” refers to net accumulation of river bed sediment, or a rise in bed elevation, and the term “incision” refers to net erosion of river bed sediment or a decreased in bed elevation. Incision of the channel thalweg has created a channel with high banks and disconnected the channel from its pre-dam flood plain for most post-dam discharges.
For the period of record 1955–2011 in the 39-mile segment upstream from the Niobrara River, the rate of thalweg bed-elevation change varies by cross section but trends towards net incision (fig. 23). There has been an average of 2.2 m of bed incision for the first 10 miles downstream from Fort Randall Dam, a mix of aggradation and incision near the Niobrara River and in the Lewis and Clark Lake Delta, and aggradation of as much as 5.8 m in Lewis and Clark Lake. The 59-mile segment has a net trend of thalweg bed incision in every cross section for its entire length between 1955 and 2011. Average thalweg incision is approximately 3.5 m in the 59-mile segment (fig. 23), and incision greater than 5 m was measured in six cross-section locations, including the downstream-most cross section near Ponca State Park.
The temporal rates of thalweg elevation change have similar trends but demonstrate the variability within segments and over time (fig. 24). In the 39-mile segment, the river channel, delta, and Lewis and Clark Lake have rates of change that were moderate until about 1970, stayed relatively low until 2007, and then increased again during 2007–11 after the 2011 flood. This relatively stable rate of change prior to the 2011 flood in the 39-mile segment, delta, and lake contrasts with the 59-mile segment, where the rate of thalweg elevation change was highly variable across entire period of record (fig. 24). At the subsegment scale, in the 59-mile segment, there has been less variability in the rate of change within 15 km of the dam; the standard deviation of thalweg change was 0.15 m/yr compared to 0.35 m/yr farther downstream (fig. 25). From 1990 to 2011, the rate of change was more stable, with standard deviation of 0.09 m/yr, which was much less than any time period and compared to other areas farther downstream, with a standard deviation of 0.28 m/yr (fig. 25). For the portion of the 59-mile segment that is more than 15 km downstream from the dam, variability peaked in the 1980s (standard deviation of 0.48 m/yr) and decreased until the 2007–11 time period. During the 2007–11 time period, the rate of change increased in all cross sections (fig. 25).
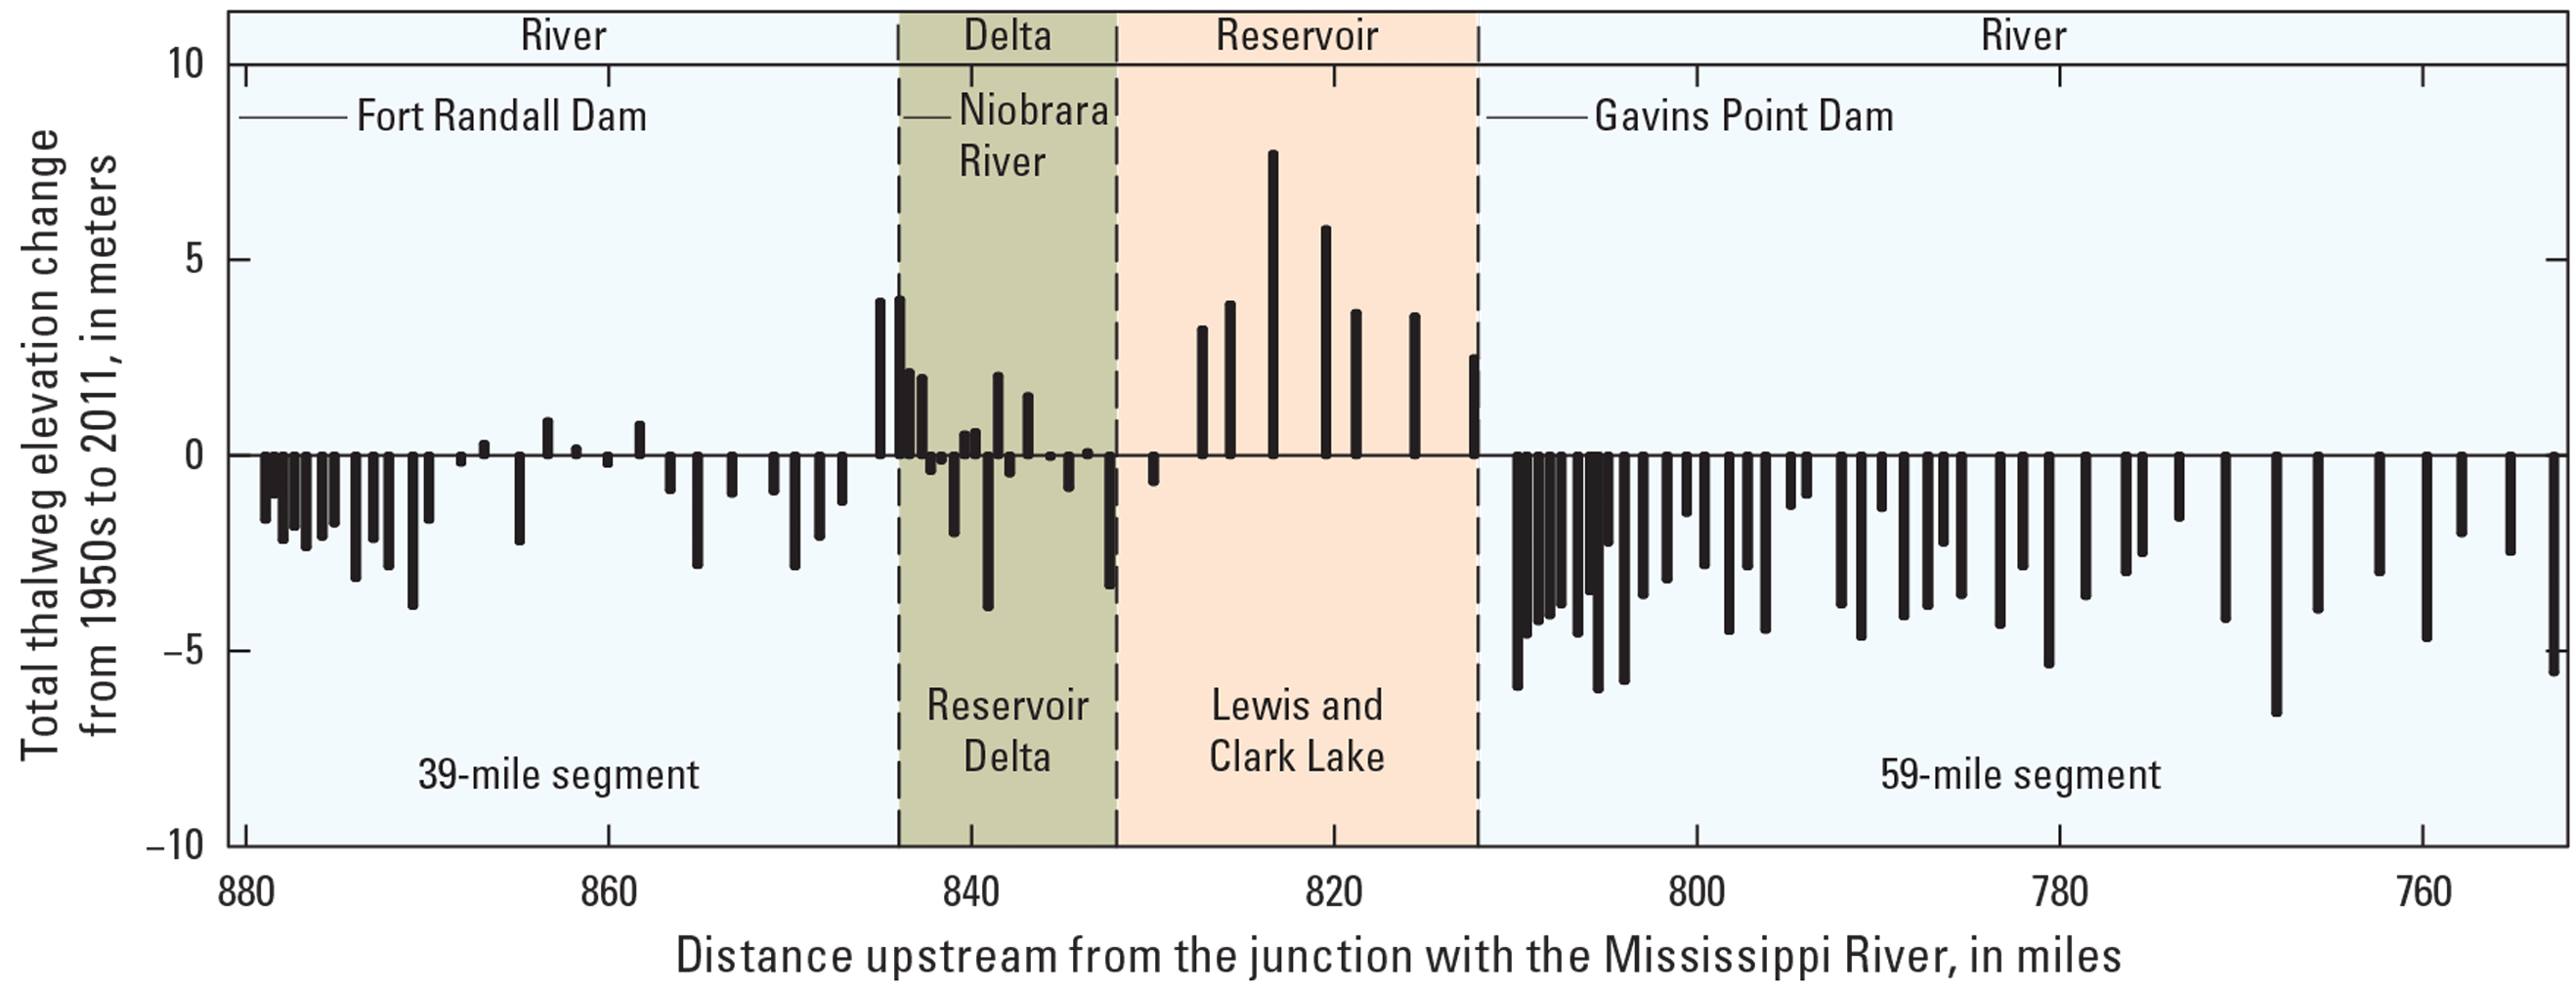
Spatial trends in bed degradation for cross sections surveyed by the U.S. Army Corps of Engineers from 1955 to 2011 from Fort Randall Dam to Ponca State Park, Missouri River mile 880–752.
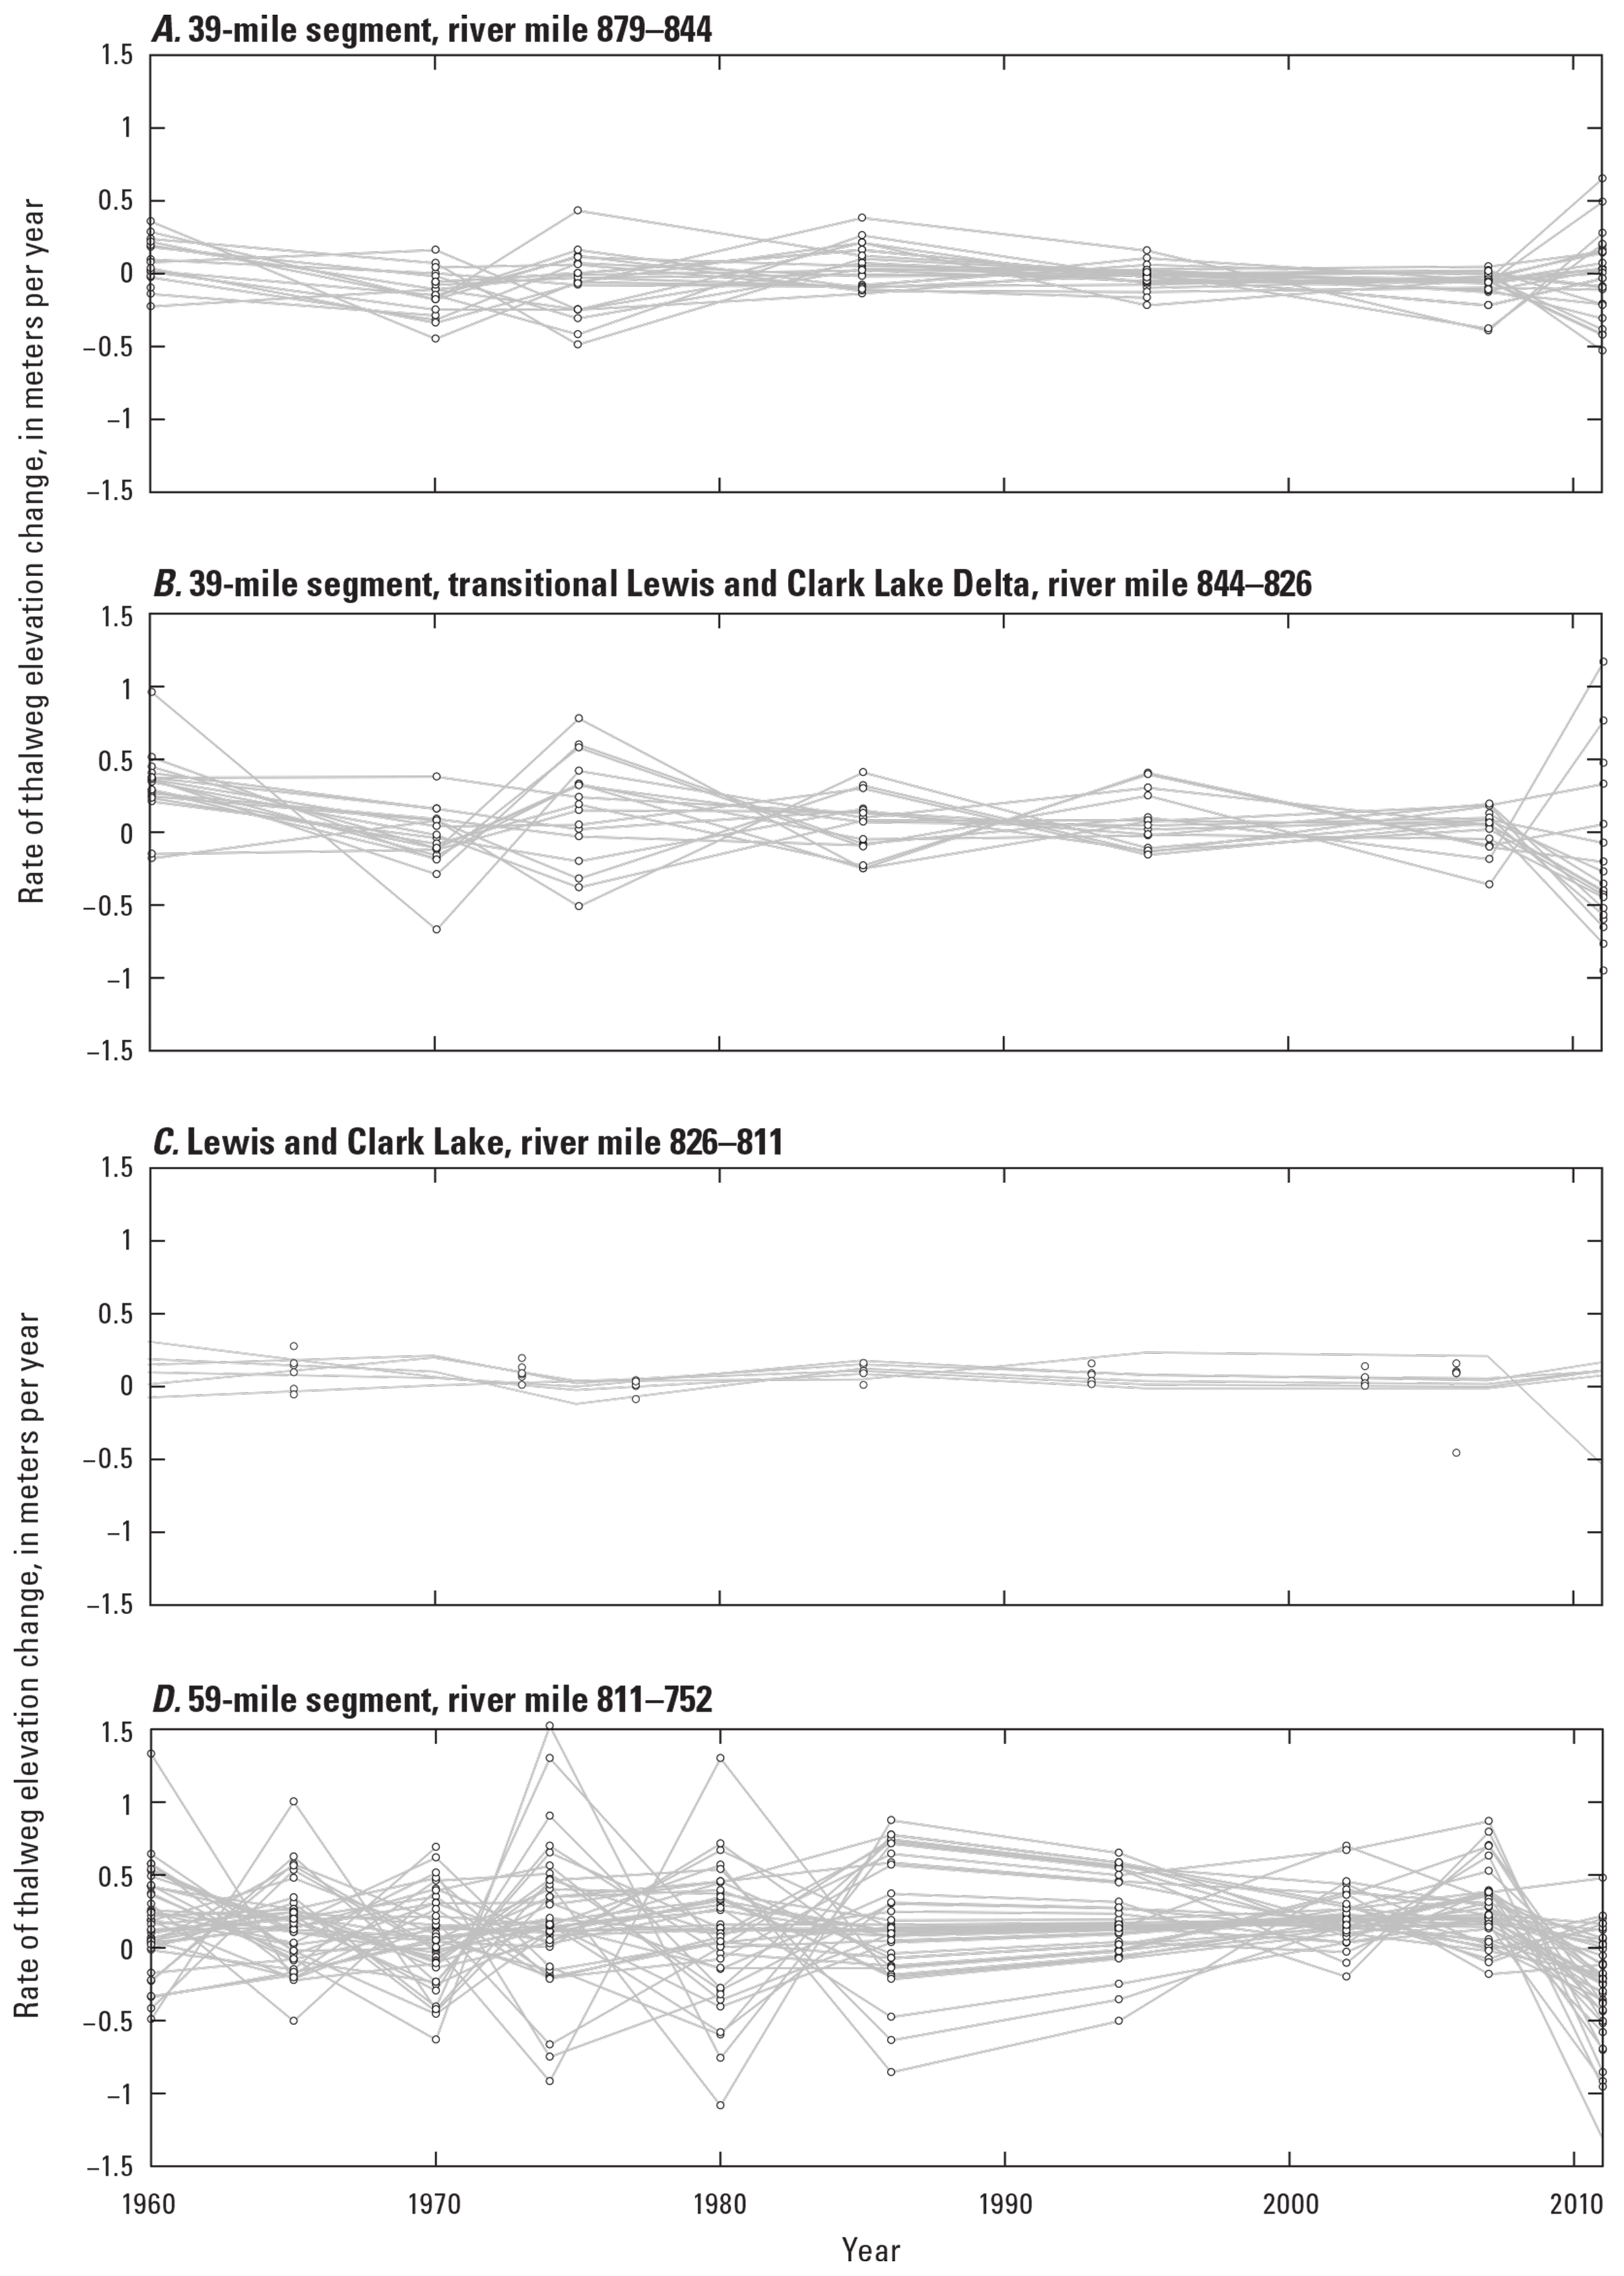
Rate of bed-elevation change, from thalweg elevation in meters per year for Missouri National Recreational River (MNRR) river segments. A, The 39-mile MNRR river segment, river mile 879–844. B, The 39-mile MNRR segment transitional Lewis and Clark Delta, river mile 844–826. C, Lewis and Clark Lake, river mile 826–811. D, The 59-mile MNRR river segment through time, river mile 811–752.
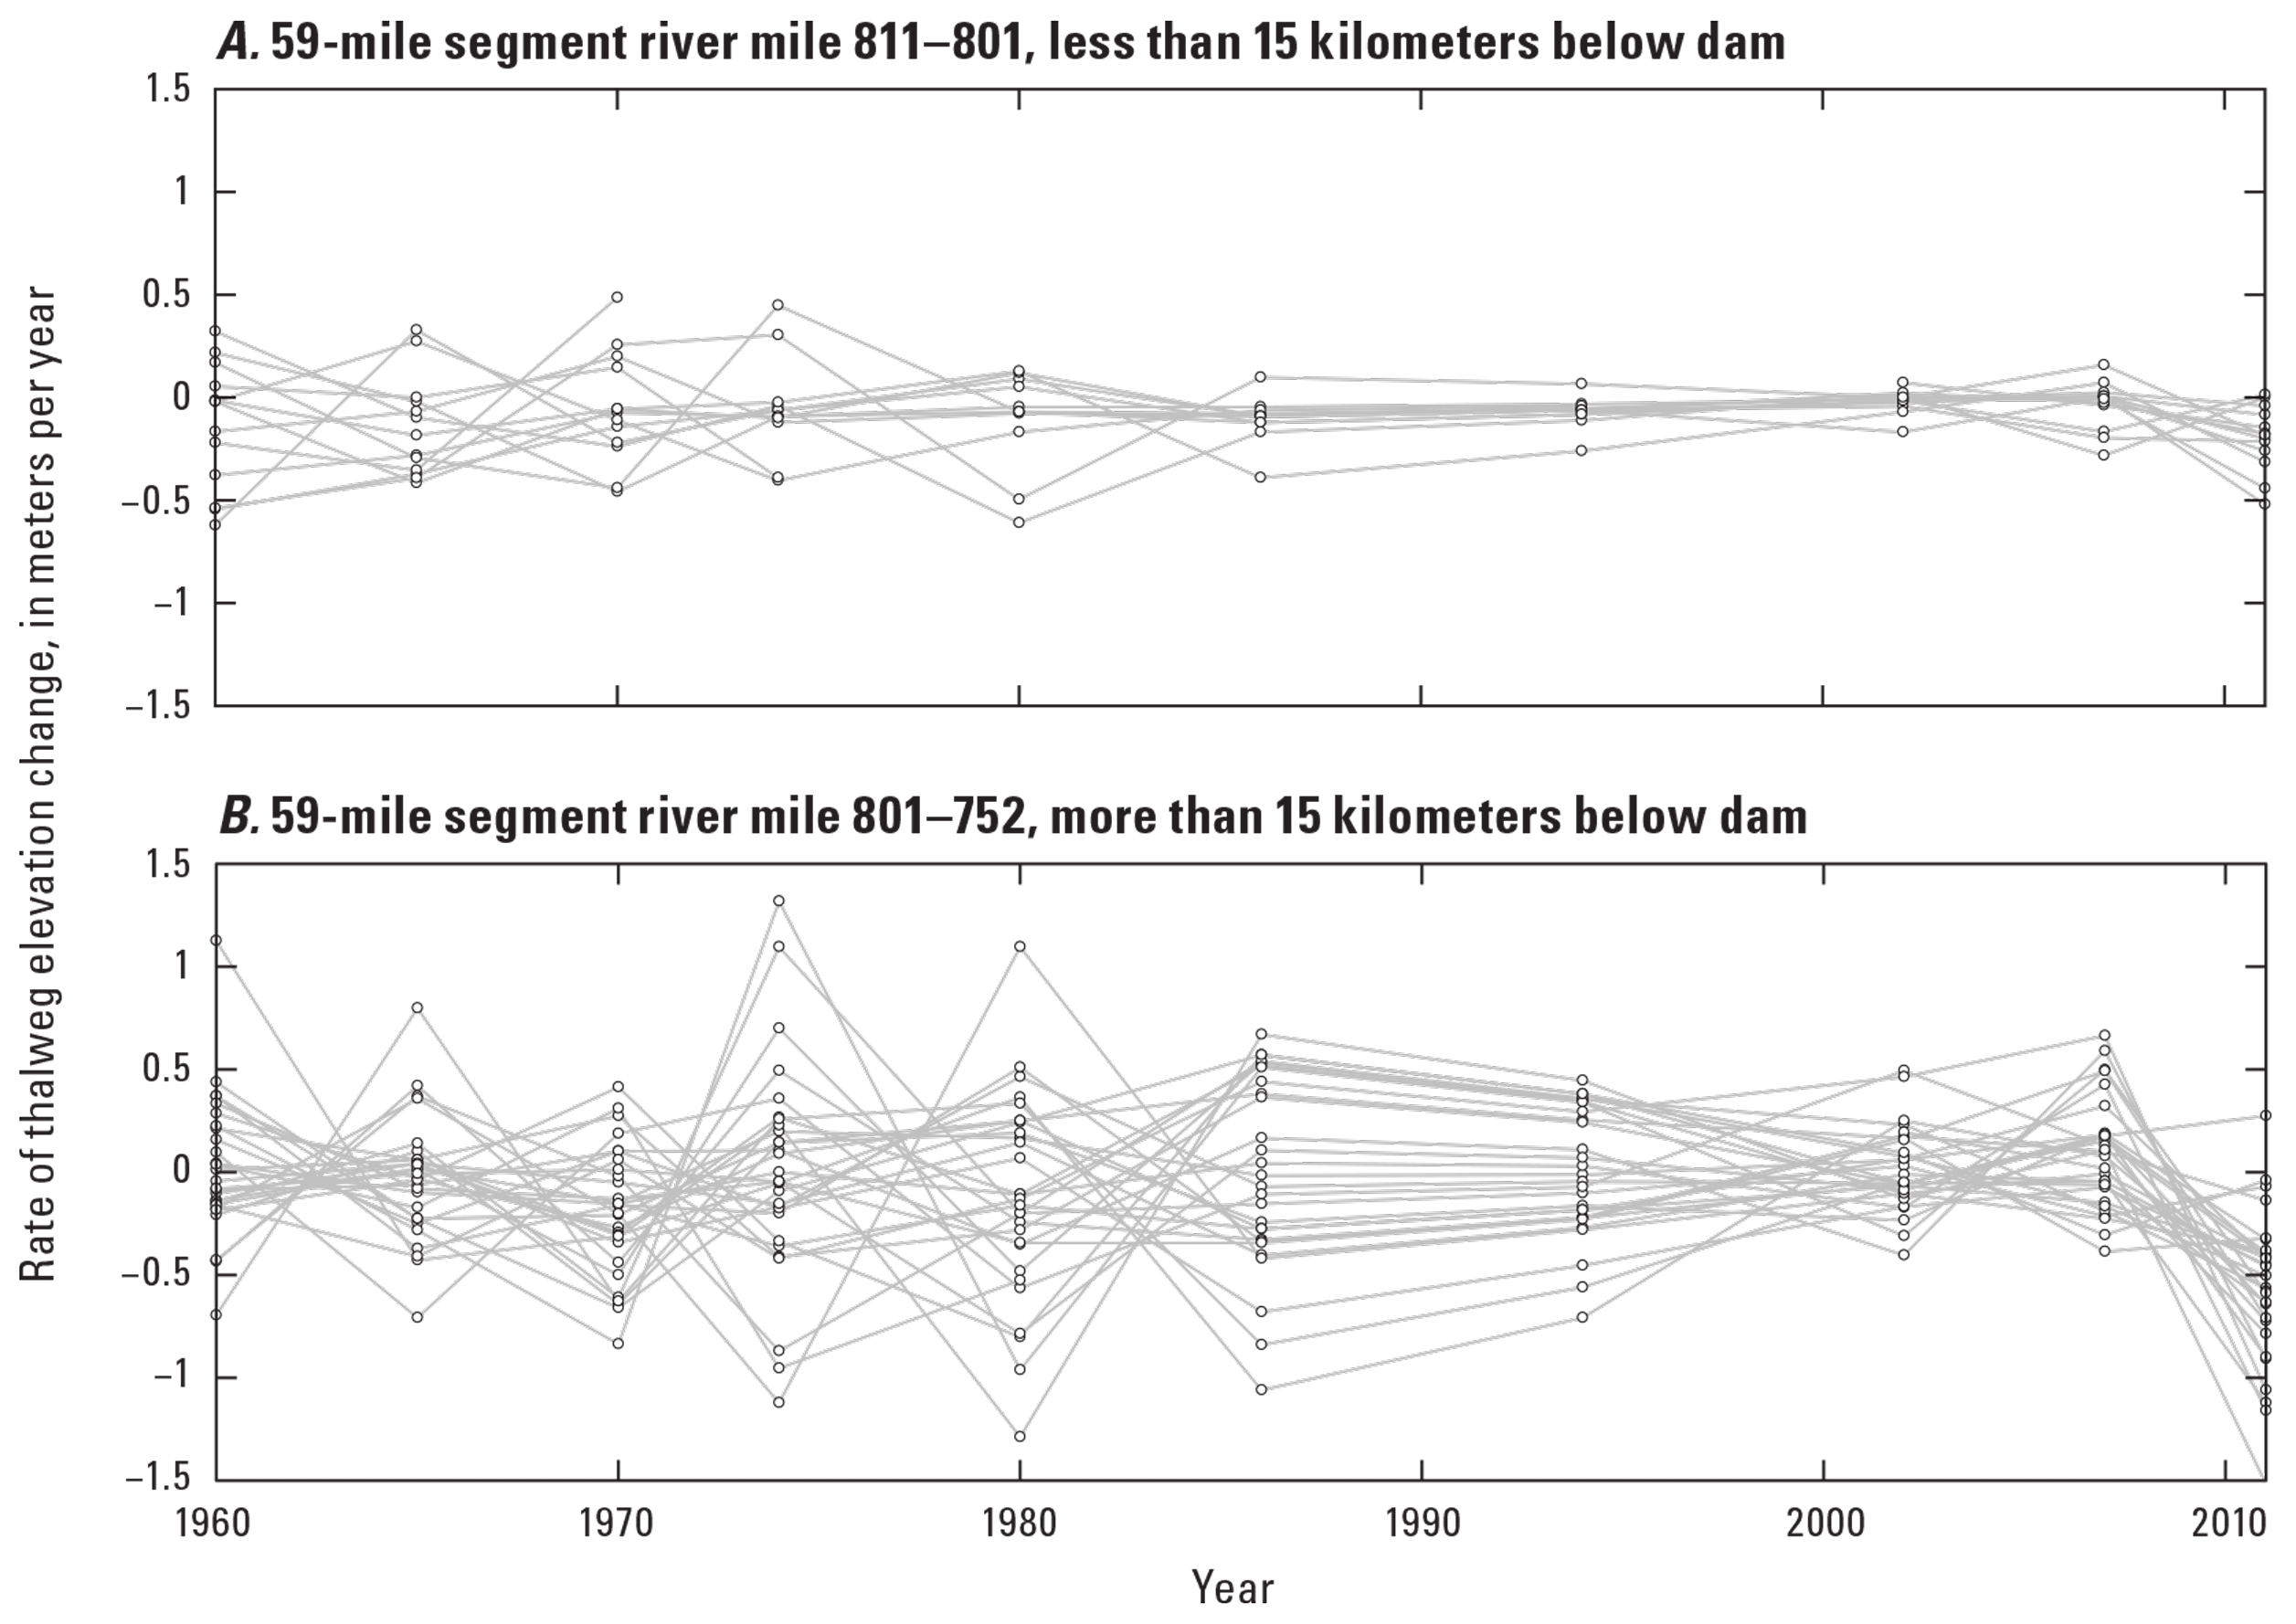
Rate of bed-elevation change, from thalweg elevation in meters per year for two subreaches of 59-mile segment of the Missouri National Recreational River. A, Less than 15 kilometers below Gavins Point Dam, river mile 811–801. B, More than 15 kilometers below Gavins Point Dam, river mile 801–752.
Flood-Plain Inundation Modeling
Our implementation of inundation models is intended to illustrate how geomorphic adjustments affect channel and flood-plain connectivity. Modeled water-surface elevations over a range of discharges shows estimated extent and depth of inundation of the Missouri River flood plain in the 39-mile and 59-mile segments (figs. 26–27; table 3). Raster maps of depth and inundation extent for nine discharges in each segment are available in the USGS data release accompanying this report (appendix 1; Elliott, 2022).
As expected, submerged area increases in the 39-mile river and delta segments and in the 59-mile segment with increasing modeled discharge (fig. 28). These increases occur at different rates, and the specific area (area submerged per kilometers) has higher initial values, 0.75 km and 2.5 km, respectively, in the 39-mile river and delta segments, than in the 59-mile segment, 0.27 km (fig. 28). The rate of increase in inundated specific area is greater in both river segments, especially from12,000 to 30,000 ft3/s in the 39-mile segment and from 15,000 to 20,000 ft3/s in the 59-mile segment. The increase in specific area inundated at very high flows, from 70,000 to 160,000 ft3/s, is steeper in the 59-mile segment than the 39-mile segment. In the delta segment, the total increase in inundated specific area from 12,000 to 160,000 ft3/s is 0.4 km, indicating that most of the delta’s flood plain is inundated at low flows in the delta (fig. 28).
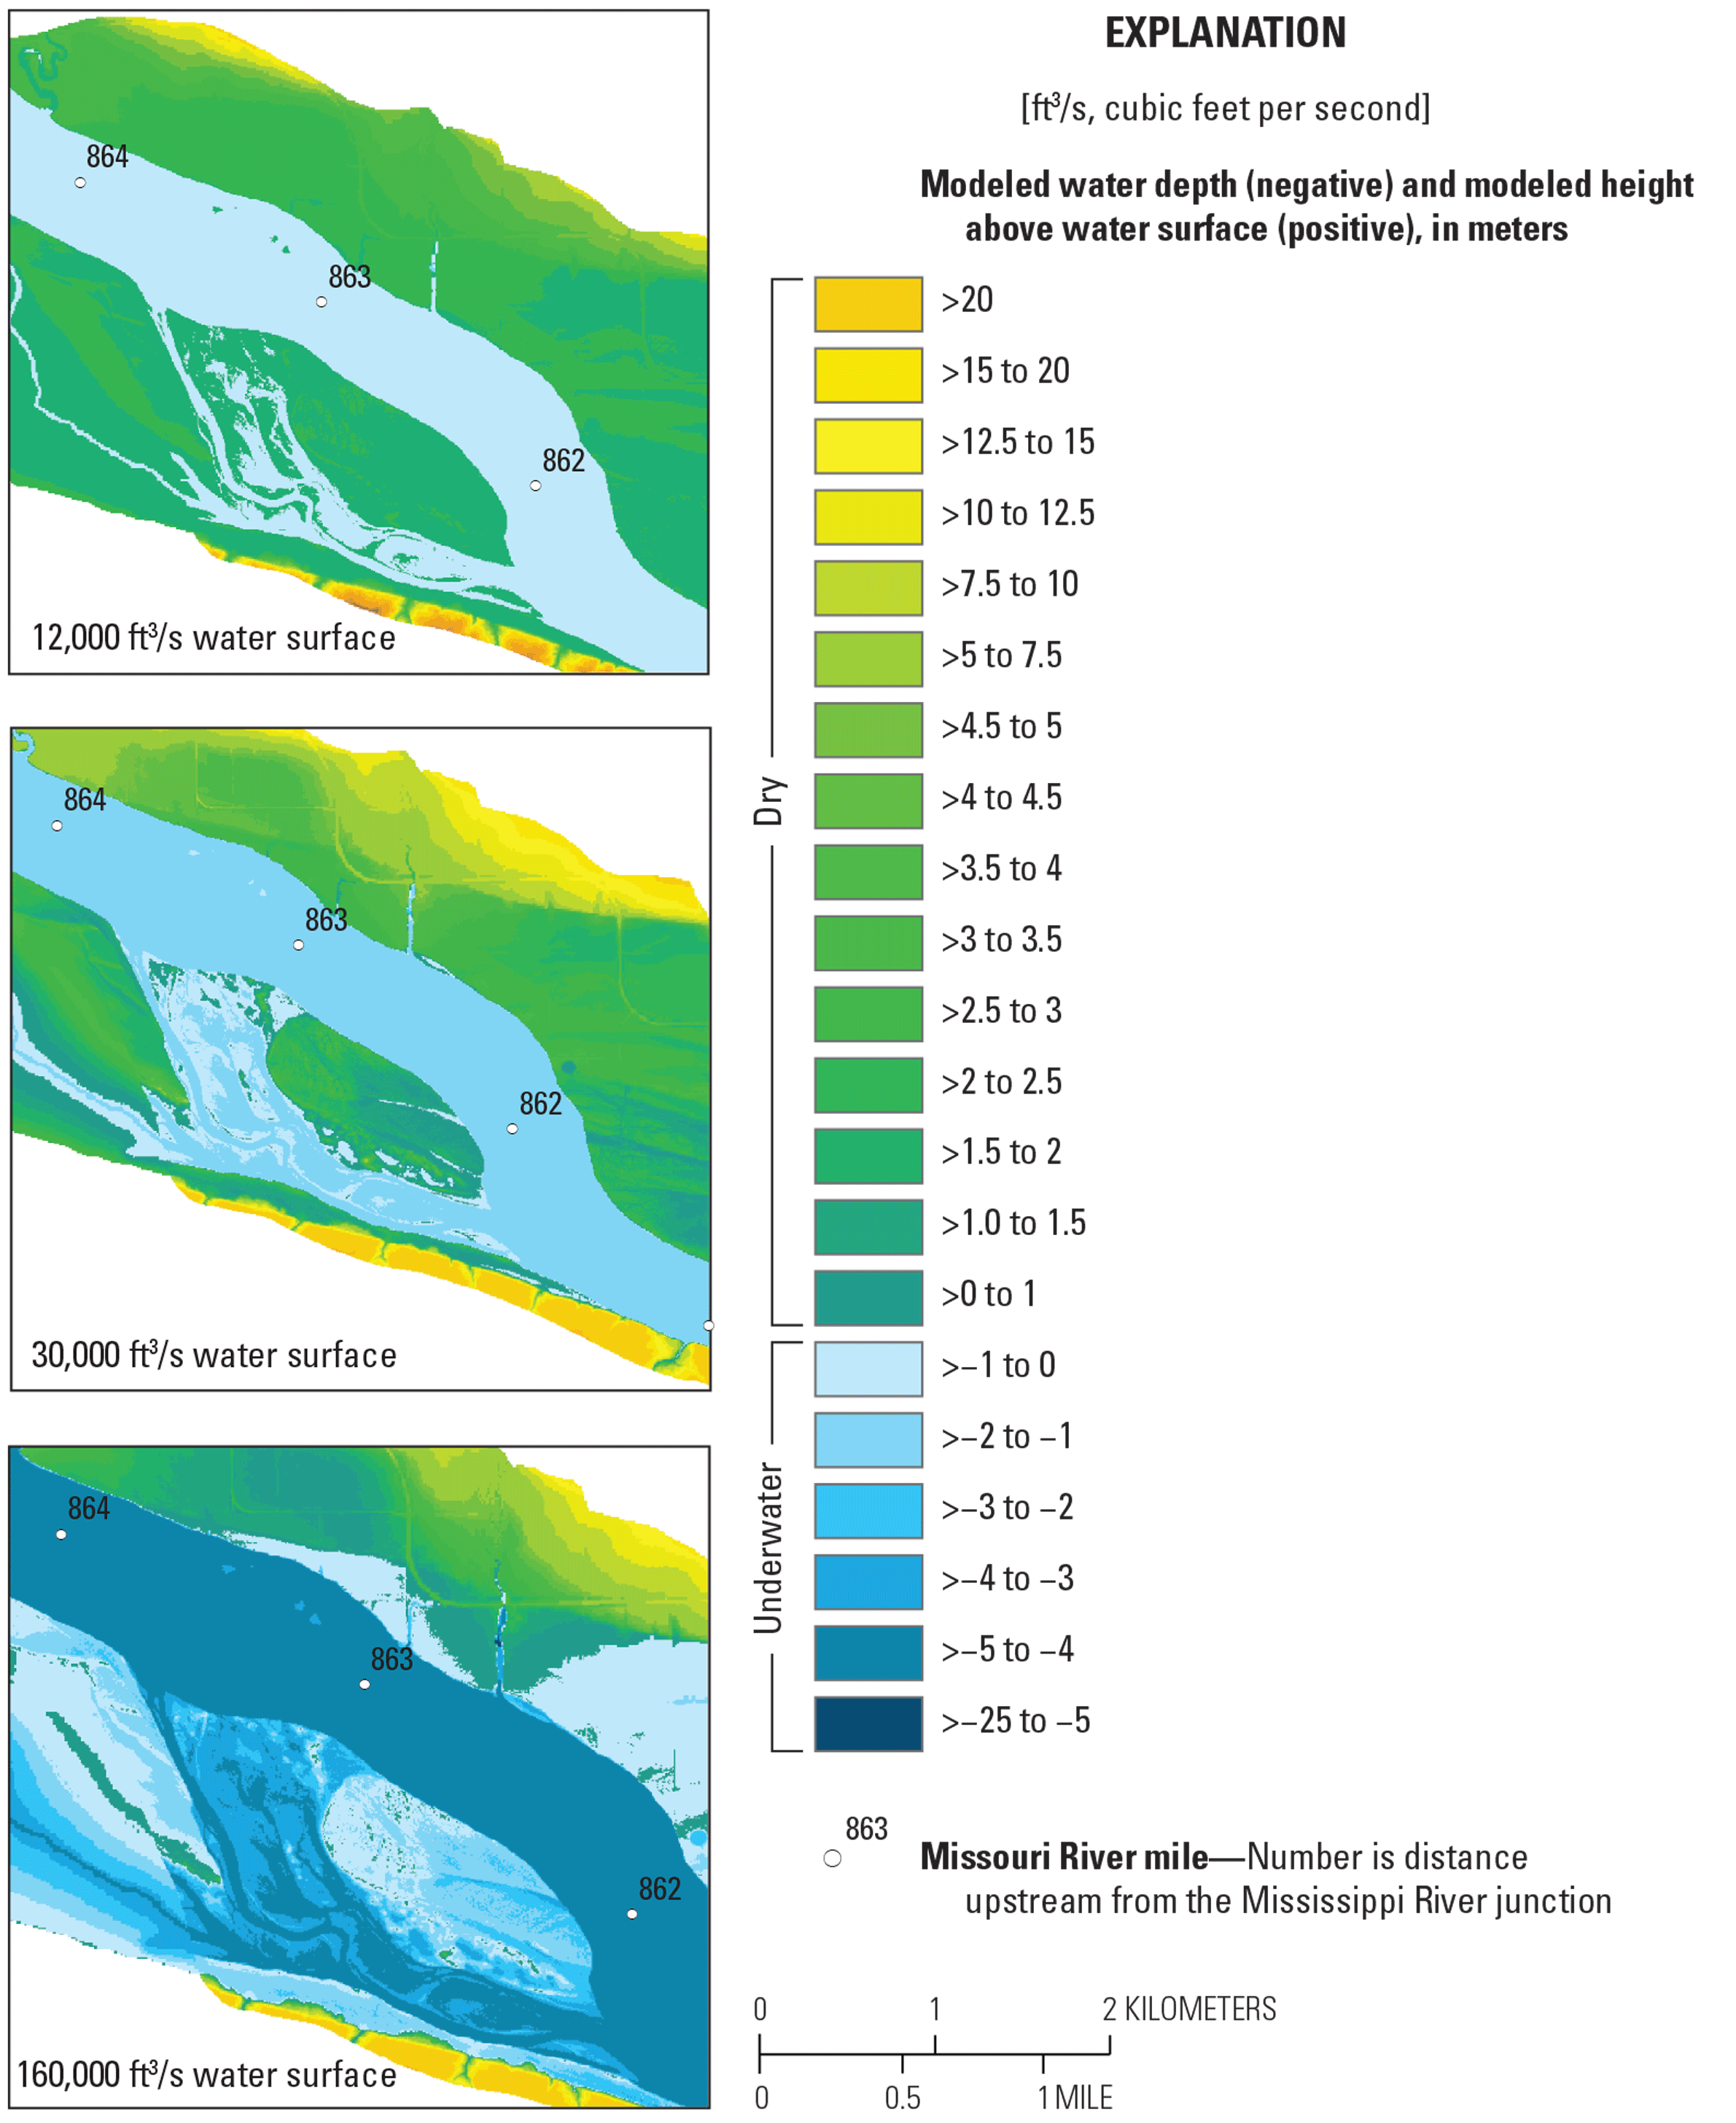
Examples of flood-plain inundation modeling results in the 39-mile segment of the Missouri National Recreational River for low, medium, and high flows.
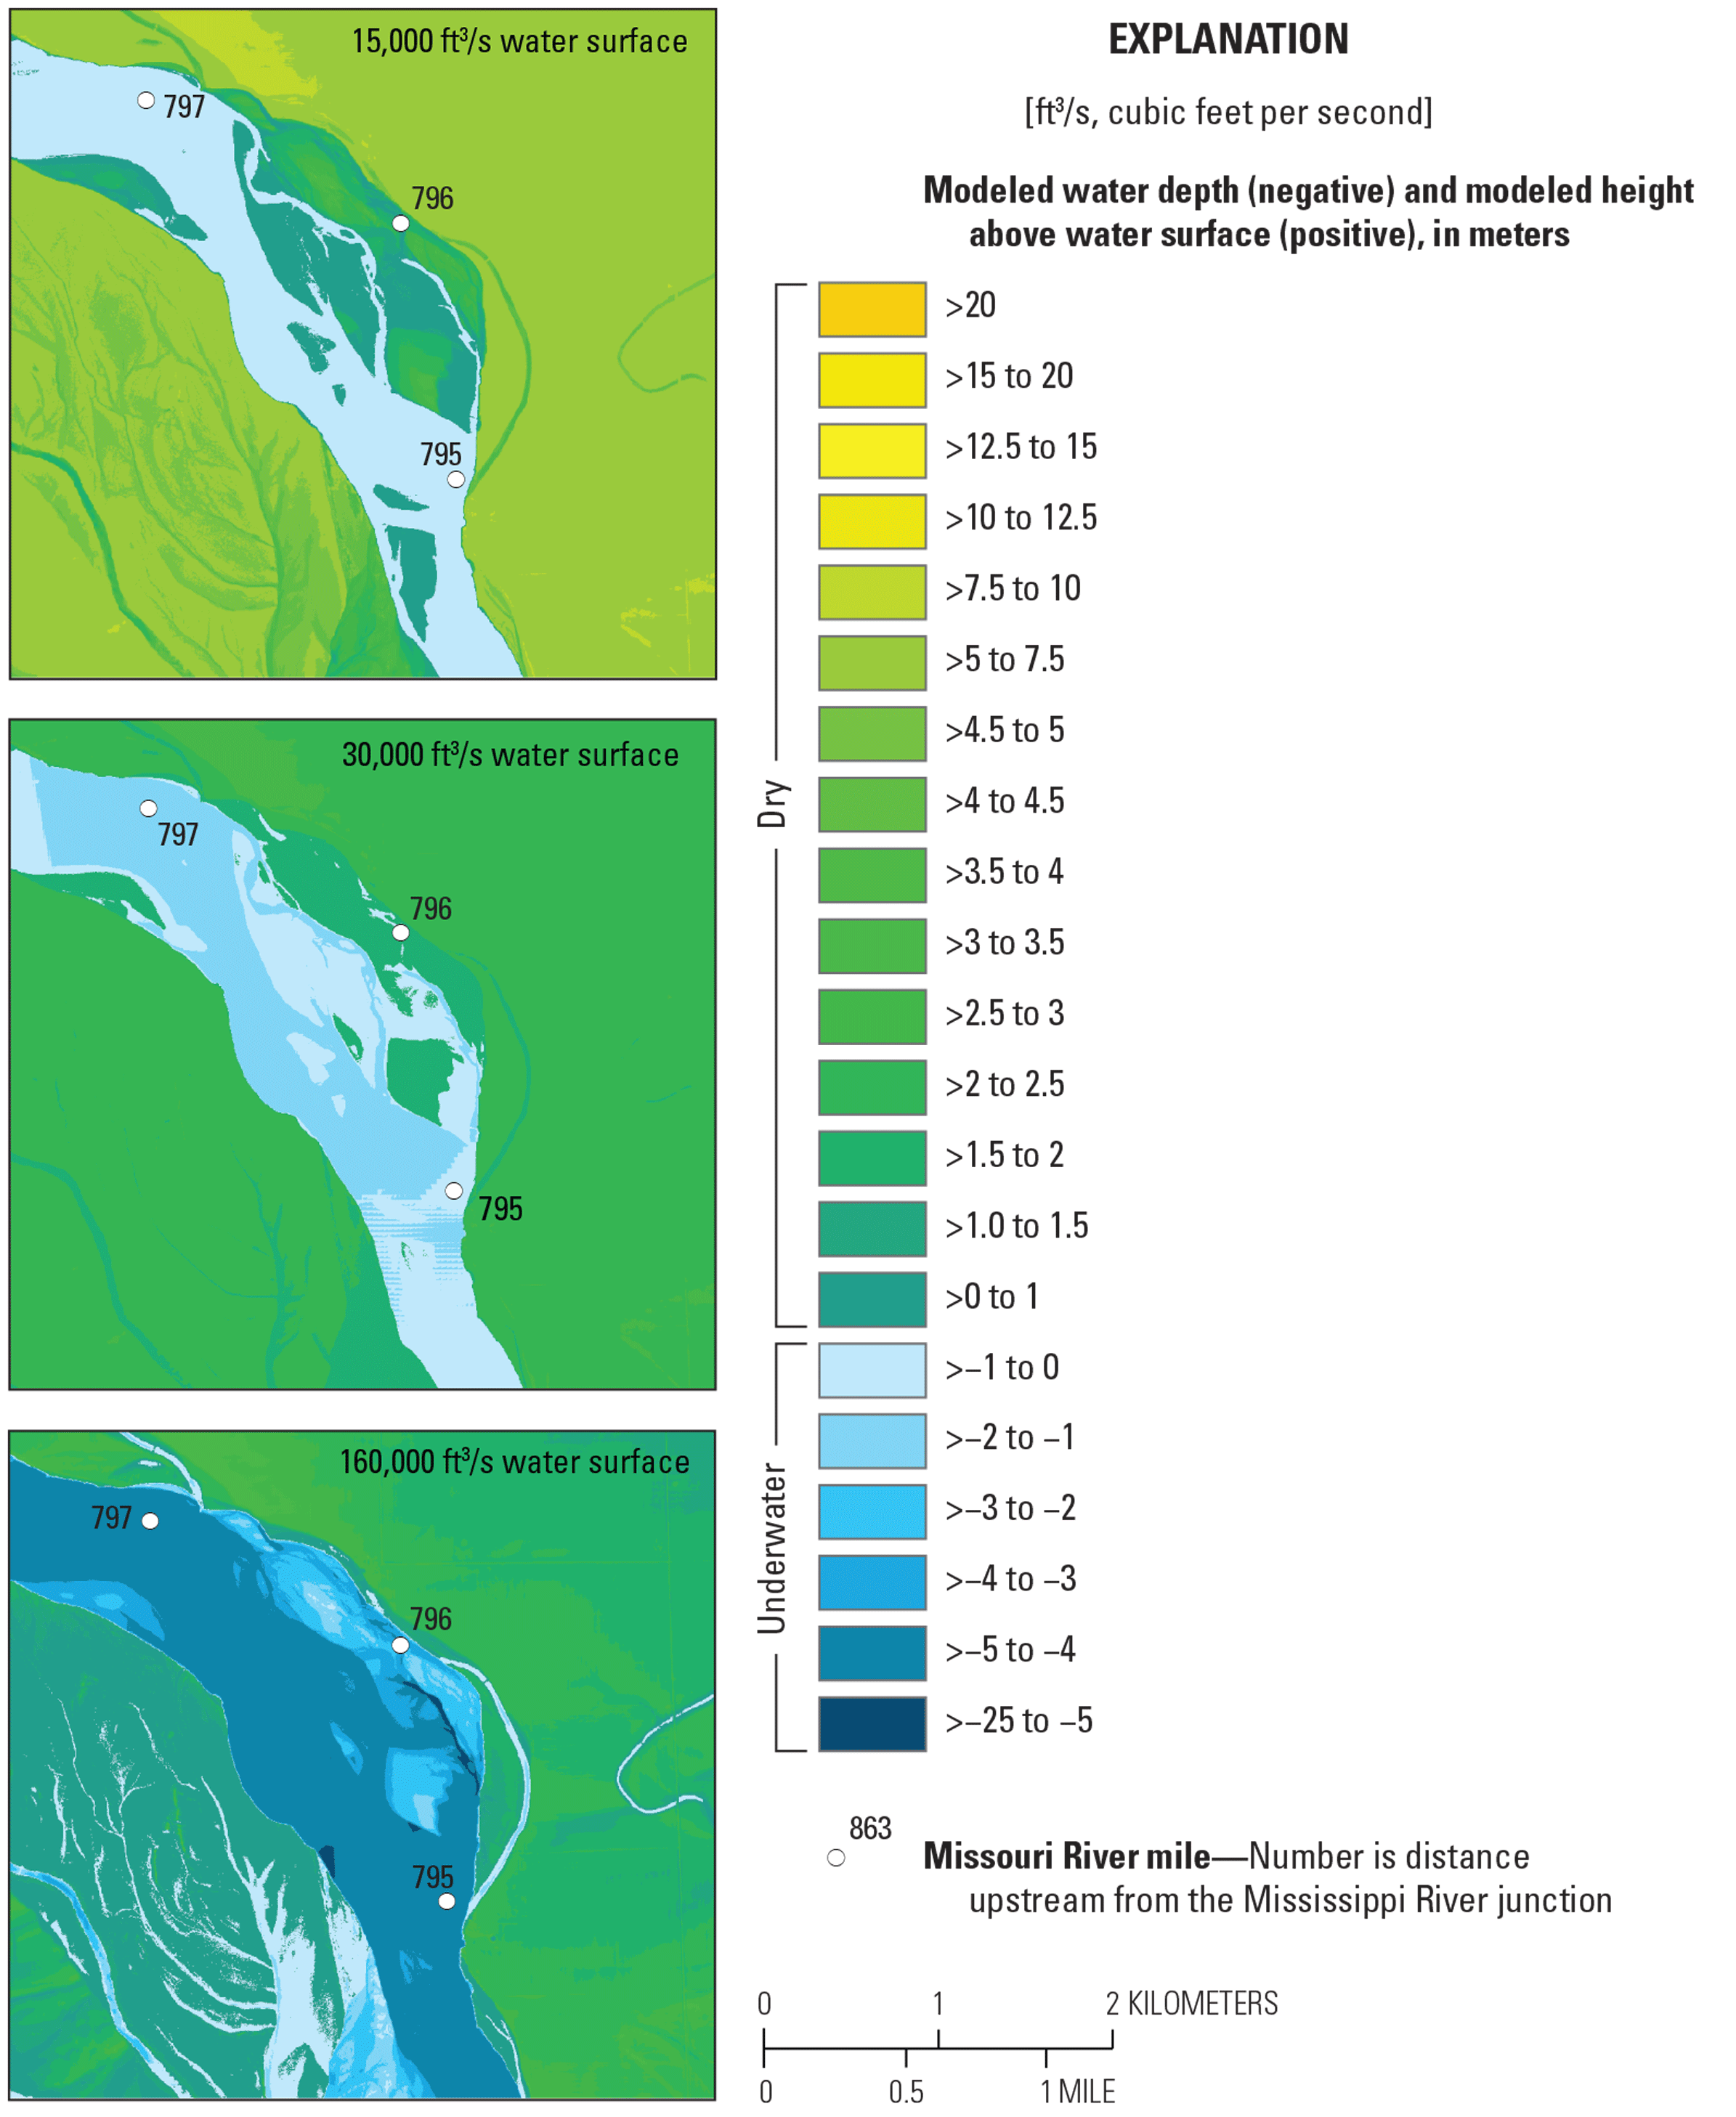
Examples of flood-plain inundation modeling results in the 59-mile segment of the Missouri National Recreational River for low, medium, and high flows.
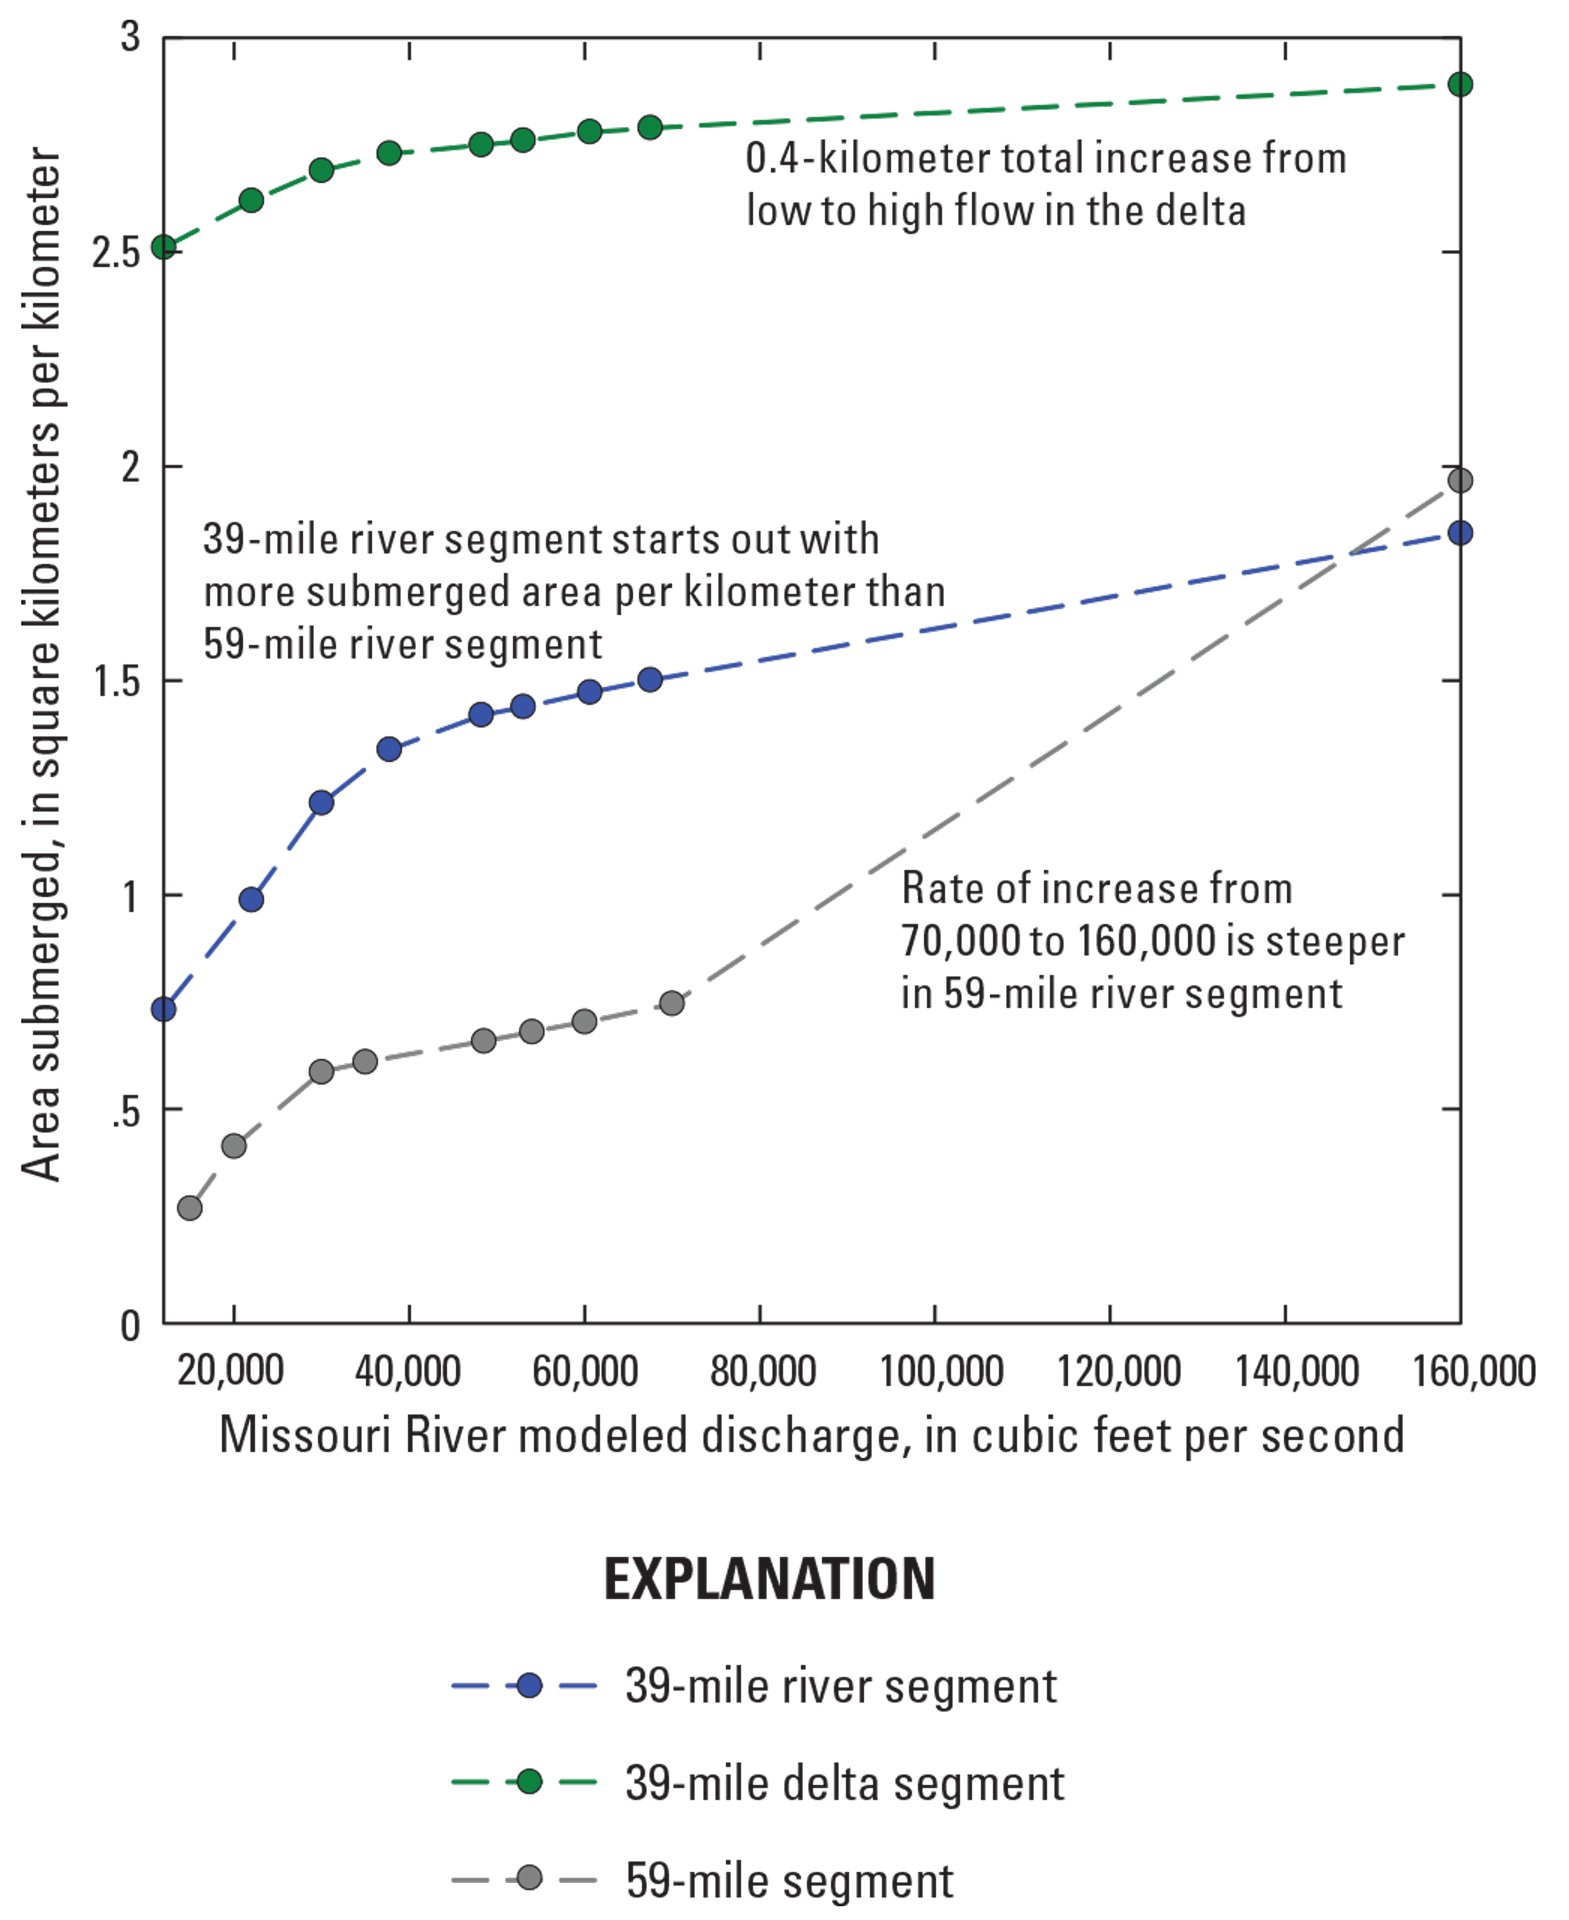
Inundated flood-plain area for modeled discharges in the 39-mile river and delta segments and the 59-mile segment of the Missouri National Recreational River.
Channel and Valley Constraints on Channel Migration
There are human-constructed and natural constraints to lateral channel migration within the valley of the two MNRR segments. Small alluvial and colluvial tributary fans from upland drainages are likely to contain coarse or cohesive sediments (Dillon and others, 2009; Joeckel and others, 2011; Joeckel and others, 2013) and have the potential to constrain river migration. In the 39-mile segment, these fans are generally small in size (0.01–0.14 square kilometer [km2]) and can be adjacent to the river or a kilometer away, depending on river position in the valley (fig. 29). Bank revetement and the valley wall provide greater constraints to channel migration than fans because the valley is relatively narrow and the river banks are bordered by bedrock (48.7 percent) or bank revetments (12.4 percent) over much of this segment (fig. 29). The length of bank sections protected by revetments vary, ranging from 176 m to 5.6 km long, with a mean protected length of 2.1 km.
In the wider valley of the 59-mile segment, there are fewer bedrock valley constraints on river migration, but flood-plain mapping has documented cohesive, older river sediments in the flood plain such as those mapped as Holocene backswamp mud; these deposits are likely to be less erodible than the noncohesive sand presently being deposited by the river (Alexandrowicz and others, 2011; Brown and others, 2011; Emenhiser and others, 2011; Garrett and others, 2011; Moreno and others, 2011a; Moreno and others, 2011b; Moreno and others, 2011d, 2011c; Radakovich and others, 2011; Reed and others, 2011; Lundstrom and others, 2022) (fig. 29). The backswamp deposits occur in the wider valley but are generally several kilometers away from the current river channel. There are also alluvial and colluvial tributary fans in the 59-mile segment that are potential geologic constraints on channel migration to some degree, although they tend to be small in size (Lundstrom and others, 2022). Extensive bank revetments covering 31.5 percent of the banks in the 59-mile segment and bedrock covering 1.4 percent of the banks provide more immediate constraints to the channel migration (fig. 29). Bank revetments in the 59-mile segment tend to cover longitudinal sections of bank and can vary in length from 8 m to 5.3 km; the average length of protected bankline is 1.2 km.
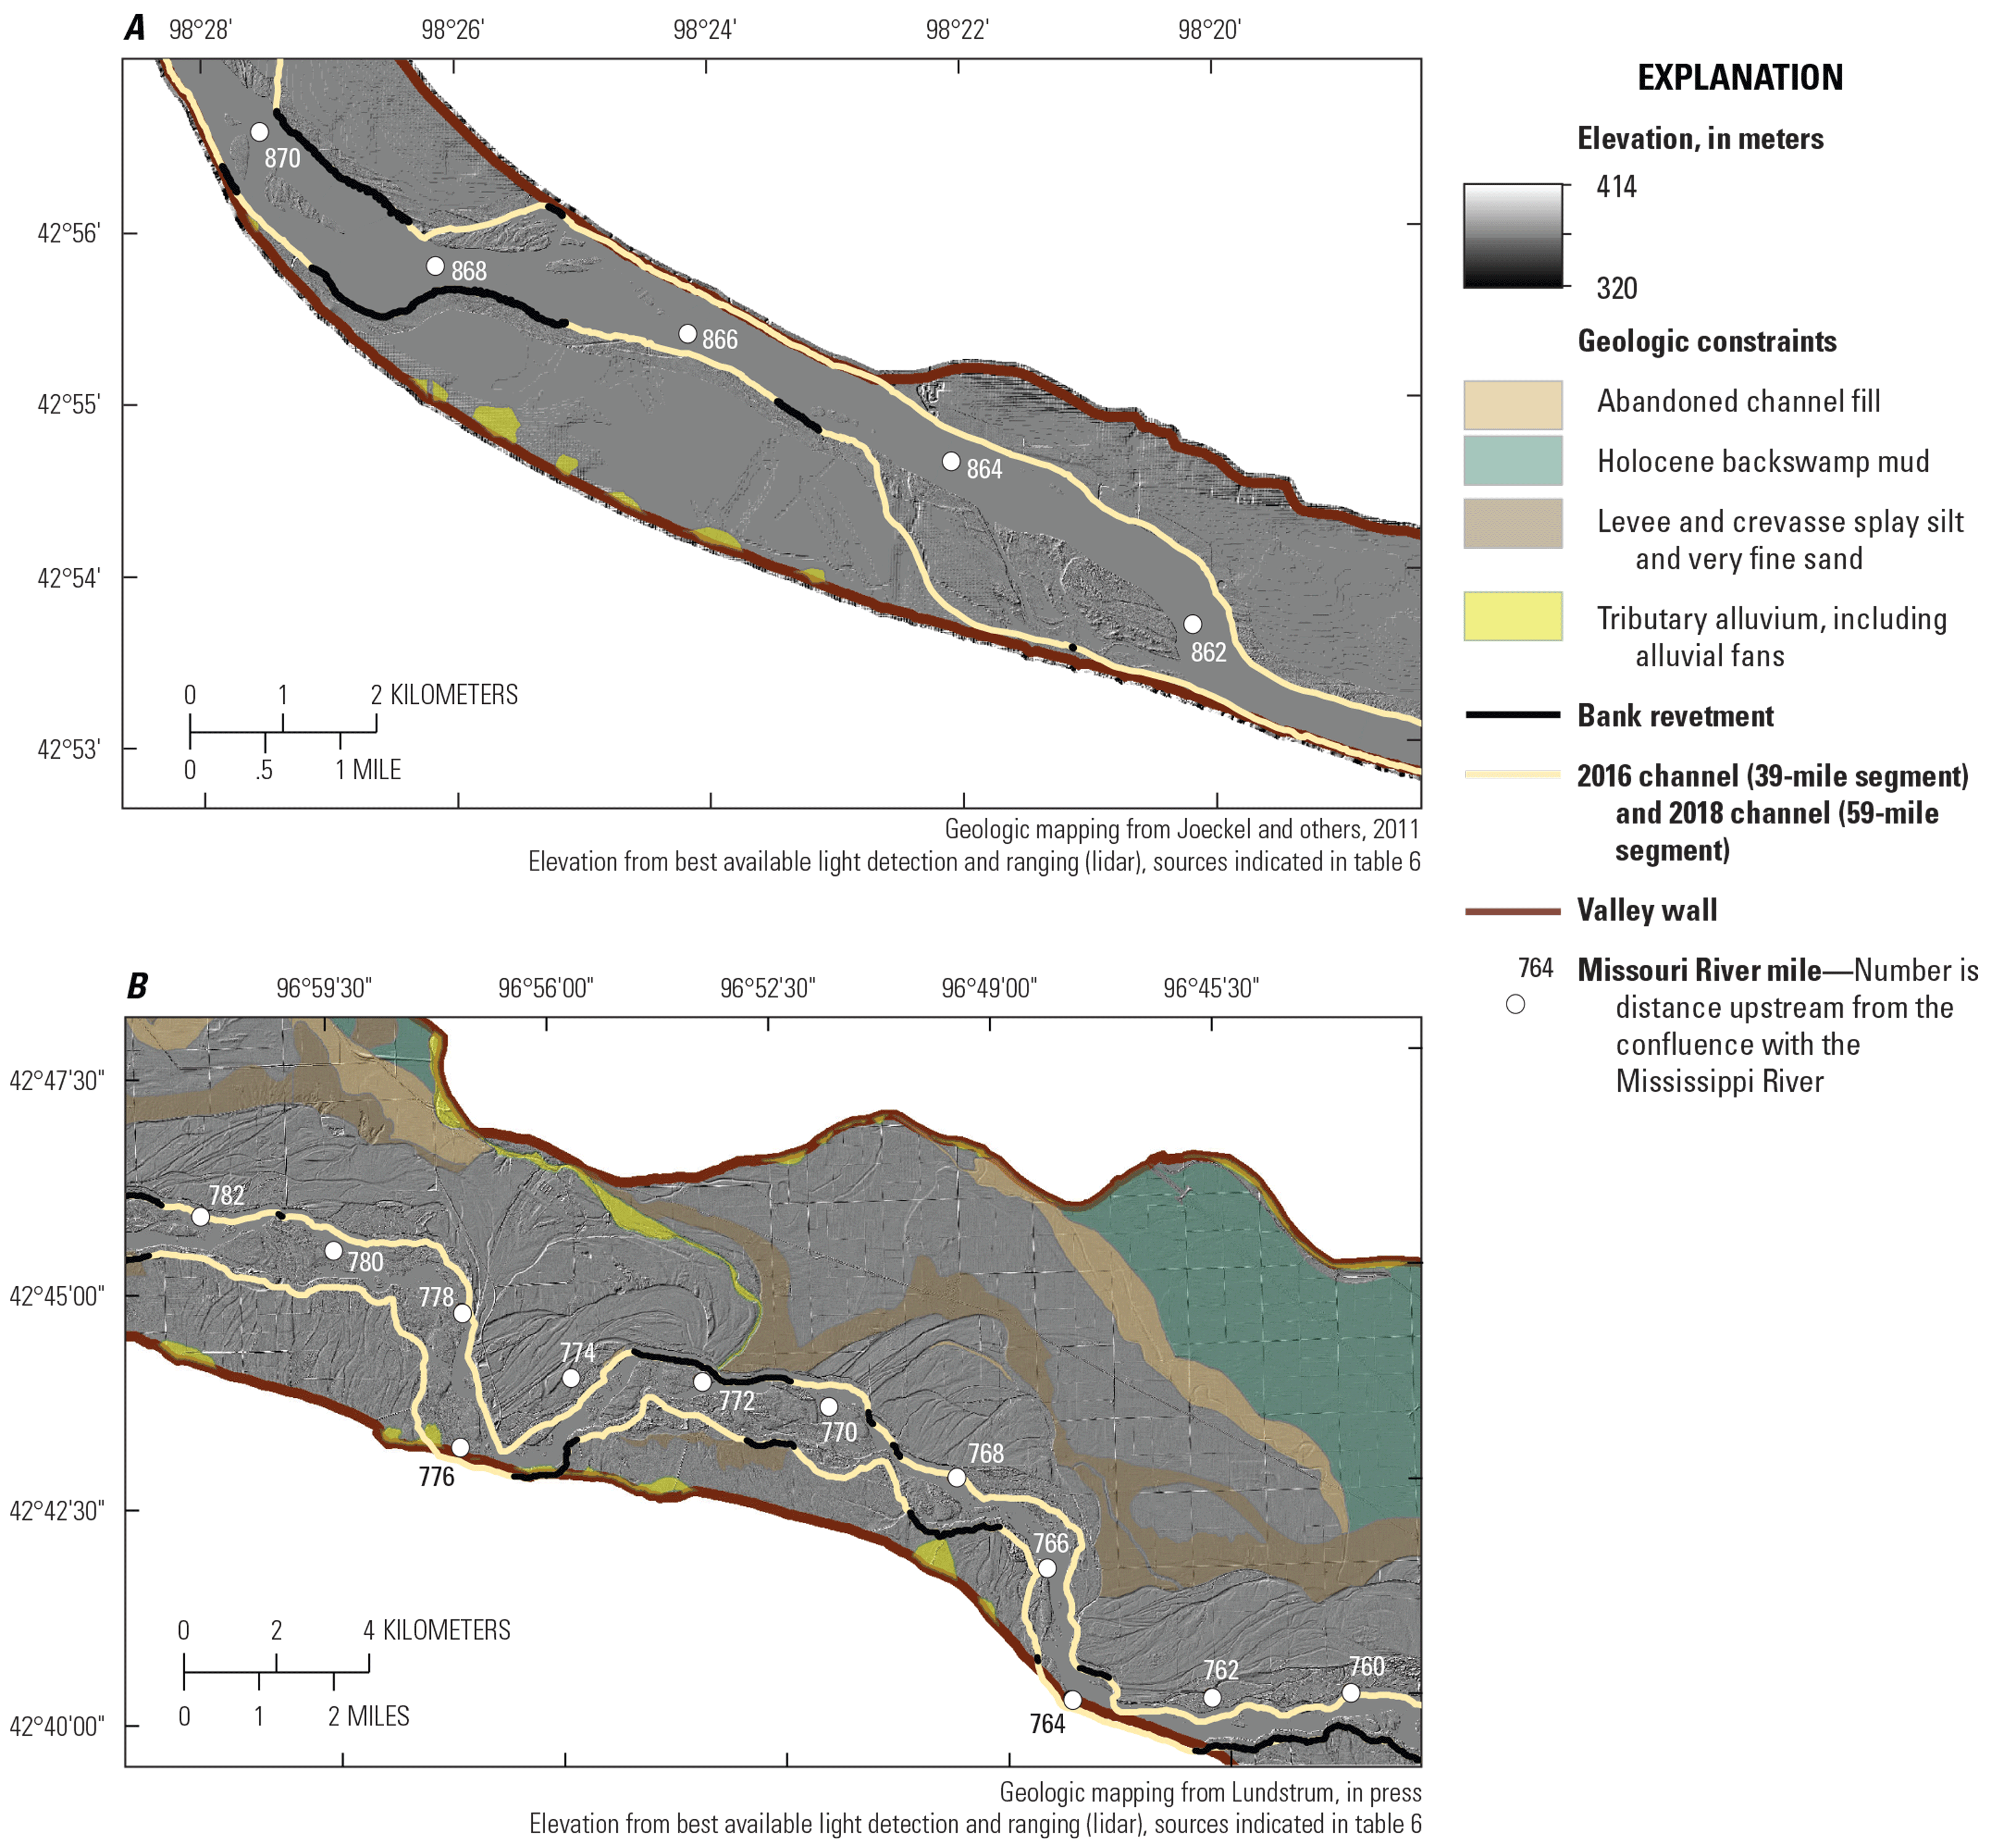
Geologic and physical constraints on channel movement in sections of the Missouri National Recreational River segments. A, 39-mile segment. B, 59-mile segment.
Banklines
Banklines digitized from historical photographs and maps show channel positions at a few time increments from 1894 to 1993; these banklines can be considered low resolution. A higher-resolution dataset digitized from digital aerial photography shows the timing of bankline erosion in the 39-mile segment from 1993 to 2016 and in the 59-mile segment from 1993 to 2018 (table 8; figs. 30–31).
In the 39-mile segment, channel positions from 1894 to 1949 show that the channel migrated substantially within its flood plain in the pre-dam period (fig. 30). The percent of the channel that eroded and accreted was fairly equal in this period (32-percent accretion, 28-percent erosion; table 12). The pre-dam channel net erosion rate was 0.37 square kilometer per year (km2/yr), which is a linear average of 2.98 m/yr of bankline erosion (table 12). Erosion rates for these intervals are presented as a net quantity because it is possible there were episodes of erosion and deposition within each interval. The 1949 to 1993 period, which spans the dam construction and post dam periods, had considerably lower rates of net bank erosion, 0.07 km2/yr, or 0.58 m/yr of linear bankline (table 12). From 1993 to 2016 erosion rate measures declined further to a net of 0.02 km2/yr; 0.16 m/yr of bankline as an average linear rate.
Table 12.
Channel migration and bank erosion rates for the 39-mile and 59-mile segments of the Missouri National Recreational River.[km2, square kilometer; km2/yr, square kilometer per year; m/yr, meter per year; --, no data]
In the 59-mile MNRR segment, pre-dam channel positions in 1894, 1941, and 1953 show the channel migrated freely within the valley bottom (fig. 31). From 1894 to 1941, accretion and erosion were in general balance (30-percent accretion, 40-percent erosion; table 12). The channel occupied 33 percent of the same location in 1941 that it did in 1894. The mean net bank-erosion rate was 1.5 km2/yr, which is an average linear rate of 7.96 m/yr from 1894 to 1941 (figs. 32–33; table 12). From 1941 to 1953, net erosion rate was 1.36 km2/yr, which is an average linear erosion rate of 7.5 m/yr, similar to the 1894–1941 time period. The period between 1953 and 1956, which includes dam closure, had a net bank-erosion rate of 5.86 km2/yr and a linear rate of 32.26 meters per year (fig. 31; table 12). The largest flood of record (438,000 ft3/s, table 2) occurred in 1952, just prior to the 1953 imagery, and this in combination with adjustments to dam closure may explain the higher rates in the 1953-1956 time period. The 1956 to 1984 and 1984 to 1993 time periods had similar average linear net bank-erosion rates of 4.87 and 3.22 m/yr. The 18 banklines digitized from aerial imagery from the 25-year period between 1993 and 2018 indicate bank erosion that has occurred in recent decades, ranging from 0.04 to 0.34 km2, or an average linear rate of 0.2 to 1.79 m/yr. Bank-erosion rates in the 59-mile segment have generally declined over time (table 12). The 1993–2018 period has an average rate of 0.2 km2/yr per year, an average linear rate of 1.09 m/yr, approximately 6 times (15 percent) lower than rates in the pre-dam and post-dam adjustment periods, but considerably higher than rates measured in the 39-mile segment (table 12, fig. 33).
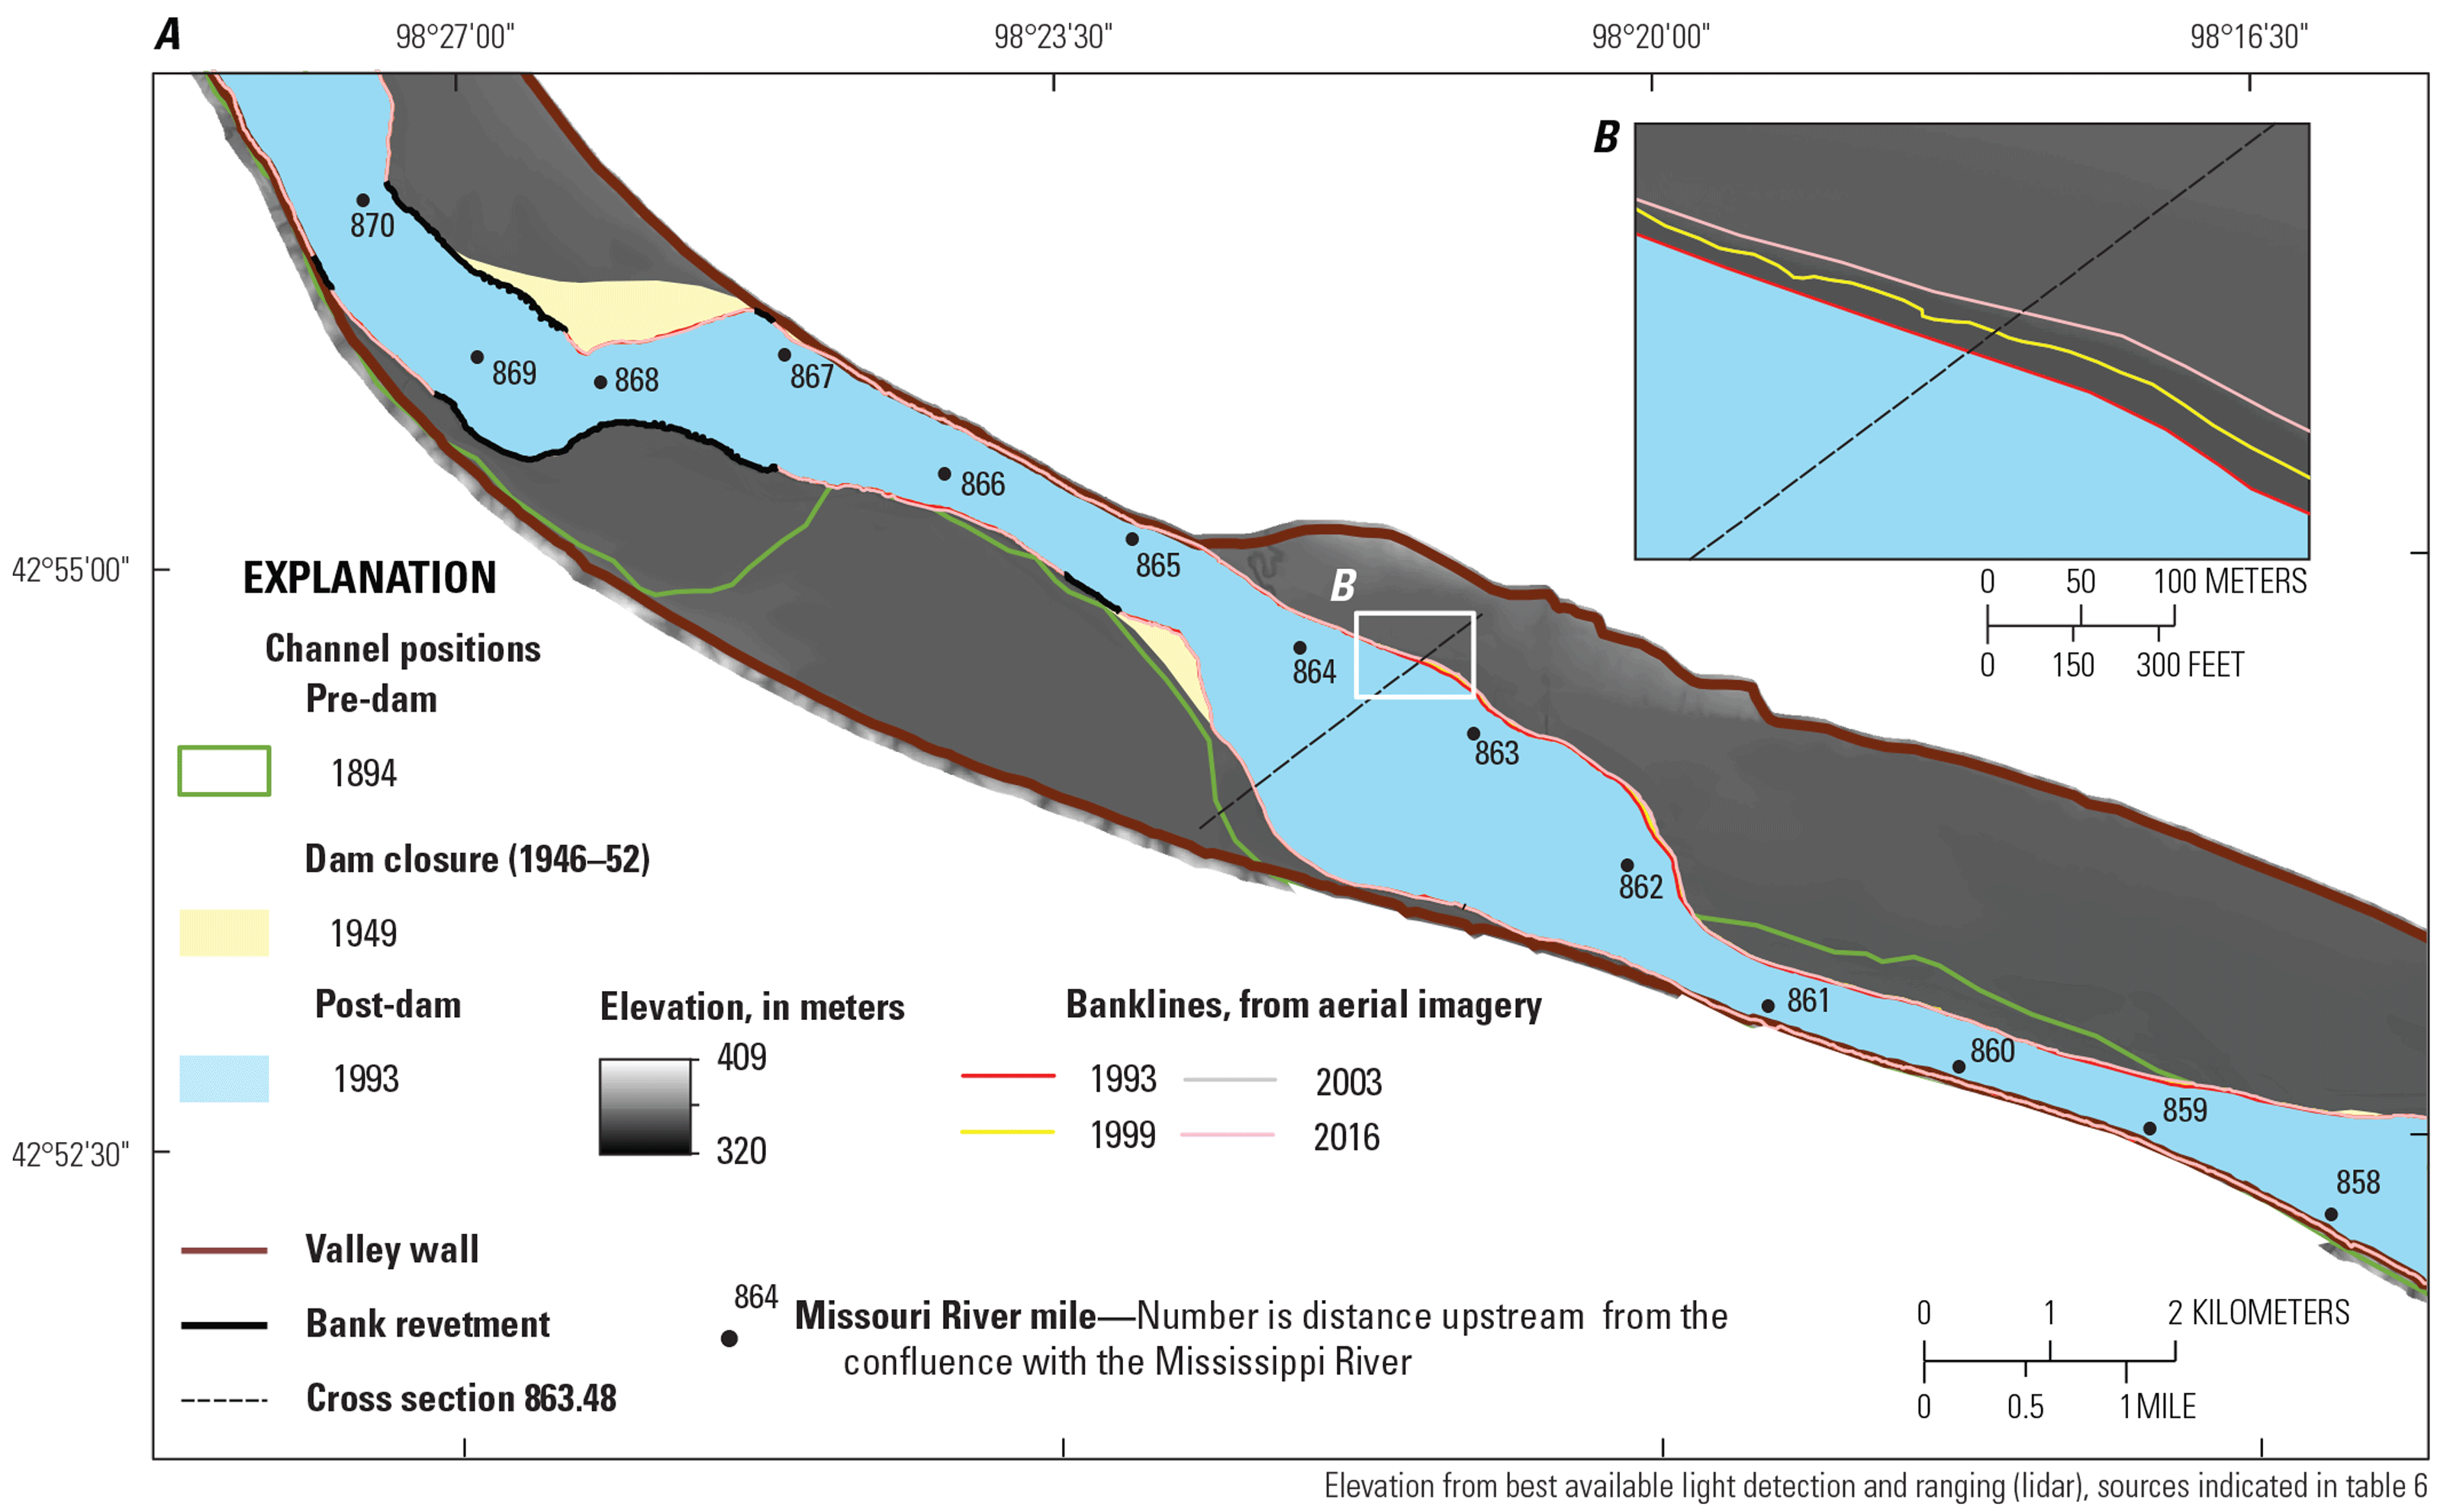
Bankline positions from a variety of data sources from 1894 to 2016 in a A, 20-kilometer long reach of the 39-mile segment of the Missouri National Recreational River. B, Inset showing bankline details near river mile 864.5.
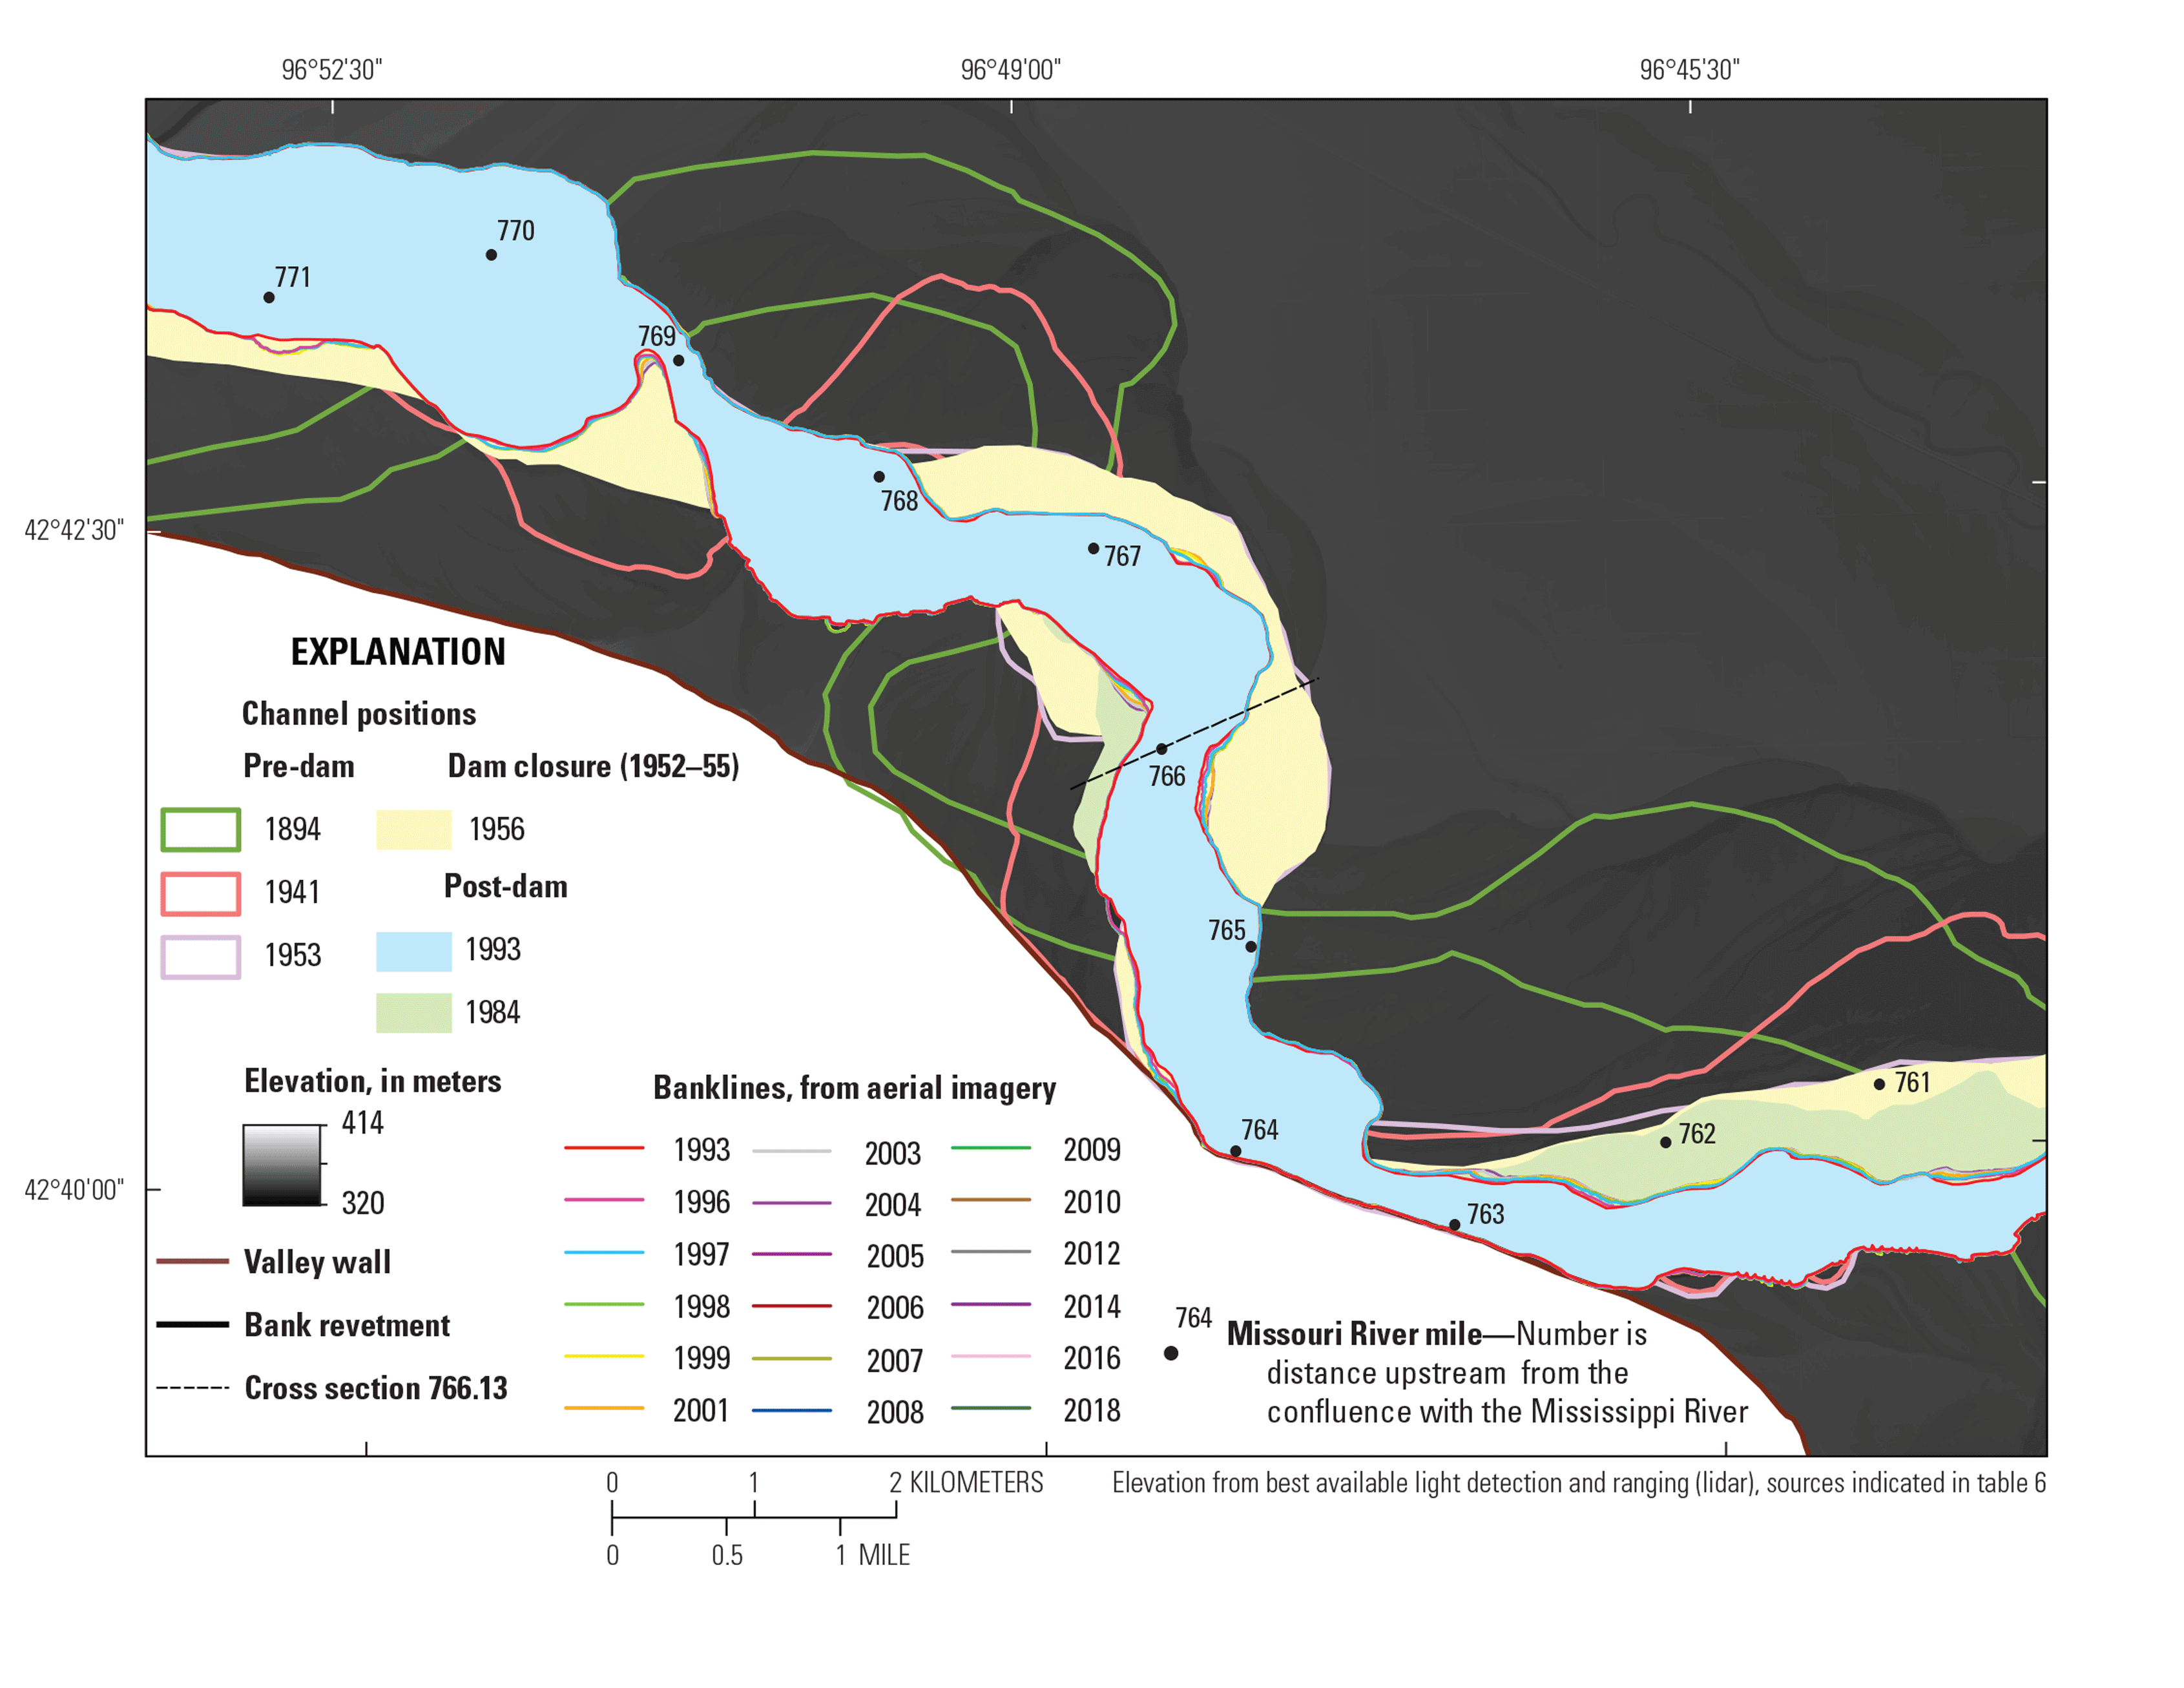
Bankline positions from a variety of data sources from 1894 to 2018 in a 18-kilometer long reach of the 59-mile segment of the Missouri National Recreational River.
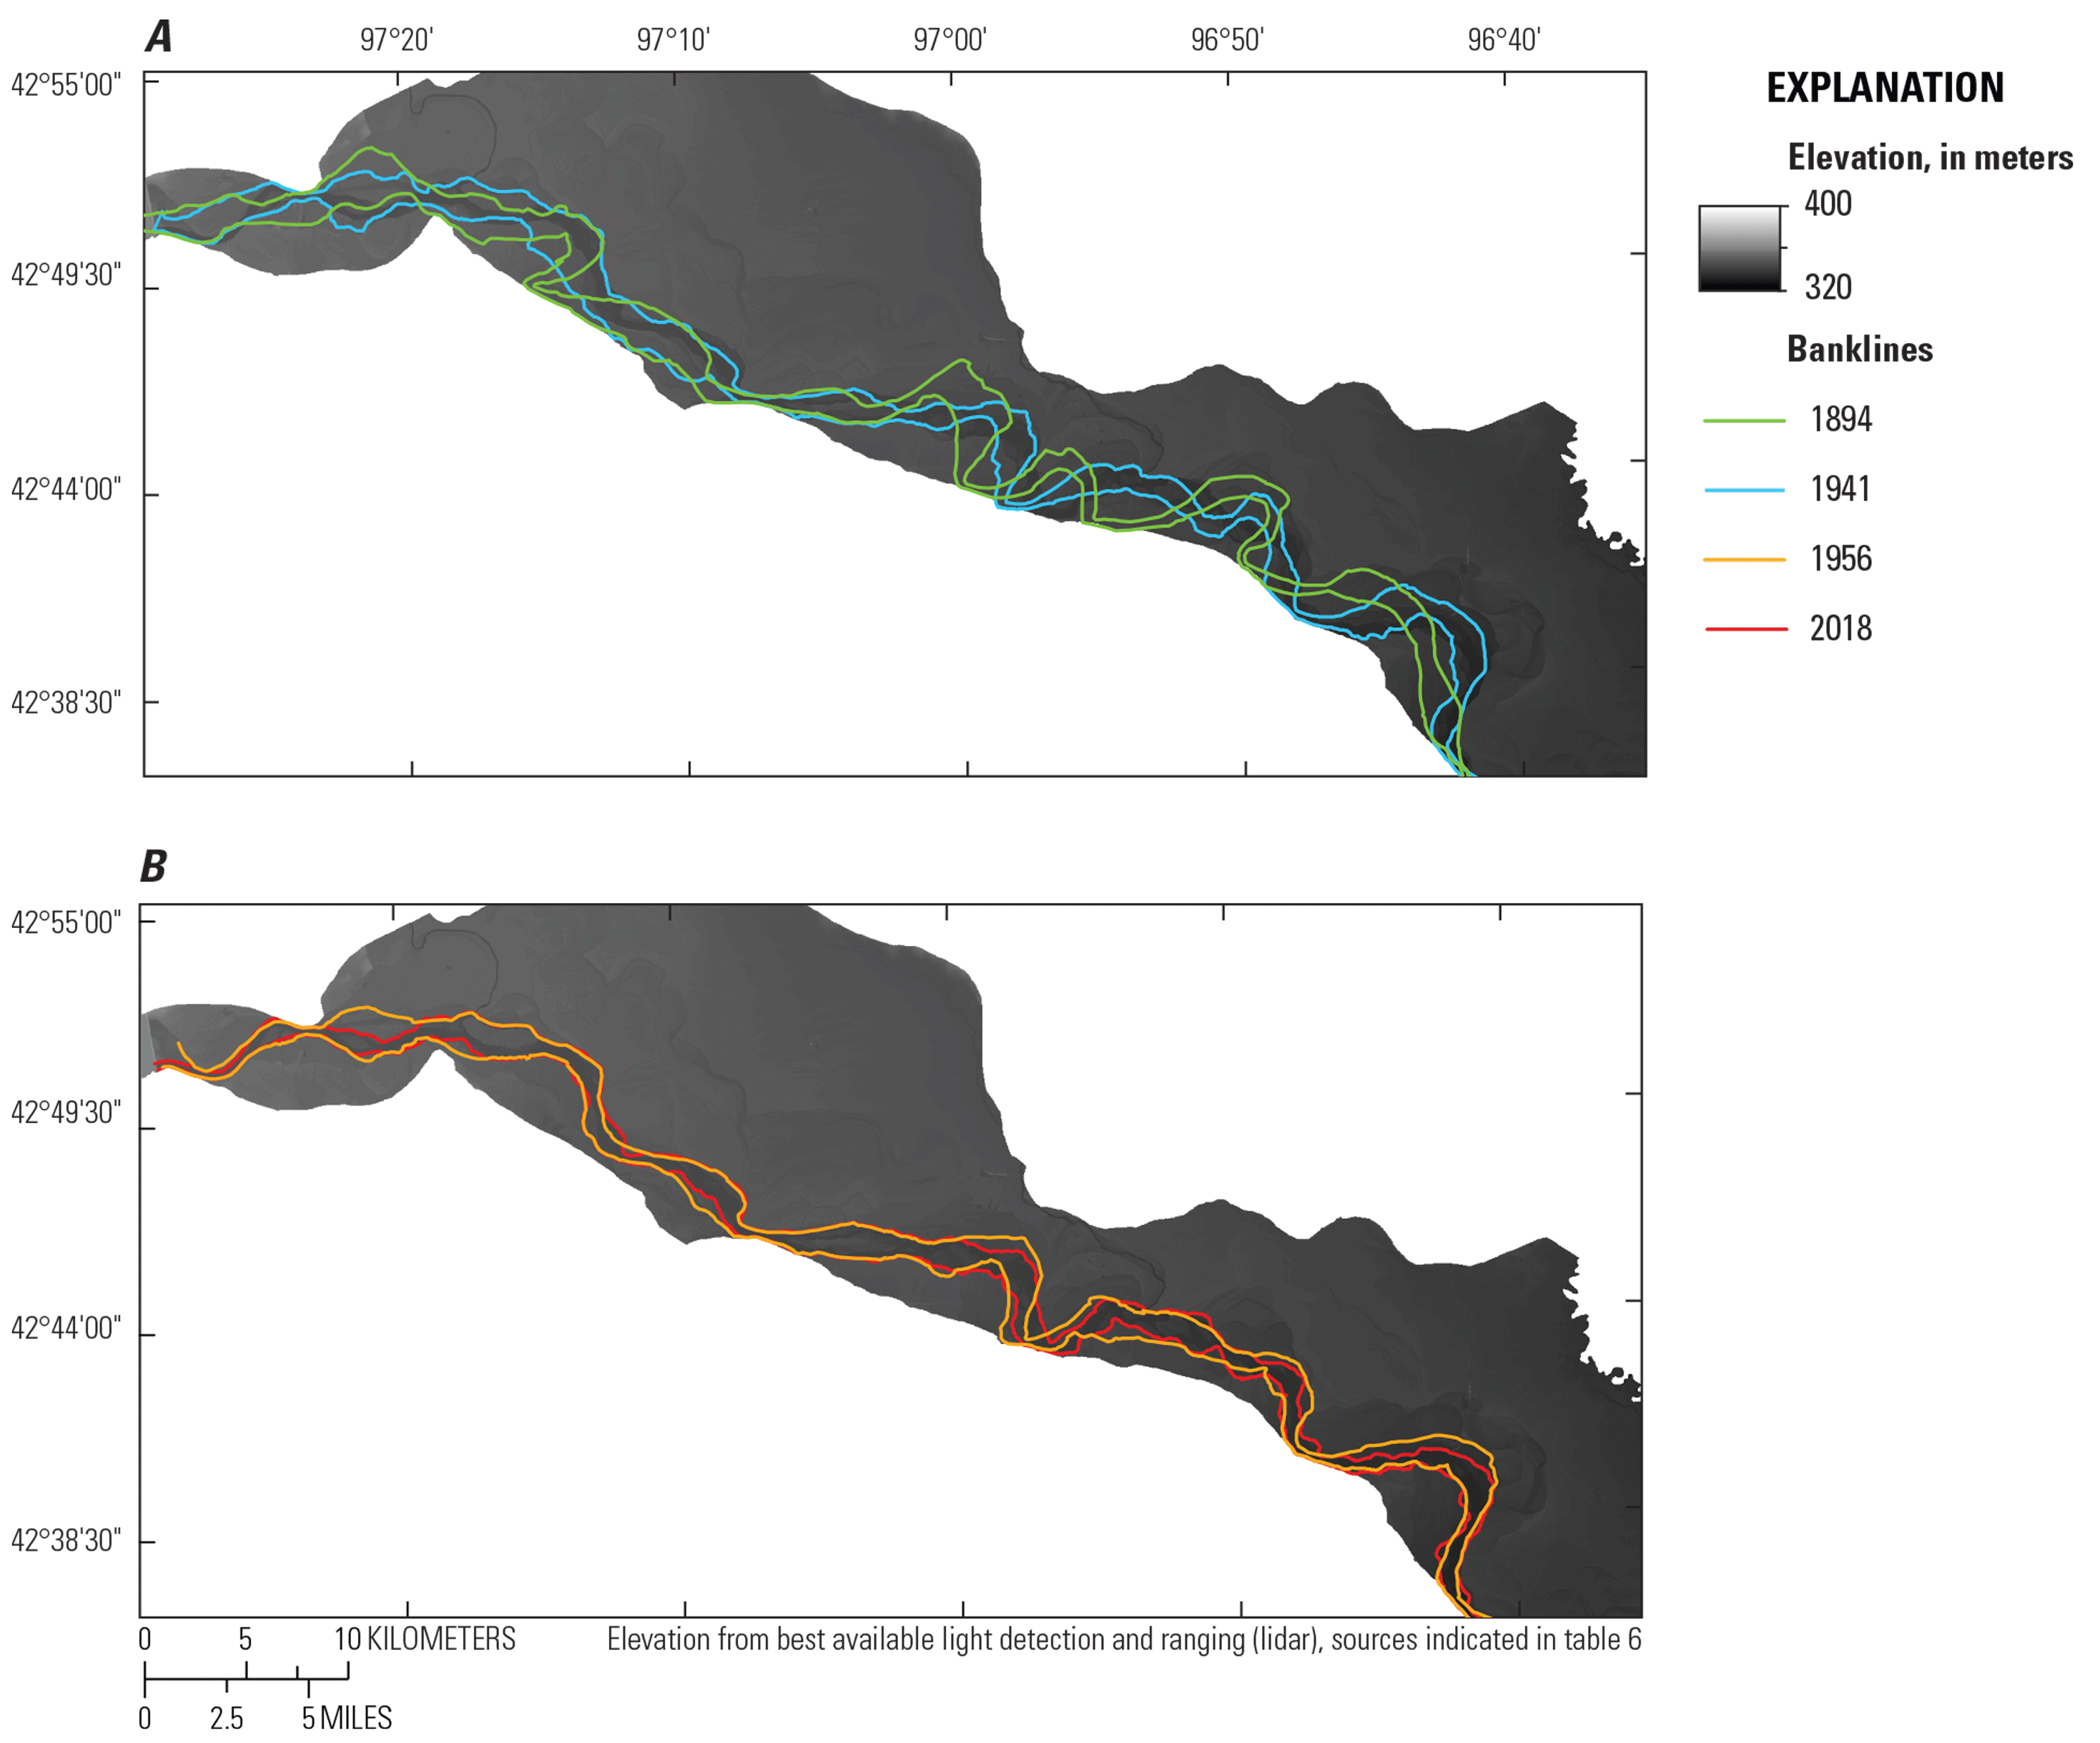
Channel positions for the 59-mile segment of the Missouri National Recreational River. A, Pre-dam period. B, Post-dam period.
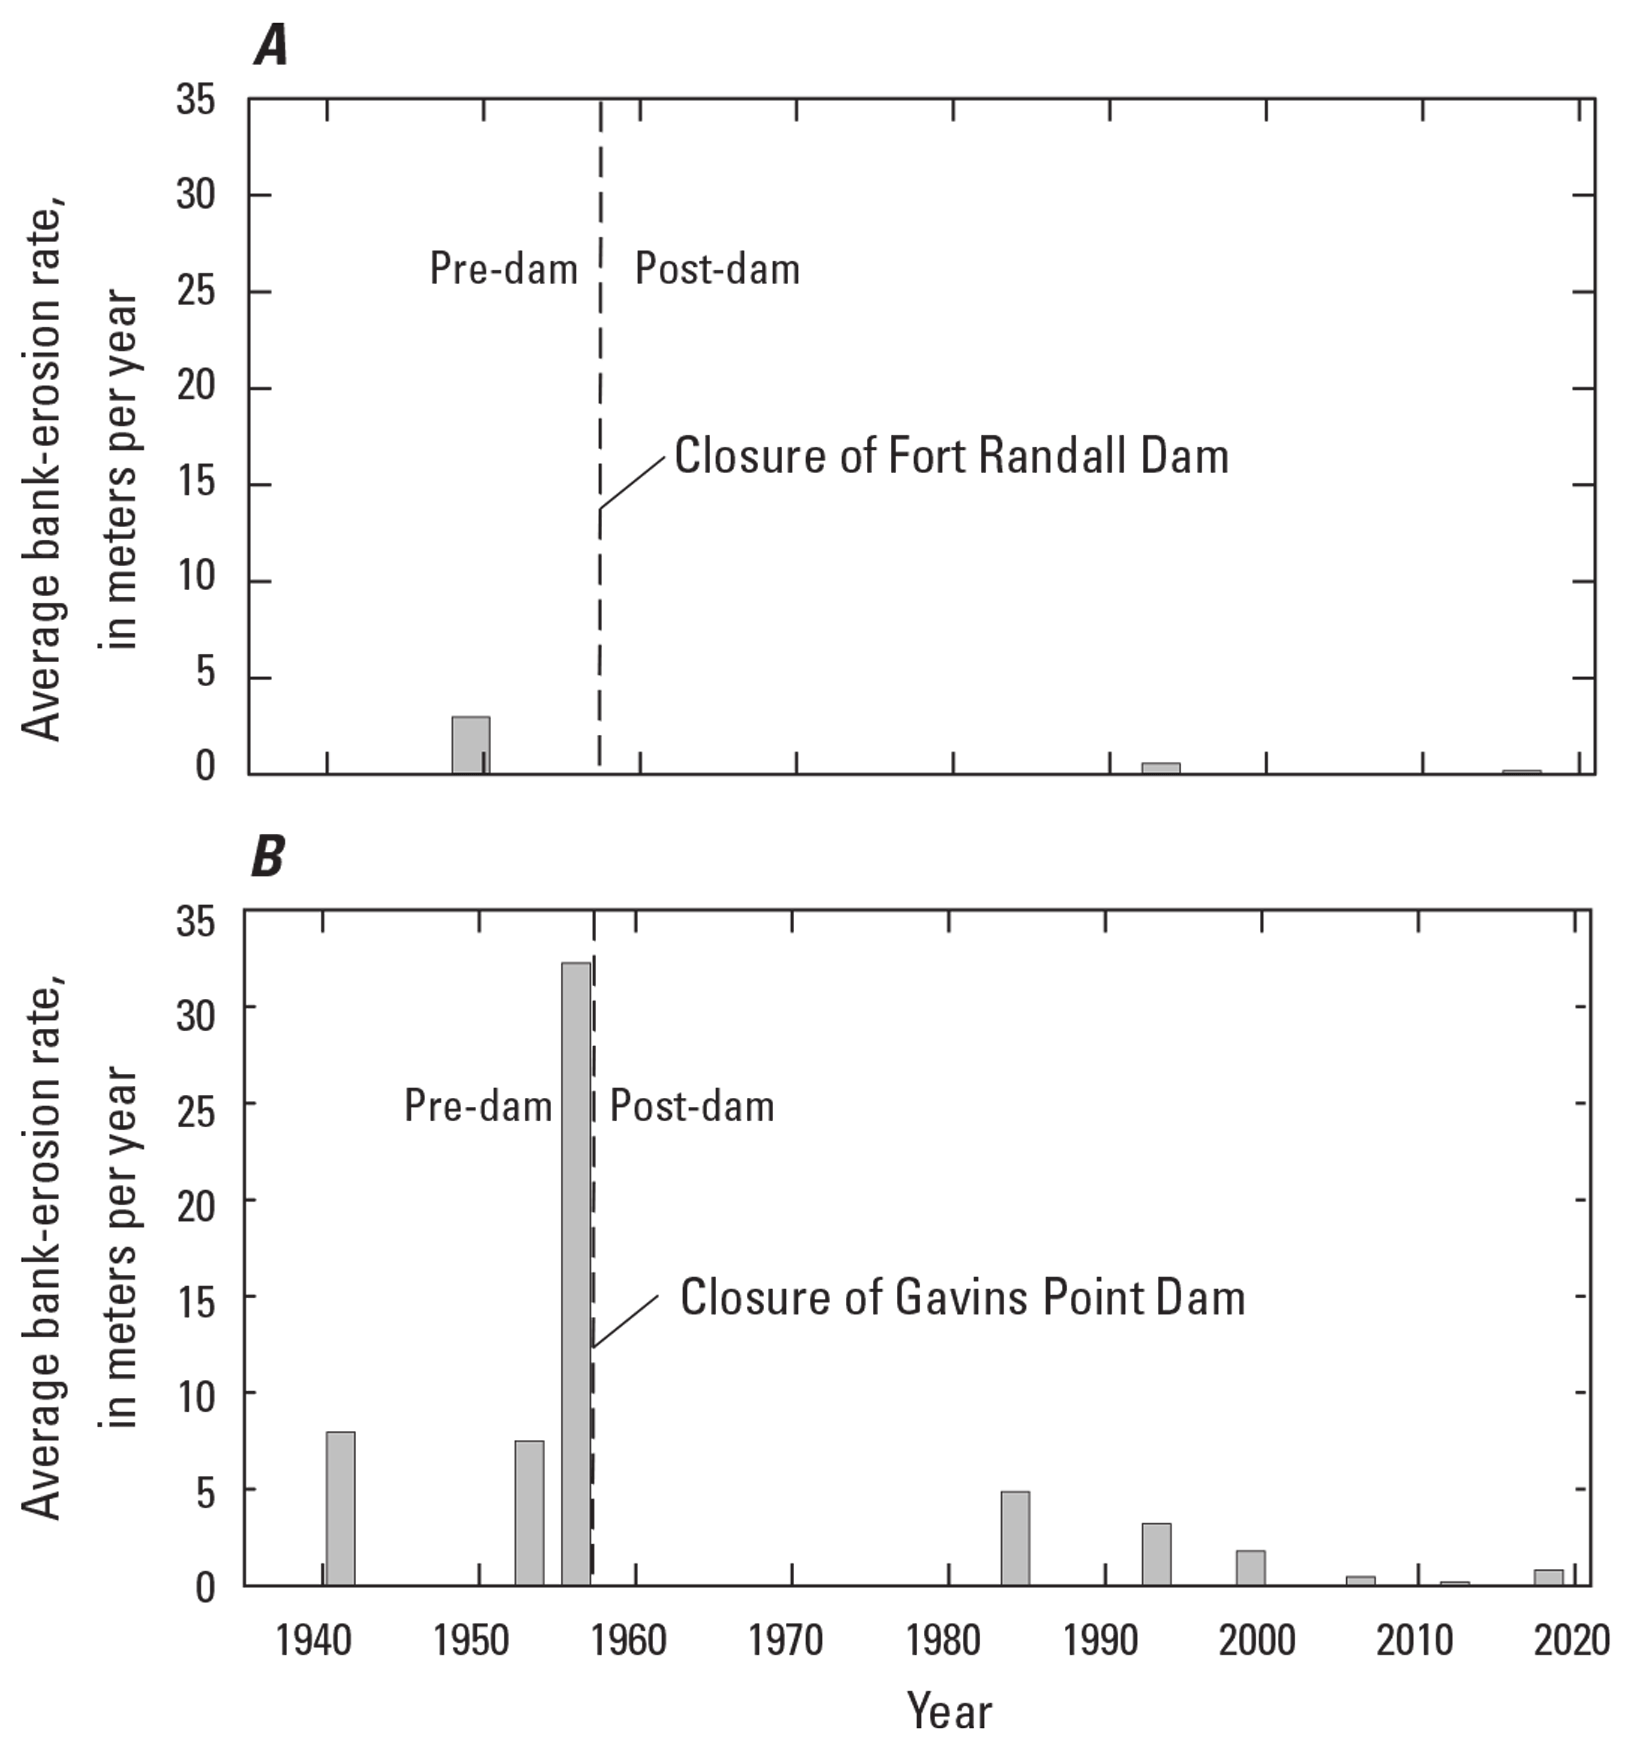
Average bank erosion rates in meters per year in Missouri National Recreational River segments. A, 39-mile segment. B, 59-mile segment.
Bank-Erosion Hotspots
Bank-erosion areas larger than 5,000 m2 exist throughout the 59-mile segment downstream from river mile 805. These are updated from the erosion polygons identified through 2004 by Elliott and Jacobson (2006). Most bank erosion from the 2005–18 time period occurred in the same places identified from 1993 to 2004. The largest new region identified as a bank-erosion hotspot was the Ponca State Park backwater near river mile 755. Most of the erosion measured there was the result of dredging related to a backwater restoration completed in 2004 (Krahulik and others, 2015) and is thus anthropogenic. This area had limited bank erosion prior to 2004. No bank-erosion hotspots were identified in the 39-mile segment.
Channel-Migration Zones
Historical channel-migration zones were identified for the 39-mile and 59-mile segments from previous channel positions and predictions of future channel movement based on past bank-erosion rates and the DSAS regression model. The historical corridor and predictions based on DSAS regressions of past rates provide an indication of the proportion of the valley bottom that is likely to be subject to channel migration over decadal timeframes, although future encounters of eroding banks with new bank materials have not been assessed. Shapefiles of the 10- and 20-year projections are available in the USGS data release (Elliott, 2022).
39-Mile Segment
The post-dam channel-migration zone for the 39-mile segment includes channel positions in 1949 (the closest year to dam closure available) and from 1993 to 2016 (the 1894 channel position is provided for pre-dam context, fig. 30). Channel positions in 1949, 1999, and 2016 were used to define the historic channel. Bank erosion is likely to occur only on unprotected banks upstream from the Niobrara River. The 2016 channel occupies 40 percent of the valley bottom; the historic channel-migration corridor amounted to 45 percent of the valley bottom, which is only 5 percent more of the valley than the river currently occupies (fig. 30).
In the 39-mile segment, DSAS bank-erosion simulations from 1993 to 2016 indicate that only 1 percent of the bankline had measurable rates of bank erosion. All measurable bank erosion was observed on the north (South Dakota) side of the river and falls into the moderate category (1.2 to 12 m per year, fig. 34). The DSAS software only predicted movement along a few small sections of the north river bank where erosion has been persistent (fig. 34). The total migration zone area for the 39-mile segment (river and delta process domains, river mile 879.6–840.6) predicted for 10 years in the future is 67.2 km2, whereas the prediction for 20 years in the future is 67.3 km2. The river corridor was 67.0 km2 in 2016 and the historical migration corridor, or total area of the valley occupied at some time between 1949 and 2016, is 70.2 km2.
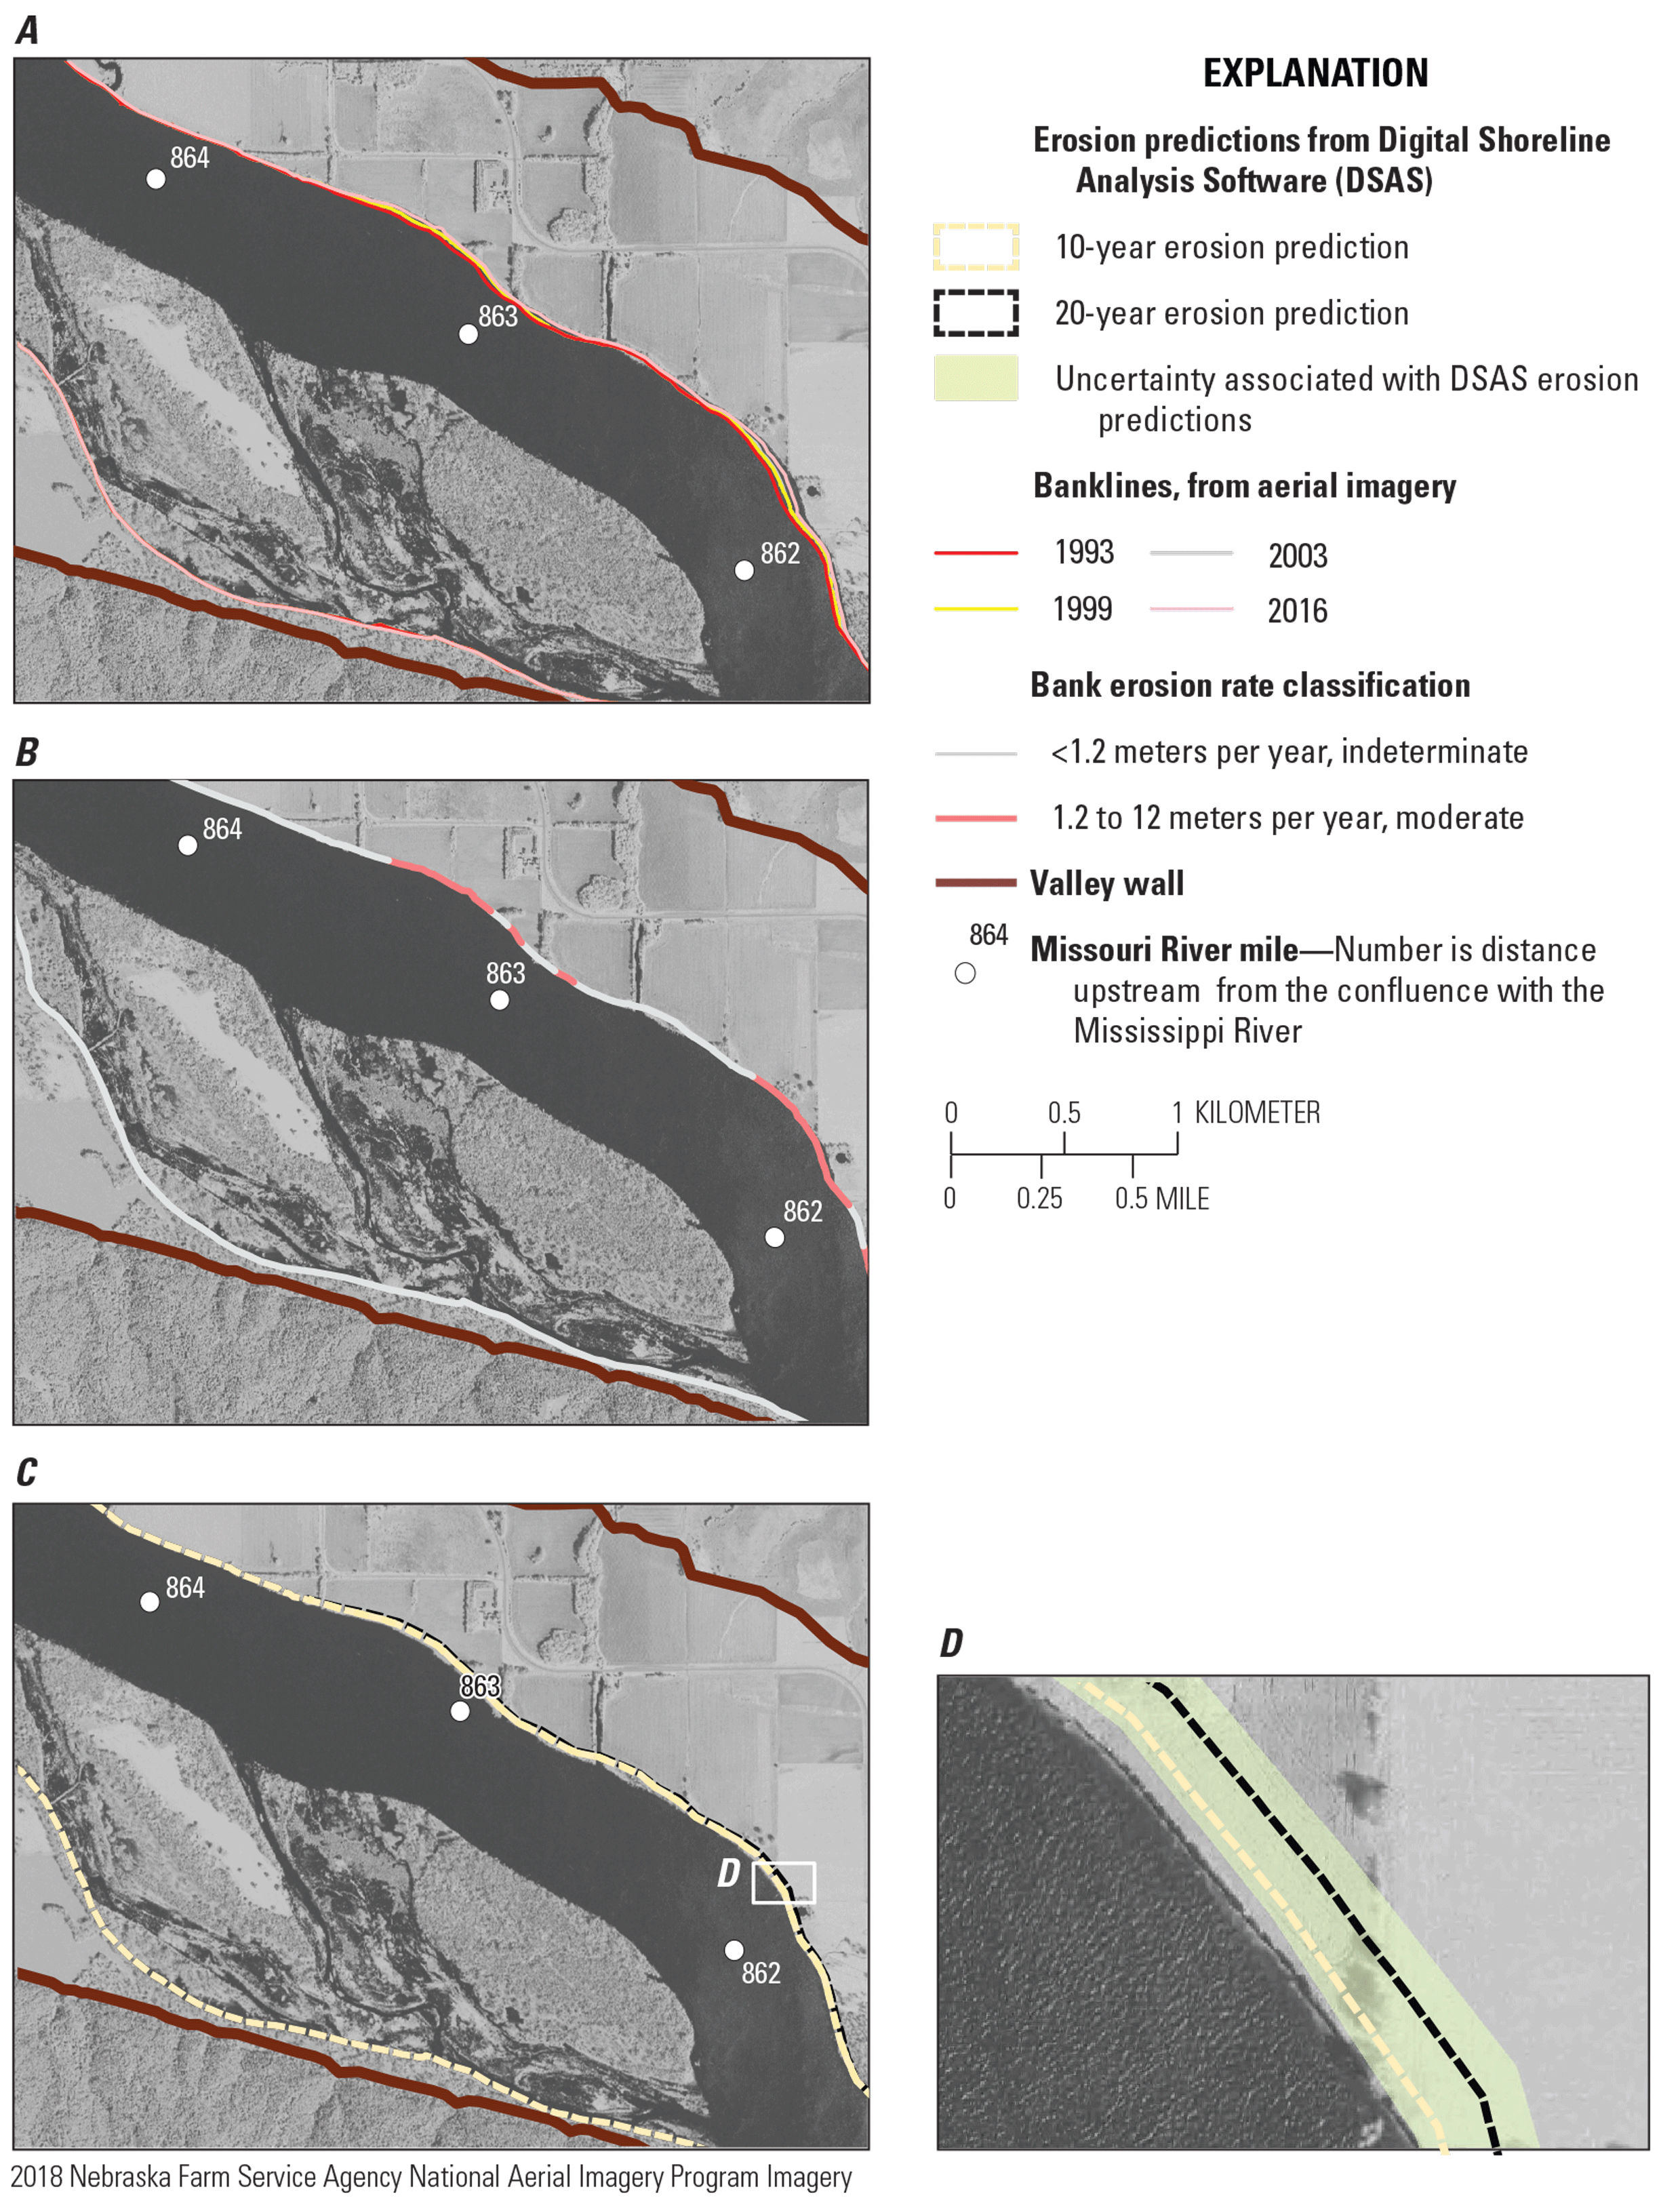
Bank erosion predictions for the 39-mile segment of the Missouri National Recreational River. A, Bankline erosion from 1993 to 2016. B, Bank-erosion classification. C, 10-year and 20-year erosion prediction from Digital Shoreline Analysis Software (DSAS). D, 10-year and 20-year erosion predictions with uncertainty buffers associated with DSAS.
59-Mile Segment
In the 59-mile segment, the alluvial valley bottom is wide, and past channel positions are evident in the topographic and surficial geologic mapping of the flood plain (Lundstrom and others, 2022). The post-dam channel-migration zone defined using post-dam channel positions from 1956, 1984, and 1993–2018 occupied 12 percent of the total valley bottom; the 2018 channel occupied 9 percent of the valley bottom (fig. 31).
From 1993 to 2016, bank erosion predictions from DSAS indicate 22 percent of the bankline had moderate erosion (29–200 m, 1.2-12 m/yr), and 3 percent had severe erosion rates (greater than 200 m, or 12 m/yr, fig. 35) with the remainder considered to have indeterminate erosion rates. The total predicted area of migration corridor at 10 years in the future is 84.4 km2, whereas the prediction for 20 years is 85.5 km2. By comparison, the present river corridor (2018) has an area of 83.8 km2 and the historically derived migration zone (1956–2018) totals 109.2 km2.
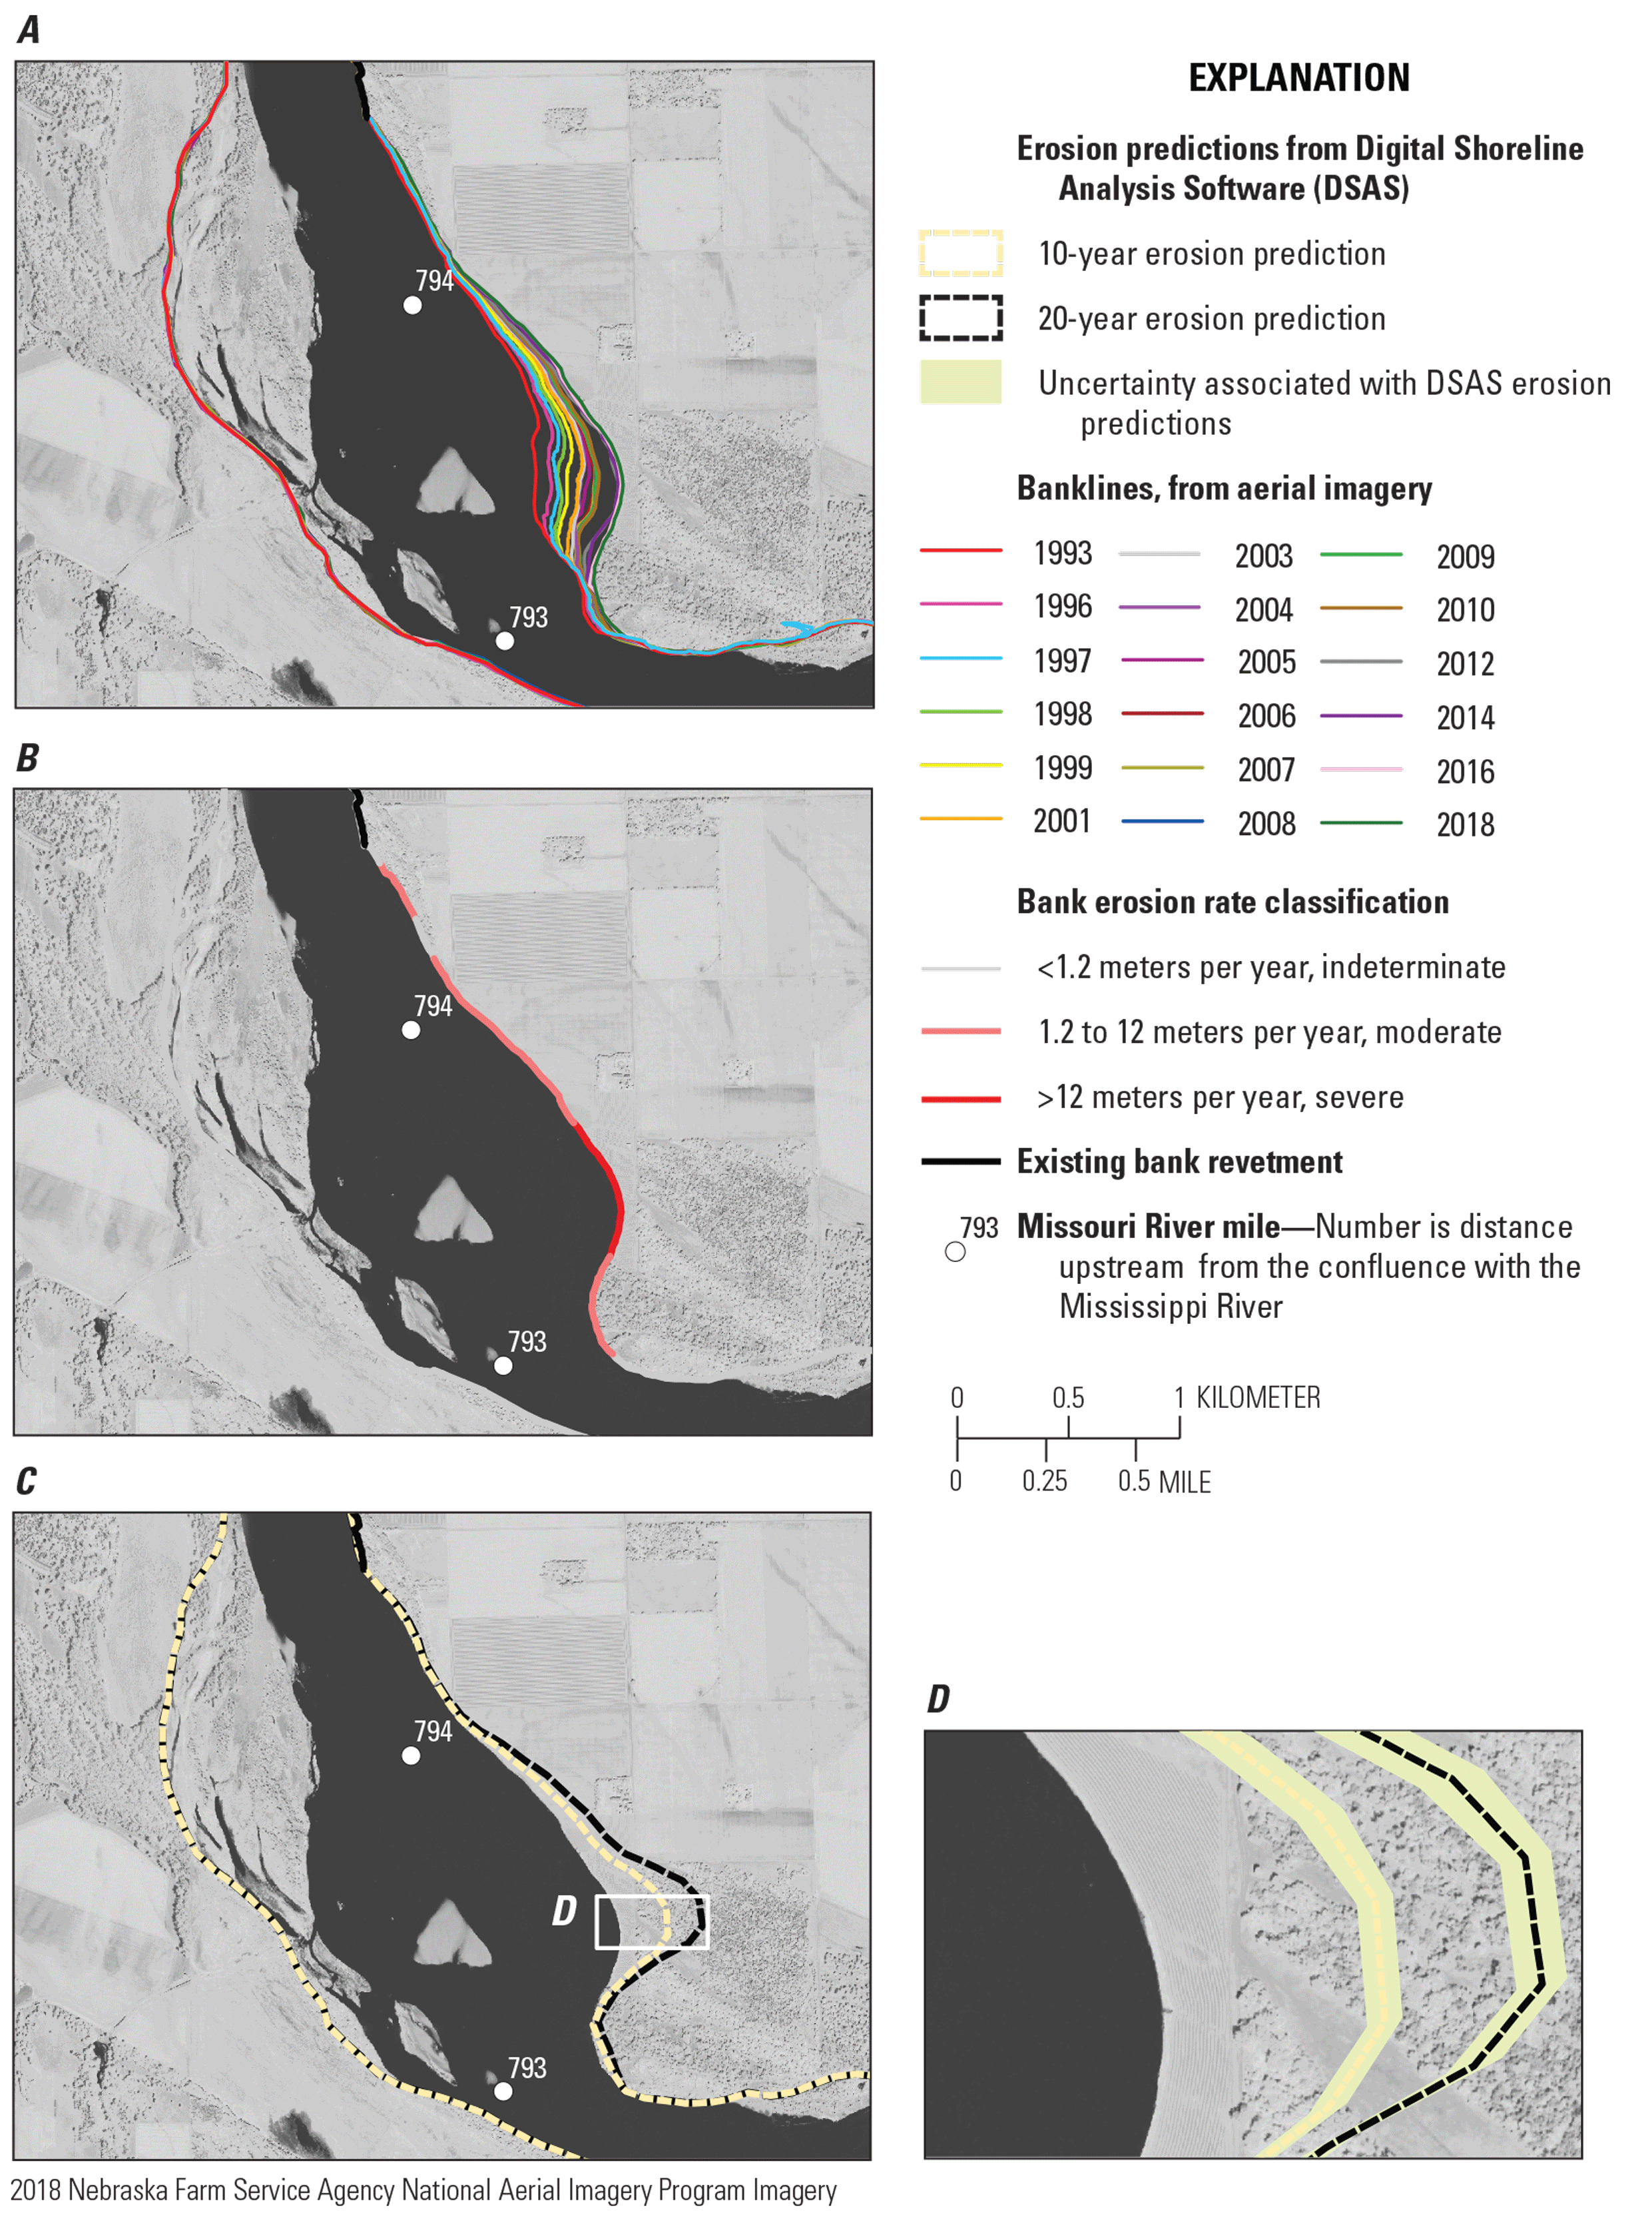
Bank erosion predictions for the 59-mile segment of the Missouri National Recreational River. A, Bankline erosion from 1993 to 2018. B, Bank-erosion classification. C, 10-year and 20-year erosion prediction from Digital Shoreline Analysis Software (DSAS). D, 10-year and 20-year erosion predictions with uncertainty buffers associated with DSAS.
Discussion
Changes in flow and sediment regimes downstream from dams typically result in geomorphic adjustments that can vary substantially along affected river segments (Williams and Wolman, 1984; Grant and others, 2003; Schmidt and Wilcock, 2008). In the MNRR, the locations of the two dams, major tributaries like the Niobrara River, and the geological context have had a strong effect on spatial patterns of adjustment. The historical datasets compiled for this study provide 60 years of information on channel dynamics in the MNRR. Although spatially limited, the cross sections resurveyed by the USACE provide understanding of subaerial and subaqueous vertical changes to bed, banks, and bars that are not otherwise documented with other means.
Spatial and Temporal Patterns of Channel Dynamics and Process Domains
Cross-section and planform analysis in the MNRR indicate the effects of dams have differed between the 39-mile and 59-mile MNRR segments. These differences are likely due to several factors, including the location of the 39-mile segment between two large dams, the presence of a moderate-sized tributary that delivers a large sediment load to the 39-mile segment, the geologic setting and narrower valley occupied by the 39-mile segment, and the narrowed navigation channel downstream from the 59-mile segment. Likewise, each segment has had a distinct geomorphic trajectory as each has adjusted to altered flow regime, sediment regime, and bank stabilization.
39-Mile Segment
The 39-mile segment is characterized by two distinct process domains: an upper river process domain (river mile 879–844) and a lower delta transition process domain (river mile 844–826). The upper domain has uniformly low rates of geomorphic change, most of which is erosional (figs. 8–10, 23; table 12). Slowing rates of erosion in the upper domain would be expected as the bed coarsens and flows continue to be mediated by the upstream reservoir.
The downstream domain, which is a transition from river to delta (river mile 844–826), was dominated by sediment deposition from the Niobrara River since dam closure, until around 1985 when it shifted to a mix of erosion and deposition (figs. 12, 19, 23–24). The shift to a mix of erosion and deposition is an expected response as a result of growth and progradation of the delta into Lewis and Clark Lake. As the delta has grown into the reservoir, the initial depositional space at the headwaters of the reservoir has been diminished, and the downstream domain now has a defined channel, which now is in equilibrium with the post-dam flow regime. As the delta continues to grow into Lewis and Clark Lake, the length of transitional channel domain is also expected to grow, although at a lower gradient compared to the upstream domain. Over decades, the deltaic reach is likely to evolve from braided-meandering form into a meandering, single-thread channel. Associated changes in habitats will likely be fewer midchannel bars, more bank-attached point bars, a narrower channel, slower current velocities, and frequent overbank connections to the flood plain.
Downstream from the transition zone, the delta presents a complex process domain completely unlike the historical river. Our analyses document that erosion occurs in the subaqueous channels documented in the cross sections in the delta and Lewis and Clark Lake, similar to erosional processes documented in the distributary channel network in the Wax Lake Delta, Louisiana (Shaw and Mohrig, 2014). Generally, in the delta and reservoir, geomorphic activity is dominated by slow, steady deposition of sediment (figs. 13–14, 19C), which has gradually increased the elevation of the channel thalweg (fig. 23). The trend in sedimentation was noticeably interrupted with a substantial increase as a result of the 2011 flood (fig. 13).
Delta/backwater systems and interdam transitional sequences are increasingly being recognized as novel ecosystems on the Missouri River and other large rivers (Skalak and others, 2013; Volke and others, 2015; Volke and others, 2019). Specifically, the delta domain of the 39-mile segment has been recognized as warmer and more turbid than reaches upstream and closer to the dam. Deltaic conditions have been associated with a downstream shift of sauger spawning habitat into the delta (Graeb and others, 2009). Similar deltas associated with Missouri River reservoirs have allowed for expansion of wetland and bottomland hardwood vegetation communities that would not be as extensive under unimpounded conditions (Volke and others, 2015, 2019115). Although the delta provides for enhancement of some habitats, the persistent deposition and growth of the delta into Lewis and Clark Lake have also resulted in decreased storage capacity and increased flood risk for surrounding municipalities. Gavins Point Dam was not designed to bypass sediment through normal operations, so innovative solutions have been sought to address the decreasing storage, including sediment flushing through reservoir drawdown and refilling (National Research Council, 2011) and transport of sediment around the lake and dam through a slurry pipeline (Coker and others, 2009). Model simulations of flushing scenarios for Gavins Point Dam predicted that most scour would occur in the delta region and sediment would be redeposited in Lewis and Clark Lake rather than being transported over the spillway (Ahn and others, 2013). Our analysis of historical surveys from after the 2011 flood indicates a similar trend of scour in the delta and deposition farther downstream (figs. 9–11, 18).
59-Mile Segment
The 59-mile segment can be characterized by two distinct process domains: a relatively stable upstream domain across river mile 811–801 (fig. 15) and a more dynamic downstream domain across river mile 801–752 (figs. 16–18). Although the 59-mile segment is dominated by bed and bank erosion since the closure of Gavins Point Dam (figs. 8, 19, 23; table 12), temporal variation in thalweg elevation and less variability in gross change over time indicates the upper domain is much less dynamic than the lower domain (figs. 8B, 25). Diminished rates of change of thalweg elevation near the dam is likely due to armoring (coarsening) of the bed sediments near the dam which, over time, limits the potential of the river to erode bed sediments, as well as confinement by revetment, which limits the river’s ability to widen or migrate through bank erosion. Downstream from river mile 801, rates of thalweg elevation change have remained high since dam closure (figs. 19, 25). From 1960 through 2007, changes in thalweg elevation varied substantially spatially and temporally, with many cross sections having erosion in one time period followed by deposition in the next. In 2011, however, all cross sections except one showed substantial incision, indicating that large floods can temporarily disrupt trends towards stability. Total gross change from 1955 to 2011 increases farther from the dam as well and indicates that the most dynamic cross sections through time occur between river mile 780 and 760 (fig. 8B). Cumulative volume plots of cross-section changes (fig. 20) similarly show increasing dynamism downstream, especially downstream from river mile 784. Continuing channel changes in the downstream domain indicate that although the channel may be approaching equilibrium, dynamic changes persist around that equilibrium condition.
Trends and Implications of Long-Term Channel Changes
Understanding of trends in channel changes over multidecadal timeframes may be useful to guide long-term management decisions (for example, where to target restoration activities or bank-erosion mitigation). Trends in channel change indicate that both river segments may be adjusted to a new equilibrium state characterized by decreasing rates of net channel change (fig. 21) and bank erosion (fig. 33; table 12). This trend is indicative of movement toward an equilibrium form after initial adjustment to the decrease in sediment load and diminished flood peaks.
In the 39-mile segment, a long-term trend in decreasing net and gross change was interrupted by increased erosion associated with the 2011 flood (figs. 19A, B); the related response in Lewis and Clark Lake was a substantial increase in deposition (fig. 19C). The effects of the 2011 flood were also evident in the 59-mile segment as an increase in gross geomorphic change in the 2007-2011 resurvey (fig. 19D), which disrupted the decreasing trend over time. The substantial amounts of erosion and deposition associated with the 2011 flood event were nearly equal, resulting in a small net change.
The long-term bed erosion trend in the 59-mile segment has caused the formation of post-dam flood plain that is substantially lower than and inset to the banks of the pre-dam flood plain (fig. 36). Because of this incision, the channel has been able to contain rare, high-magnitude, and long-duration post-dam flood events such as the 1997, 2011, and in 2019 floods. In the 59-mile segment, 61 percent of the overbank area that flooded in 2011 was flood plain that formed after dam closure (mapped as 1956 or later, fig. 31). The remainder of the flooded area in 2011 occurred on older surfaces, such as portions of areas mapped as channel in 1894 or 1941, or as backwater flooding of tributaries and small flood-plain drainage channels. Imagery of flooding taken in August 1997 indicates that many of the post-dam inset flood-plain surfaces were also underwater by the 1997 flood. The reduced valley-bottom flooding in the 59-mile segment contrasts with channelized river segments downstream that experienced extensive overbank flooding and flood plain sand deposition during the flood of 2011 (Alexander and others, 2013; Jacobson and others, 2015).
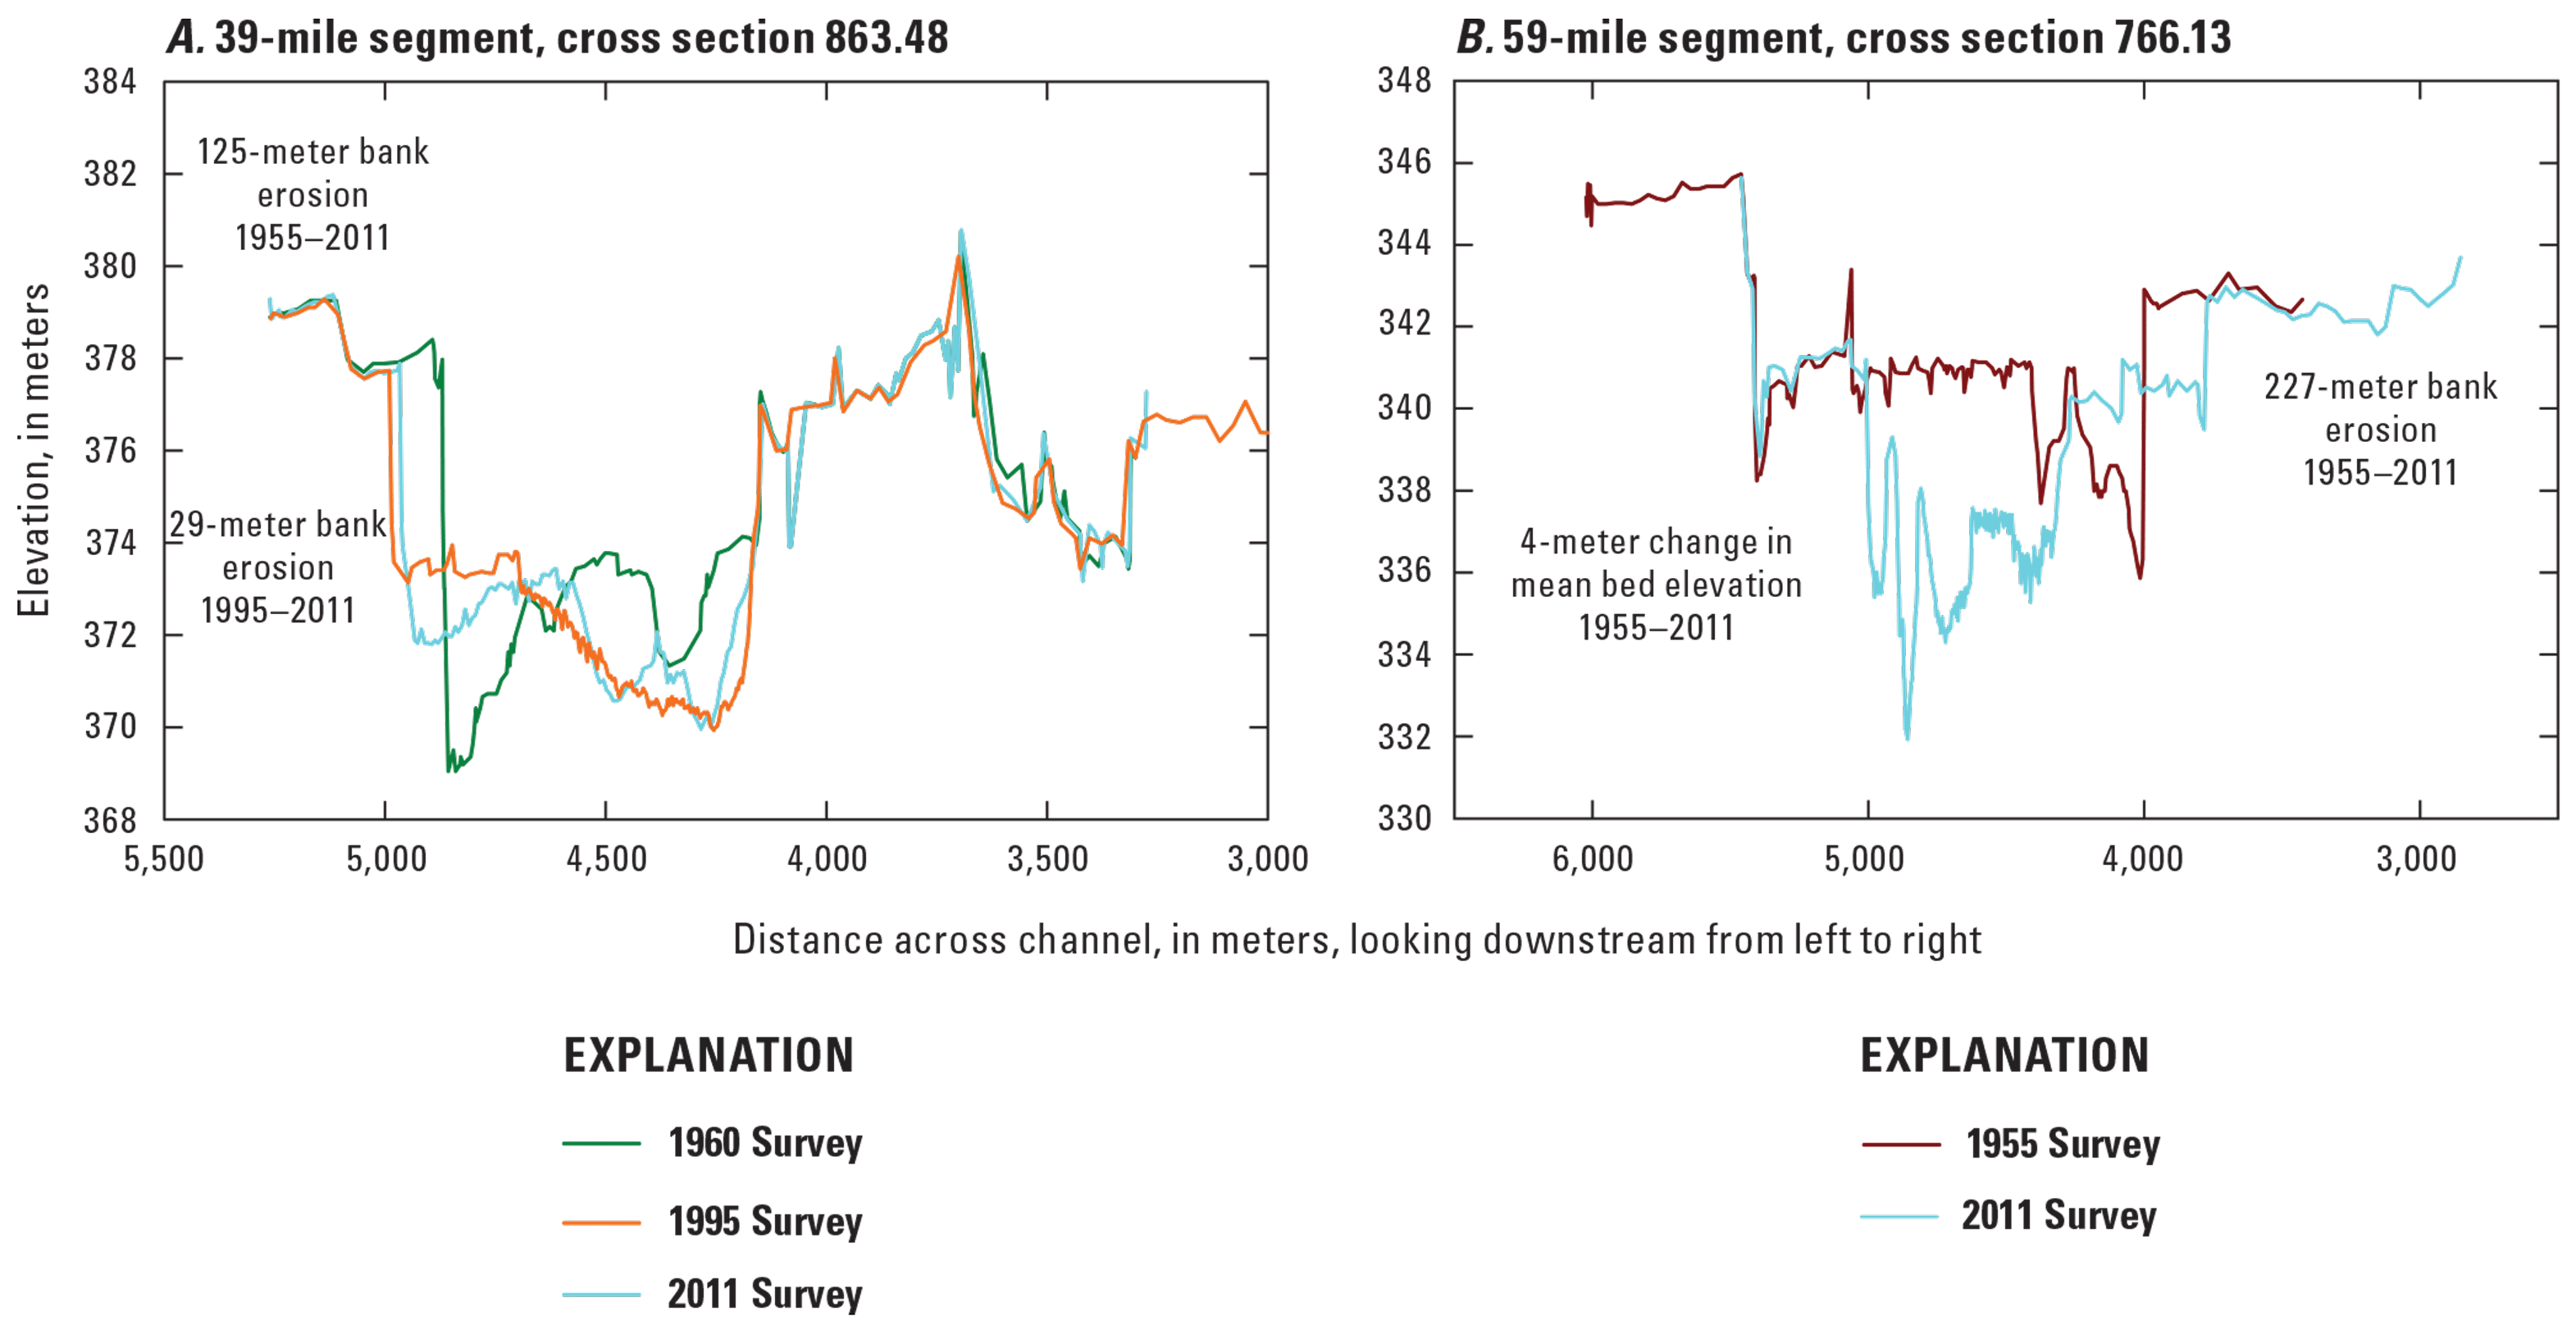
Channel changes and bank positions from 1955 to 2011 at river mile 766 in the 59-mile segment of the Missouri National Recreational River. A, 39-mile segment, cross section 863.48. B, 59-mile segment, cross section 766.13.
It is difficult to confidently evaluate how channels of the MNRR segments adjusted in the years following the 2011 flood because no post-flood cross-section resurvey data were available in the 39-mile segment, and only a few cross sections were resurveyed in the 59-mile segment in 2013. The cross sections surveyed in 2013 show that sandbars deposited by the 2011 flood had been lowered and eroded laterally and that sediment was depositing on the bed, which increased thalweg locations relative to those observed after the 2011 flood. Likewise, no topographic survey data are available to document the effects of the 2019 flood, which had the second-highest post-dam flow peak and a record of 271 days with flows greater than 60,0000 ft3/s (table 2; fig. 3). Aerial photographs show that the 2019 flood deposited large sandbars (fig. 22) and likely further scoured the bed. A comparison of the responses from the 2011 and 2019 floods would provide additional valuable information on the ability of rare, large, post-dam floods to disrupt equilibrium and on the longer-term effects of flood events.
The trends in decreasing bed and bank and decreasing gross geomorphic change were interrupted by anomalous increases in erosion during the 1970–75 interval. Unlike the rare flood of 2011, this anomaly appears to be related to a specific sequence of moderate flow events (fig. 2). Specifically, the sequence of relatively low flow years after 1953 slowly increase in magnitude through 1970–72, as seen in both Fort Randall (fig. 2A) and Sioux City (fig. 2C) discharge records. Although none of the peak flows during these years rank in the top 18 peak floods since edam closure (table 2), and peak daily discharges were only on the order of 15 percent higher than the preceding years, they are associated with the 1970–74 surveyed anomalies. We interpret the channel response as a result of a sequence of years with limited geomorphic work, which allowed sediment to build up in the channel and set up the opportunity for a moderate increase in flows to re-organize the bed.
Although long-term bank-erosion rates indicate a trend toward a new channel equilibrium adjusted to the diminished sediment load and flood peaks of the managed river system, the MNRR channel remains dynamic. The dynamism is particularly evident in cross sections downstream from river mile 801 where the standard deviation of thalweg elevation changes from 1955 to 2011 is twice that of cross sections upstream, closer to the dam (figs. 23, 25, 36). The presence of persistent channel dynamics in the 59-mile segment indicates that flood events and sediment supply are not completely limiting maintenance of the braided-meandering river nor the creation, maintenance, and modification of diverse riverine habitats.
Sandbar Dynamics
Measurements of sandbar surfaces deposited by the 2011 flood in the 59-mile segment show that the flood deposited sandbars to average heights of up to 70 percent of the total flow depth (Alexander and others, 2020b). This result has implications for the ability of managed floods to build sandbars high enough for least tern and piping plover nesting success. High-elevation sandbars were also documented from the 2011 flood event in other Missouri River segments, such as the segment below Garrison Dam (Schenk and others, 2014; Skalak and others, 2017) and on the Lower Missouri River further downstream of Rulo, NE (river mile 500) where a majority of surveyed channel topographic cross sections showed thalweg scour and bar deposition from the 2011 flood event (Gibson and Shelley, 2020). Rare, large floods create habitat which has subsequently resulted in increases in nesting populations of terns and plovers (Hunt and others, 2017; Nefas and others, 2018). The lack of upstream sediment supply does not diminish the potential for USACE to use high-flow events to occasionally create sandbar habitat for least tern and piping plover nesting (Hunt and others, 2017).
Sandbars built by floods decrease in area over time as subsequent flows erode them, and sandbar persistence is more likely for large sandbars formed by large flood events (Elliott and Jacobson, 2006; Buenau and others, 2018; Alexander and others, 2020a). Analysis indicates, however, that the size and shape of large bars is transient (figs. 21–22) because these bars are subsequently eroded laterally, which is a process also observed on the Platte River and the Missouri River downstream from Garrison Dam (Alexander and others, 2020a). Similarly, geomorphic change measurements using lidar from 2011 and 2014 on three large MNRR sandbars indicated lateral fluvial erosion was the dominant process in bar erosion after the 2011 flood (Schenk and others, 2014; Sweeney and others, 2019). Eolian (wind) processes also have been implicated as initial erosional agents, which can scour over the tops of sandbars and form gravel pavements that stabilize sandbar surfaces (Sweeney and others, 2019). Vegetation colonization on the sandbar top surface over time can also trap windblown sand, but sandbar permanence was ultimately limited by fluvial erosion of the perimeters of bars (Sweeney and others, 2019). Notably, the cross-section analysis indicates that scour and fill of the bed under the water surface provides information about sandbar dynamics apparent from bathymetric cross-section resurveys but is not captured in imagery or lidar surveys.
Empirical Predictive Model for Channel Migration
Because of the hydraulic complexity of the braided-meandering river system, an empirical-historical approach was used for predicting bank erosion and channel migration, which indicates the magnitude and spatial variability of bank-erosion hazard in the MNRR, or conversely, zones where conservation management or ecological restoration may serve to diminish risk. Valley constraints and existing bank revetments provide some constraints on channel movement, but channel movement is mostly unrestrained, particularly within the larger Missouri River valley in the 59-mile segment (fig. 29), which is likely due to cohesive flood plains being far away from the modern channel.
Few locations in the 39-mile segment have bank-erosion rates that are high enough to be measured using aerial photography methods; hence, the empirical approach to predicting channel migration was limited in this segment. When compared to the 59-mile segment, bank-erosion rates were low in the 39-mile segment, amounting to an averaged 0.16 linear m/yr from 1993 to 2016 in the 39-mile segment, compared to a linear rate of 1.09 m/yr measured for the 1993–2018 time period in the 59-mile segment (fig. 33; table 12). Higher bank-erosion rates in the 59-mile segment allowed for a more precise and relevant prediction model.
The historical channel-migration zones and bankline predictions quantified for this study identify areas of the MNRR that are most susceptible to channel movement through bank erosion. The 1949 (in the 39-mile segment) and 1956 (in the 59-mile segment) channel boundaries define the river close in time to dam closure and delineate the line between pre-dam and post-dam flood-plain deposits. Within the post-dam channel-migration zone, there are many accreted areas that were river channel when the dam was closed and have subsequently accreted and (or) stabilized with vegetation (1949 and 1956 surfaces in figs. 30–31 and fig. 36B). These surfaces are common in the 59-mile segment, are 2 to 3 m higher than median water-surface elevations, and are inset into the more-extensive, pre-dam flood plain. An example of this is the long-term cross section 766.13 located near river mile 766, where mean bed elevation decreased 4 m from 1955 to 2011 and an inset flood plain was deposited within the high, pre-dam banks (figs. 31 and 36B).
Many of the areas between the 1955 high banks that accreted after dam closure have become bank-erosion hotspots during the past few decades (fig. 31, for example, see near river mile 769, right descending bank, and near river mile 766, right bank upstream and left bank downstream), indicating reworking of post-dam flood-plain deposits. Of the measurable bank erosion between 1993 and 2018, 64 percent occurred into these post-dam inset surfaces. Many of these surfaces were underwater during the 2011 flood despite appearing to be mostly dry in aerial photographs taken during recent decades (fig. 36B). In some cases, these accreted deposits have been converted to agricultural fields. These inset flood-plain surfaces may be prospects to target for restoration of native flood-plain vegetation such as cottonwoods (Jacobson and others, 2011; Dixon and others, 2012). When bank erosion occurs on these surfaces, the river reworks post-dam sediments and deposits a new flood plain, which is adjusted to the lower flood peaks and smaller sediment supply of the modern river; hence, restoration efforts in these areas may be more sustainable.
In both MNRR segments, banks that consist of flood-plain deposits that pre-date the 1956 or 1894 channel boundaries are locations where bank erosion may adversely affect pre-European cultural features; these areas may be targeted for management of cultural resources including monitoring or mitigating for bank erosion. In the 39-mile segment, for example, one of the areas with fairly low yet measurable bank-erosion rates is on the north bank near river mile 862 (figs. 30, 36A). At that site, the channel is eroding laterally into flood-plain sediments that have not been within the channel since dam closure (pre-dam surfaces), and that are potentially older than 1894. Several other similar locations with rates that are low but detectable by aerial photography occur in the 39-mile segment along the north bank. Examples of bank erosion into pre-dam surfaces in the 59-mile segment include the left descending bank near river mile 770 and 765 (fig. 31). Some locations where historic (pre-dam closure) flood plain is eroding are currently protected by bank revetment (for example, the south banks near river mile 768 and 762–761; fig. 31). These locations would be good places to target for bank protection, if the preservation of cultural resources is a management objective of concern.
Summary
The 39-mile and 59-mile Missouri National Recreational River (MNRR) segments of the Missouri River managed by the National Park Service are highly valued because they preserve the anastomosing braided-meandering channel features that were present in the pre-regulated Missouri River but are rare today. The MNRR river segments were not channelized or inundated by reservoirs and have wide natural reaches with multiple channel threads, islands, dynamic sandbars, backwaters, and eroding banks despite being immediately downstream from large dams that have considerably reduced peak flows and disrupted the sediment regimes. The 39-mile segment is an inter-reservoir segment which transitions from a river process domain to a delta process domain to a lake process domain as it flows downstream from Fort Randall Dam to Lewis and Clark Lake. The 59-mile segment downstream from Gavins Point Dam is upstream from a highly managed and altered navigation channel that flows over 1,000 kilometers downstream to St. Louis, Missouri. Management by the National Park Service seeks to preserve the natural, cultural, and recreational features of the MNRR as well as understand bank-erosion processes and trends.
Channel geometry trends from cross-sections surveyed by the U.S. Army Corps of Engineers since dam closure show that in the 39-mile segment, bed erosion downstream from Fort Randall Dam transitions longitudinally to channel aggradation near the confluence with the Niobrara River and the delta of Lewis and Clark Lake. Channel capacity, as measured in net cross-section area, has increased in the river process domain of the 39-mile segment and decreased in the Lewis and Clark delta and reservoir from 1955 to 2011. From 1955 to 2011, cross sections closer to Fort Randall Dam show consistently higher rates of erosion compared to downstream; erosion rates begin to decrease around river mile 865, and although there is some cross-section variability, mean erosion rates continue to decrease to the confluence with the Niobrara River at river mile 844. The time period including the 2011 flood event (2007–11) had large areas of erosion and deposition at individual cross sections, with trends of net bed erosion in the river process domain of the 39-mile riverine segment and in the delta, and net aggradation of sediment in Lewis and Clark Lake.
In the 59-mile segment downstream from Gavins Point Dam, analysis of historical cross-sections show that mean cross section area has increased through erosional processes since the closure of Gavins Point Dam. There has been an average of 3.5 meters of bed incision in the thalweg over the entire segment, and stage trends show that channel incision extends far downstream in the Missouri River navigation channel. The highest thalweg incision of over 5 m is at the downstream-most cross-section 93 kilometers below Gavins Point Dam. Immediately downstream from the dam, the channel banks are confined by coarse rock revetment, which restricts lateral adjustment of the channel and focuses erosional energy vertically. The lack of sediment supply from the dam coupled with the higher stresses in the reach immediately downstream have caused the bed to coarsen; cross-sections closer to the dam show lower rates of thalweg elevation change in recent decades than cross sections further downstream. Analysis of cross sections indicates all time periods experienced both deposition and erosion, net erosion was the trend in every time period, and net rates of erosion have decreased through time, suggesting the river is trending towards equilibrium. The trends towards equal amounts of erosion and deposition was disrupted by the 2011 flood event; the 2007–11 time period had the largest amount of erosion (149.5 square meters per year [m2/yr] per cross section) and deposition (146.4 m2/yr per cross section) and the largest overall amount of gross geomorphic change, which was more than twice the rate of all time periods since 1974–80 (295.9 m2/yr per cross section), but relatively low net change (−3.2 m2/yr per cross section). Cross-section analysis indicates the 2011 flood event scoured the bed and created large sandbars but exported little sediment from the 59-mile segment. Surveys in the 59-mile segment in 2013 indicate that bed-scoured areas from the 2011 flood were being filled in while sandbars created by the flood were eroded laterally.
Banklines from 1894 for both MNRR segments and banklines from 1941 and 1953 for the 59-mile segment provide a record of the Missouri River corridor during the pre-dam period. In the 59-mile segment, banklines from 1953 to 1956 provide a snapshot of the period of adjustment following the closure of Gavins Point Dam in 1955 and the approximate locations of the pre-dam channel boundaries. Channel-migration zone analysis in the 59-mile segment indicates that 60 percent of the bank erosion occurring in recent decades is into post-dam surfaces that were river channel at the time of dam closure. These surfaces are inset within and at lower elevations compared to the broader flood plain and were mostly inundated by the 2011 flood. The remainder of the bank erosion is primarily into historical post-1894 channel deposits. Regression results from past bank-erosion rates from 1993 to 2016 (or 2018 depending on segment) predict where new channel movement may occur 10 and 20 years into the future in both river segments. Inundation modeling indicates that the narrower valley results in a higher percent of the flood plain inundated by flooding in the 39-mile segment. Bank revetement and the valley wall provide greater constraints to channel migration in the 39-mile segment than small colluvial and alluvial tributary fans because the valley is relatively narrow and the river banks are bordered by bedrock (48.7 percent) or bank revetments (12.4 percent) over much of this segment. In the wider valley of the 59-mile segment, there are fewer bedrock valley constraints on river migration but flood-plain mapping has documented cohesive, older river sediments in the flood plain such as those mapped as Holocene backswamp mud; these deposits are likely to be less erodible than the noncohesive sand presently being deposited by the river, although extensive bank revetments covering 31.5 percent of the banks in the 59-mile segment and bedrock covering 1.4 percent of the banks provide more immediate constraints to the channel migration. Inundation modeling indicates the incised banks of the 59-mile segment contain most high-flow events.
Trends in channel change from historical cross sections resurveyed every 5–10 years since 1955 and long-term bank-erosion rates indicate the 59-mile segment is approaching a new equilibrium, but trends are complicated by large events such as the flood in 2011 that caused large amounts of local deposition and erosion, scouring of the bed, and building high-elevation sandbars. Additional cross-sectional surveys will be needed to evaluate if current trends continue or if new trends are emerging.
References Cited
Ahn, J., Yang, C.T., Boyd, P.M., Pridal, D.B., and Remus, J.I., 2013, Numerical modeling of sediment flushing from Lewis and Clark Lake: International Journal of Sediment Research, v. 28, no. 2, p. 182–193. [Also available at https://doi.org/10.1016/S1001-6279(13)60030-X.]
Alexander, J.S., Jacobson, R.B., and Rus, D.L., 2013, Sediment transport and deposition in the lower Missouri River during the 2011 flood: U.S. Geological Survey Professional Paper 1798–F, 38 p. [Also available at https://doi.org/10.3133/pp1798F.]
Alexander, J.S., McElroy, B., Huzurbazar, S., Elliott, C., and Murr, M.L., 2020a, Deposition Potential and Flow-Response Dynamics of Emergent Sandbars in a Braided River: Water Resources Research, v. 56, no. 1, e2018WR024107. [Also available at https://doi.org/10.1029/2018WR024107.]
Alexander, J.S., McElroy, B.J., Huzurbazar, S., and Murr, M.L., 2020b, Elevation gaps in fluvial sandbar deposition and their implications for paleodepth estimation: Geology, v. 48, no. 7, p. 718–722. [Also available at https://doi.org/10.1130/G47521.1.]
Alexandrowicz, N., Moreno, A., Kashouh, M., Carlin, D., and Holbrook, J.M., 2011, Surficial material geologic map of the Gayville 7.5’ quadrangle, South Dakota, USA: University of South Dakota Press, scale 1:24,000. [Also available at http://mri.usd.edu/pubs/uta/SD-gayville.pdf.]
Bankhead, N.L., Thomas, R.E., and Simon, A., 2017, A combined field, laboratory and numerical study of the forces applied to, and the potential for removal of, bar top vegetation in a braided river: Earth Surface Processes and Landforms, v. 42, no. 3, p. 439–459. [Also available at https://doi.org/10.1002/esp.3997.]
Berry, C.R., and Young, B., 2004, Fishes of the Missouri national recreational river, South Dakota and Nebraska: Great Plains Research, v. 14, no. 1, p. 89–114. [Also available at http://digitalcommons.unl.edu/cgi/viewcontent.cgi?article=1690&context=greatplainsresearch.]
Biron, P.M., Buffin-Bélanger, T., Larocque, M., Choné, G., Cloutier, C.-A., Ouellet, M.-A., Demers, S., Olsen, T., Desjarlais, C., and Eyquem, J., 2014, Freedom space for rivers—A sustainable management approach to enhance river resilience: Environmental Management, v. 54, no. 5, p. 1056–1073. [Also available at https://doi.org/10.1007/s00267-014-0366-z.]
Blevins, D.W., 2006, The response of suspended sediment turbidity, and velocity to historical alternations of the Missouri River: U.S. Geological Survey Circular 1301, 8 p. [Also available at https://doi.org/10.3133/cir1301.]
Blevins, D.W., 2011, Water quality requirements, tolerances, and preferences of pallid sturgeon (Scaphirhychus albus) in the Lower Missouri River: U.S. Geological Survey Scientific Investigations Report 2011–5186, 20 p. [Also available at https://doi.org/10.3133/sir20115186.]
Braaten, P., Fuller, D., Lott, R., Ruggles, M., Brandt, T., Legare, R., and Holm, R., 2012, An experimental test and models of drift and dispersal processes of pallid sturgeon (Scaphirhynchus albus) free embryos in the Missouri River: Environmental Biology of Fishes, v. 93, no. 3, p. 377–392. [Also available at https://doi.org/10.1007/s10641-011-9925-9.]
Brierley, G., and Fryirs, K., 2009, Don’t fight the site—Three geomorphic considerations in catchment-scale river rehabilitation planning: Environmental Management, v. 43, no. 6, p. 1201–1218. [Also available at https://doi.org/10.1007/s00267-008-9266-4.]
Buenau, K.E., Huber, C.J., Vernon, C.R., and Hofer, C.M., 2018, Missouri River Effects Analysis integrated report—Piping plovers and least terns: Pacific Northwest National Laboratory, PNNL-27834, 234 p. [Also available at https://usace.contentdm.oclc.org/utils/getfile/collection/p16021coll7/id/8072.]
Bulliner, E.A., Lindner, G., Bouska, K., Jacobson, R.B., and Paukert, C., 2017, Science to inform management of floodplain conservation lands under non-stationary conditions: U.S. Geological Survey data release, accessed on January 15, 2019, at https://doi.org/10.5066/F7HM56KG.
Catlin, D.H., Fraser, J.D., and Felio, J.H., 2015, Demographic responses of piping plovers to habitat creation on the Missouri river: Wildlife Monographs, v. 192, no. 1, p. 1–42. [Also available at https://doi.org/10.1002/wmon.1016.]
Chojnacki, K.A., Struckhoff, M.A., and Jacobson, R.B., 2012, Land Capability Potential Index (LCPI) and geodatabase for the Lower Missouri River Valley: U.S. Geological Survey Data Series 736, 26 p. [Also available at https://doi.org/10.3133/ds736.]
Coker, E.H., Hotchkiss, R.H., and Johnson, D.J., 2009, Conversion of a Missouri River dam and reservoir to a sustainable system—Sediment management: Journal of the American Water Resources Association, v. 45, no. 4, p 815–827. [Also available at https://doi.org/10.1111/j.1752-1688.2009.00324.x.]
Costigan, K.H., and Daniels, M.D., 2012, Damming the prairie—Human alteration of Great Plains river regimes: Journal of Hydrology, v. 444–445, p. 90–99. [Also available at https://doi.org/10.1016/j.jhydrol.2012.04.008.]
Curran, J.H., and McTeague, M.L., 2011, Geomorphology and bank erosion of the Matanuska River, southcentral Alaska: 2011-5214, 52 p., [Also available at https://doi.org/10.3133/sir20115214.]
Dillon, J.S., Hanson, P.R., Young, A.R., and Howard, L.M., 2009, Surficial geology of the Obert 7.5 Minute Quadrangle, Nebraska: University of Nebraska-Lincoln, scale 1:24,000. [Also available at https://snr.unl.edu/data/geologysoils/STATEMAP/index.aspx.]
Dixon, M.D., Boever, C.J., Danzeisen, V.L., Merkord, C.L., Munes, E.C., Scott, M.L., Johnson, W.C., and Cowman, T.C., 2015, Effects of a ‘natural’ flood event on the riparian ecosystem of a regulated large-river system—The 2011 flood on the Missouri River, USA: Ecohydrology, v. 8, no. 5, p. 812–824. [Also available at https://doi.org/10.1002/eco.1613.]
Dixon, M.D., Johnson, W.C., Scott, M.L., Bowen, D.E., and Rabbe, L.A., 2012, Dynamics of plains cottonwood (Populus deltoides) forests and historical landscape change along unchannelized segments of the Missouri River, USA: Environmental Management, v. 49, no. 5, p. 990–1008. [Also available at https://doi.org/10.1007/s00267-012-9842-5.]
Dryer, M., and Sandvol, A., 1993, Recovery plan for the pallid sturgeon (Scaphirhynchus albus): U.S. Fish and Wildlife Service, 55 p. [Also available at https://pallidsturgeon.org/bibliographies/pallid-sturgeon-scaphirhynchus-albus-recovery-plan/.]
Elliott, C.M., 2022, Channel geometry, banklines and floodplain inundation over a range of discharges in two segments of the Missouri National Recreational River, South Dakota and Nebraska, 1955–2018: U.S. Geological Survey data release, accessed May 2022 at https://doi.org/10.5066/P9RZPNJR.
Elliott, C.M., DeLonay, A.J., Chojnacki, K.A., and Jacobson, R.B., 2020, Pallid sturgeon spawning habitat in the Lower Missouri River: U.S. Geological Survey data release, accessed January 2020 at https://doi.org/10.5066/F7639P23.
Elliott, C.M., and Jacobson, R.B., 2006, Geomorphic classification and assessment of channel dynamics in the Missouri National Recreational River, South Dakota and Nebraska: U.S. Geological Survey Scientific Investigations Report 2006–5313, 66 p. [Also available at https://doi.org/10.3133/sir20065313.]
Elliott, C.M., Reuter, J.M., and Jacobson, R.B., 2009, Channel morphodynamics in four reaches of the Lower Missouri River, 2006-07: U.S. Geological Survey Scientific Investigations Report 2009–5074, 270 p. [Also available at https://doi.org/10.3133/sir20095074.]
Emenhiser, S., Calvert, G., Kashouh, M., Carlin, D., and Holbrook, J.M., 2011, Surficial material geologic map of the Vermillion SE 7.5’ Quadrangle, South Dakota, USA: University of South Dakota Press, scale 1:24,000. [Also available at http://mri.usd.edu/pubs/uta/SD-vermillion.pdf.]
Fischenich, J.C., McComas, R., Meier, D., Tripe, J., Pridal, D., Boyd, P., Gibson, S., Hickey, J., Econopouly, T., and Strong, L., 2018, Habitat analyses for the Missouri River effects analysis—Geomorphic team integrative report: U.S. Army Corps of Engineers, Engineer Research and Development Center, ERDC/EL-18-XX, 148 p. [Also available at https://usace.contentdm.oclc.org/utils/getfile/collection/p16021coll7/id/8074.]
Florsheim, J.L., Mount, J.F., and Chin, A., 2008, Bank erosion as a desirable attribute of rivers: Bioscience, v. 58, no. 6, p. 519–529. [Also available at https://doi.org/10.1641/B580608.]
Fuller, I.C., Reid, H.E., and Brierley, G.J., 2013, Methods in geomorphology—Investigating river channel form, in Shroder, J.F., eds., Treatise on geomorphology: San Diego, Academic Press, v. 14, p. 73–91. [Also available at https://doi.org/10.1016/B978-0-12-374739-6.00374-2.]
Galat, D.L., Berry, C.R., Peter, E.J., and White, R.G., 2005, Missouri River Basin, chap. 10 of Benke, A.C., and Cushing, C.E., eds., Rivers of North America: Elsevier Academic Press, p. 427–480. [Also available at https://doi.org/10.1016/B978-012088253-3/50013-4.]
Galat, D.L., and Lipkin, R., 2000, Restoring ecological integrity of great rivers—Historical hydrographs aid in defining reference conditions for the Missouri River: Hydrobiologia, v. 422/423, p. 29–48. [Also available at https://doi.org/10.1023/A:1017052319056.]
Garrett, J., Alexandrowicz, N., Kashouh, M., Carlin, D., and Holbrook, J.M., 2011, Surficial material geologic map of the St. Helena 7.5’ Quadrangle, South Dakota, USA: University of South Dakota Press, scale 1:24,000. [Also available at: http://mri.usd.edu/pubs/uta/SD-saint_helena.pdf.]
George, M.W., Hotchkiss, R.H., and Huffaker, R., 2017, Reservoir sustainability and sediment management: Journal of Water Resources Planning and Management, v. 143, no. 3, p. 04016077. [Also available at https://doi.org/10.1061/(ASCE)WR.1943-5452.0000720.]
Gibson, S., and Shelley, J., 2020, Flood disturbance, recovery, and inter-flood incision on a large sand-bed river: Geomorphology, v. 351, p. 106973. [Also available at https://doi.org/10.1016/j.geomorph.2019.106973.]
Graeb, B.D., Willis, D.W., and Spindler, B.D., 2009, Shifts in sauger spawning locations after 40 years of reservoir ageing—Influence of a novel delta ecosystem in the Missouri River, USA: River Research and Applications, v. 25, no. 2, p. 153–159. [Also available at https://doi.org/10.1002/rra.1107.]
Grams, P.E., and Schmidt, J.C., 2002, Streamflow regulation and multi-level flood plain formation—Channel narrowing on the aggrading Green River in the eastern Uinta Mountains, Colorado and Utah: Geomorphology, v. 44, no. 3-4, p. 337–360. [Also available at https://doi.org/10.1016/S0169-555X(01)00182-9.]
Grant, G.E., 2012, The geomorphic response of gravel-bed rivers to dams—Perspectives and prospects, in Church, M., Biron, P.M., and Roy, A.G., eds., Gravel-bed rivers—Processes, tools, environments: Chichester, United Kingdom, John Wiley & Sons, Ltd, p. 165–181. [Also available at https://doi.org/10.1002/9781119952497.ch15.]
Grant, G.E., Schmidt, J.C., and Lewis, S.L., 2003, A geological framework for interpreting downstream effects of dams on rivers: Water Science and Application, v. 7, p. 203–225. [Also available at https://doi.org/10.1029/007WS13.]
Greene, S.L., and Knox, J.C., 2014, Coupling legacy geomorphic surface facies to riparian vegetation—Assessing red cedar invasion along the Missouri River downstream of Gavins Point dam, South Dakota: Geomorphology, v. 204, p. 277–286. [Also available at https://doi.org/10.1016/j.geomorph.2013.08.012.]
Grigg, N.S., 2020, Missouri River governance—Collective action and basin-wide problems: Journal of Water Resources Planning and Management, v. 146, no. 5, p. 02520002. [Also available at https://doi.org/10.1061/(ASCE)WR.1943-5452.0001196.]
Heidemann, H.K., 2012, Lidar base specification (version 1.0, August 2012): U.S. Geological Survey Techniques and Methods, chap. 11, book B4, 63 p. [Also available at https://doi.org/10.3133/tm11B4.]
Himmelstoss, E.A., Farris, A.S., Henderson, R.E., Kratzmann, M.G., Ergul, A., Zhang, O., Zichichi, J.L., and Thieler, E.R., 2018a, Digital Shoreline Analysis System (version 5.0) U.S. Geological Survey software release [Also available at https://code.usgs.gov/cch/dsas.]
Himmelstoss, E.A., Henderson, R.E., Kratzmann, M.G., and Farris, A.S., 2018b, Digital Shoreline Analysis System (DSAS) version 5.0 user guide: U.S. Geological Survey 2018–1179, 110 p. [Also available at https://doi.org/10.3133/ofr20181179.]
Hoke, E., 2011, The freshwater Mussels (Mollusca: Bivalvia: Unionoida) of Nebraska: Transactions of the Nebraska Academy of Sciences, v. 32, p. 1–46. [Also available at https://digitalcommons.unl.edu/tnas/2/.]
Holbrook, J.M., and Allen, S.D., 2021, The case of the braided river that meandered—Bar assemblages as a mechanism for meandering along a pervasively braided Missouri River, USA: GSA Bulletin, v. 133, no. 7/8, p. 1505–1530. [Also available at https://doi.org/10.1130/B35762.1.]
Hunt, K.L., Fraser, J.D., Friedrich, M.J., Karpanty, S.M., and Catlin, D.H., 2018, Demographic response of Piping Plovers suggests that engineered habitat restoration is no match for natural riverine processes: The Condor, v. 120, no. 1, p. 149–165. [Also available at https://doi.org/10.1650/CONDOR-17-93.1.]
Hunt, K.L., Fraser, J.D., Karpanty, S.M., and Catlin, D.H., 2017, Body condition of piping plovers (Charadrius melodus ) and prey abundance on flood-created habitat on the Missouri River, USA: The Wilson Journal of Ornithology, v. 129, no. 4, p. 754–764. [Also available at https://doi.org/10.1676/16-180.1.]
Jacobson, R.B., Annis, M.L., Colvin, M.E., James, D.A., Welker, T.L., and Parsley, M.J., 2016, Missouri River Scaphirhynchus albus (pallid sturgeon) effects analysis—Integrative report 2016: U.S. Geological Survey 2016–5064, 174 p. [Also available at https://doi.org/10.3133/sir20165064.]
Jacobson, R.B., Blevins, D.W., and Bitner, C.J., 2009, Sediment regime constraints on river restoration—An example from the Lower Missouri River, in James, L.A., Rathburn, S.L., and Whittecar, G.R., eds., Management and restoration of fluvial systems with broad historical changes and human impacts: Denver, Colo., Geological Society of America, Special Paper 451, p. 1–22. [Also available at https://doi.org/10.1130/2009.2451(01).]
Jacobson, R.B., Chojnacki, K.A., and Reuter, J.M., 2007, Land Capability Potential Index (LCPI) for the Lower Missouri River Valley: U.S. Geological Survey Scientific Investigations Report 2007–5256, 19 p. [Also available at https://doi.org/10.3133/sir20075256.]
Jacobson, R.B., Colvin, M.E., Bulliner, E.A., Pickard, D., and Elliott, C.M., 2018, Bend-scale geomorphic classification and assessment of the Lower Missouri River from Sioux City, Iowa, to the Mississippi River for application to pallid sturgeon management: U.S. Geological Survey Scientific Investigations Report 2018–5069, 46 p. [Also available at https://doi.org/10.3133/sir20185069.]
Jacobson, R.B., Janke, T.P., and Skold, J.J., 2011, Hydrologic and geomorphic considerations in restoration of river-floodplain connectivity in a highly altered river system, Lower Missouri River, U.S.A: Wetlands Ecology and Management, v. 19, no. 4, p. 295–316. [Also available at https://doi.org/10.1007/s11273-011-9217-3.]
Jacobson, R.B., Lindner, G., and Bitner, C.J., 2015, The role of floodplain restoration in mitigating flood risk, Lower Missouri River, USA, in Hudson, P.F., and Middlekoop, H. eds., Geomorphic approaches to integrated floodplain management of lowland fluvial systems in North America and Europe: New York, Springer, p. 203–243, [Also available at https://doi.org/10.1007/978-1-4939-2380-9_9].
Joeckel, R.M., Dillon, J.S., Tusa, N.E., Howard, L.M., and Kuzila, M.S., 2011, Surficial geology of the Marty 7.5 minute quadrangle, Nebraska, portion (STATEMAP): University of Nebraska-Lincoln, scale 1:24,0000. [Also available at http://snr.unl.edu/data/geologysoils/STATEMAP/index.aspx.]
Joeckel, R.M., Johnson, D., Howard, L.M., and Kuzila, M.S., 2013, Surficial geology of the gross 7.5 minute quadrangle, Nebraska, portion (STATEMAP): University of Nebraska-Lincoln, scale 1:24,0000. [Also available at http://snr.unl.edu/data/geologysoils/STATEMAP/index.aspx.]
Jordan, G.R., Heist, E.J., Braaten, P.J., DeLonay, A.J., Hartfield, P., Herzog, D.P., Kappenman, K.M., and Webb, M.A.H., 2016, Status of knowledge of the pallid sturgeon (Scaphirhynchus albus Forbes and Richardson, 1905): Journal of Applied Ichthyology, v. 32, p. 191–207. [Also available at https://doi.org/10.1111/jai.13239.]
Kaemingk, M.A., Graeb, B.D., Hoagstrom, C.W., and Willis, D.W., 2007, Patterns of fish diversity in a mainstem Missouri River reservoir and associated delta in South Dakota and Nebraska, USA: River Research and Applications, v. 23, no. 7, p. 786–791. [Also available at https://doi.org/10.1002/rra.1002.]
Kalman, R.E., 1960, A New Approach to Linear Filtering and Prediction Problems: Journal of Basic Engineering, v. 82, no. 1, p. 35–45. [Also available at https://doi.org/10.1115/1.3662552.]
Kondolf, G.M., 1997, Hungry water—Effects of dams and gravel mining on river channels: Environmental Management, v. 21, no. 4, p. 533–551. [Also available at https://doi.org/10.1007/s002679900048.]
Koohafkan, M., Gibson, S., Pridal, D., and Boyd, P., 2019, Modeling bank migration on the Missouri River with HEC-RAS—A Calibrated HEC-RAS/BSTEM Model: Reno, Nevada, Federal Interagency Sedimentation and Hydrologic Modeling (SEDHYD) Conference, 8 p. [Also available at https://www.sedhyd.org/past/.]
Krahulik, J.R., Densmore, B.K., Anderson, K.J., and Kavan, C.L., 2015, Hydrographic surveys at seven chutes and three backwaters on the Missouri River in Nebraska, Iowa, and Missouri, 2011-13: U. S. Geological Survey Data Series 909, p. 28. [Also available at https://doi.org/10.3133/ds909.]
Langellier, R., 2020, River of no change—All it takes to save the Missouri River is for everyone to agree on everything: Earth Island Journal, Earth Island Institute, Winter 2020. [Also available at https://www.earthisland.org/journal/index.php/magazine/entry/river-of-no-change-missouri/.]
Larsen, E.W., Girvetz, E.H., and Fremier, A.K., 2007, Landscape level planning in alluvial riparian floodplain ecosystems—Using geomorphic modeling to avoid conflicts between human infrastructure and habitat conservation: Landscape and Urban Planning, v. 79, no. 3–4, p. 338–346. [Also available at https://doi.org/10.1016/j.landurbplan.2006.04.003.]
Laustrup, M.S., Jacobson, R.B., and Simpkins, D.G., 2007, Distribution of potential spawning habitat for sturgeon in the Lower Missouri River, 2003-06: U.S. Geological Survey Open-File Report 2007–1192, 26 p. [Also available at https://doi.org/10.3133/ofr20071192.]
Long, J.W., and Plant, N.G., 2012, Extended Kalman Filter framework for forecasting shoreline evolution: Geophysical Research Letters, v. 39, no. 13, 6 p. [Also available at https://doi.org/10.1029/2012GL052180.]
Lott, C.A., Wiley, R.L., Fischer, R.A., Hartfield, P.D., and Scott, J.M., 2013, Interior least tern (Sternula antillarum) breeding distribution and ecology—Implications for population-level studies and the evaluation of alternative management strategies on large, regulated rivers: Ecology and Evolution, v. 3, no. 10, p. 3613–3627. [Also available at https://doi.org/10.1002/ece3.726.]
Ludwickson, J., Blakesee, D., and O’Shea, J., 1981, Missouri National Recreational River: Native American Cultural Resources: Heritage Conservation and Recreation Service Interagency Archeological Services, Denver, 292 p. [Also available at https://digitalcommons.unl.edu/usarmyceomaha/86/.]
Lundstrom, S.C., Cowman, T., Hanson, P., Holbrook, J., Mahan, S., Moreno-Ward, A., and Paces, J., 2022, Geologic Map geodatabase of the valley corridor of the 59-mile reach of the Missouri National Recreational River, South Dakota, Nebraska, and Iowa: Gavins Point Dam to North Sioux City: U.S. Geological Survey data release, accessed May 2022 at https://doi.org/10.5066/P9JOQJJ0.
Mac, M.J., and Palmer, S., 2020, Stakeholder involvement in natural resource decisions—The Missouri River: Fisheries (Bethesda, Md.), v. 45, no. 2, p. 74–83. [Also available at https://doi.org/10.1002/fsh.10364.]
Missouri River Commission, 1895, Map of the Missouri River from its mouth to Three-Forks Montana, Missouri River Commission, 1892-1895, 93 maps. [Also available at https://www.cerc.usgs.gov/data/1894maps/.]
Moreno, A., Erickson, E., Carlin, D., and Holbrook, J.M., 2011a, Surficial material geologic map of the Menominee 7.5’ Quadrangle, South Dakota, USA: University of South Dakota Press, Open-File Map OFM-2011-23, scale 1:24,000. [Also available at http://mri.usd.edu/pubs/uta/SD-menominee.pdf.]
Moreno, A., Erickson, E., Kashouh, M., Carlin, D., and Holbrook, J.M., 2011b, Surficial material geologic map of the Mission Hill 7.5’ Quadrangle, South Dakota, USA: University of South Dakota Press, Open File Map OFM-2011-22, scale 1:24,000. [Also available at http://mri.usd.edu/pubs/uta/SD-Mission_Hill.pdf.]
Moreno, A., Ward, D., Garrett, J., Alexandrowicz, N., Kashouh, M., Carlin, D., and Holbrook, J.M., 2011c, Surficial material geologic map of the Gayville NE 7.5’ Quadrangle, South Dakota, USA: University of South Dakota Press, Open-File Map OFM-2011-26, scale 1:24,000. [Also available at http://mri.usd.edu/pubs/uta/SD-Gayville.pdf.]
Moreno, A., Ward, D., Garrett, J., Alexandrowicz, N., Kashouh, M., Carlin, D., and Holbrook, J.M., 2011d, Surficial material geologic map of the Meckling SE 7.5’ Quadrangle, South Dakota, USA: University of South Dakota Press, Open-File Map OFM-2011-27, scale 1:24,000. [Also available at http://mri.usd.edu/pubs/uta/SD-Meckling.pdf.]
National Aerial Imagery Program, 2022, U.S. Department of Agriculture National Aerial Imagery Program GeoHub: accessed on August 8, 2022, at https://naip-usdaonline.hub.arcgis.com/.
National Park Service, 2017, Foundation document Missouri National Recreational River—Nebraska and South Dakota: National Park Service, U.S. Department of the Interior, 53 p. [Also available at https://www.nps.gov/mnrr/getinvolved/upload/MNRR_FD_PRINT-web.pdf.]
National Resource Conservation Service [NRCS], 2012, Nebraka NRCS lidar: U.S. Department of Agriculture, National Resource Conservation Service, Geospatial Data Gateway, accessed July 19, 2022, at https://datagateway.nrcs.usda.gov/GDGHome_DirectDownLoad.aspx.
National Resource Conservation Service [NRCS], 2016, South Dakota Missouri River lidar: U.S. Department of Agriculture, National Resource Conservation Service, Geospatial Data Gateway, accessed on July 19, 2022, at https://datagateway.nrcs.usda.gov/GDGHome_DirectDownLoad.aspx.
Nefas, S.M., Hunt, K.L., Fraser, J.D., Karpanty, S.M., and Catlin, D.H., 2018, Least tern (Sternula antillarum) nest success and chick survival on the Missouri River following historic flooding: The Wilson Journal of Ornithology, v. 130, no. 2, p. 371–376. [Also available at https://doi.org/10.1676/16-210.1.
Piégay, H., Darby, S., Mosselman, E., and Surian, N., 2005, A review of techniques available for delimiting the erodible river corridor—A sustainable approach to managing bank erosion: River Research and Applications, v. 21, no. 7, p. 773–789. [Also available at https://doi.org/10.1002/rra.881.]
Pokrefke, T.J., Abraham, D.A., Thomas, W.A., Darby, S.E., and Thorne, C.R., 1998, Cumulative erosion impacts analysis for the Missouri River Master Water Control Manual review and update study: U.S. Army Corps of Engineers Waterways Experiment Station Technical Report CHL-98-7, 290 p. [Also available at https://apps.dtic.mil/sti/citations/ADA344127.]
Rapp, C.F., and Abbe, T.B., 2003, A framework for delineating channel migration zones: Washington State Department of Ecology, Washington State Department of Transportation, 136 p. [Also available at https://apps.ecology.wa.gov/publications/documents/0306027.pdf.]
Rapp, R.E., Datta, A., Irmak, S., Arkebauer, T.J., and Knezevic, S.Z., 2012, Integrated management of common reed (Phragmites australis) along the Platte River in Nebraska: Weed Technology, v. 26, no. 2, p. 326–333. [Also available at https://doi.org/10.1614/WT-D-11-00119.1.]
Reed, T., Miller, K., Kashouh, M., Carlin, D., and Holbrook, J.M., 2011, Surficial material geologic map of the Ponca 7.5’ Quadrangle, South Dakota, USA: University of South Dakota Press, Open-File Map OFM-2011-32, scale 1:24,000 [Also available at http://www.sdgs.usd.edu/publications/downloads.aspx.]
Rijke, J., van Herk, S., Zevenbergen, C., and Ashley, R., 2012, Room for the River—Delivering integrated river basin management in the Netherlands: International Journal of River Basin Management, v. 10, no. 4, p. 369–382. [Also available at https://doi.org/10.1080/15715124.2012.739173.]
Schainost, S.C., 2016, A guide to the freshwater mussels of Nebraska: Lincoln, Nebr., Nebraska Game and Parks Commission, 111 p. [Also available at https://digitalcommons.unl.edu/nebgamewhitepap/67/.]
Schenk, E.R., Skalak, K.J., Benthem, A.J., Dietsch, B.J., Woodward, B.K., Wiche, G.J., Galloway, J.M., Nustad, R.A., and Hupp, C.R., 2014, Geomorphic change on the Missouri River during the flood of 2011: U.S. Geological Survey Professional Paper 1798-I, 36 p. [Also available at http://doi.org/10.3133/pp1798I.]
Schmidt, J.C., and Wilcock, P.R., 2008, Metrics for assessing the downstream effects of dams: Water Resources Research, v. 44, no. 4, 19 p. [Also available at https://doi.org/10.1029/2006WR005092.]
Shaw, J.B., and Mohrig, D., 2014, The importance of erosion in distributary channel network growth, Wax Lake Delta, Louisiana, USA: Geology, v. 42, no. 1, p. 31–34. [Also available at https://doi.org/10.1130/G34751.1.]
Shelley, J., and Bailey, C.P., 2018, The cross section viewer—A tool for automating geomorphic analysis using cross section data: Vicksburg, Miss., U.S. Army Corps of Engineers, ERDC/TN RSM-18-3, 9 p. [Also available at https://doi.org/10.21079/11681/26284.]
Sherfy, M.H., Stucker, J.H., and Buhl, D.A., 2012, Selection of nest‐site habitat by interior least terns in relation to sandbar construction: The Journal of Wildlife Management, v. 76, no. 2, p. 363–371. [Also available at https://doi.org/10.1002/jwmg.301.]
Skalak, K.J., Benthem, A.J., Hupp, C.R., Schenk, E.R., Galloway, J.M., and Nustad, R.A., 2017, Flood effects provide evidence of an alternate stable state from dam management on the upper Missouri River: River Research and Applications, v. 33, no. 6, p. 889–902. [Also available at https://doi.org/10.1002/rra.3084.]
Skalak, K.J., Benthem, A.J., Schenk, E.R., Hupp, C.R., Galloway, J.M., Nustad, R.A., and Wiche, G.J., 2013, Large dams and alluvial rivers in the Anthropocene—The impacts of the Garrison and Oahe Dams on the Upper Missouri River: Anthropocene, v. 2, p. 51–64. [Also available at https://doi.org/10.1016/j.ancene.2013.10.002.]
South Dakota Department of Agriculture and Natural Resources, 2012, Eastern South Dakota lidar: accessed on July 19, 2022, at http://www.sdgs.usd.edu/digitaldata/lidar.aspx.
South Dakota Department of Agriculture and Natural Resources, 2015, Bon Homme County, South Dakota lidar, South Dakota: accessed on July 19, 2022, at http://www.sdgs.usd.edu/digitaldata/lidar.aspx.
Sweeney, M.R., Fischer, B., Wermers, K., and Cowman, T., 2019, Eolian and fluvial modification of Missouri River sandbars deposited by the 2011 flood, USA: Geomorphology, v. 327, p. 111–125. [Also available at https://doi.org/10.1016/j.geomorph.2018.10.018.]
U.S. Army Corps of Engineers, 2006, Missouri River mainstem reservoir system—Master water control manual, Missouri River Basin: U.S. Army Corps of Engineers. Northwest Division, 431 p. [Also available at https://www.nwd-mr.usace.army.mil/rcc/rcc_publications_reports.html.]
U.S. Army Corps of Engineers, 2011, Final programmatic environmental impact statement for the mechanical and artificial creation and maintenance of emergent sandbar habitat (ESH) on the riverine segments of the Upper Missouri River: Omaha District, 498 p. [Also available at https://hdl.handle.net/11681/38539.]
U.S. Army Corps of Engineers, 2018, Missouri River Recovery Program management plan environmental impact statement summary of hydrologic engineering analysis: U.S. Army Corps of Engineers, Northwestern Division, Omaha and Kansas City Districts, 26 p. [Also available at https://usace.contentdm.oclc.org/utils/getfile/collection/p16021coll7/id/7876.]
U.S. Army Corps of Engineers, 2017, Missouri River stage trends: U.S. Army Corps of Engineers, Northwestern Division, Reservoir Control Center Technical Report, 45 p. [Also available at https://www.nwd-mr.usace.army.mil/rcc/rcc_publications_reports.html.]
U.S. Army Corps of Engineers, 2022, Link tonnages, port facilities, principle ports, river miles, waterway network, waterway network nodes, COE dredge locations, dredge locations: U.S. Army Corps of Engineers geospatial dataset, accessed June 30, 2022, at https://usace.contentdm.oclc.org/digital/collection/p16021coll2/id/1472.
U.S. Fish and Wildlife Service, 2014, Revised recovery plan for the pallid sturgeon (Scaphirhynchus albus): Denver, Colo., U.S. Fish and Wildlife Service, 115 p. [Also available at http://www.pallidsturgeon.org/wp-content/uploads/2012/11/Pallid-Sturgeon-Recovery-Plan-First-Revision-signed-version-012914_3.pdf.]
U.S. Fish and Wildlife Service, 2021, Endangered and threatened wildlife and plants; Removal of the interior least tern from the Federal list of endangered and threatened wildlife: Federal Register, v. 86, no. 8, p.2564–2581, accessed July 8, 2022, at https://www.govinfo.gov/content/pkg/FR-2021-01-13/pdf/2020-28192.pdf.
U.S. Geological Survey, 2022, Earth Explorer: accessed August 8, 2022, at https://earthexplorer.usgs.gov/.
Volke, M.A., Johnson, W.C., Dixon, M.D., and Scott, M.L., 2019, Emerging reservoir delta‐backwaters—Biophysical dynamics and riparian biodiversity: Ecological Monographs, v. 89, no. 3, p. e01363. [Also available at https://doi.org/10.1002/ecm.1363.]
Volke, M.A., Scott, M.L., Johnson, W.C., and Dixon, M.D., 2015, The ecological significance of emerging deltas in regulated rivers: BioScience, v. 65, no. 6, p. 598–611. [Also available at https://doi.org/10.1093/biosci/biv040.]
Wesner, J.S., Swanson, D.L., Dixon, M.D., Soluk, D.A., Quist, D.J., Yager, L.A., Warmbold, J.W., Oddy, E., and Seidel, T.C., 2020, Loss of potential aquatic-terrestrial subsidies along the Missouri River floodplain: Ecosystems (New York, N.Y.), v. 23, no. 1, p. 111–123. [Also available at https://doi.org/10.1007/s10021-019-00391-9.]
Williams, G.P., and Wolman, M.G., 1984, Downstream effects of dams on alluvial rivers: U.S. Geological Survey Professional Paper 1286, 83 p. [Also available at https://doi.org/10.3133/pp1286.]
Yager, L., Dixon, M., Cowman, T., and Soluk, D., 2011, Historic changes (1941–2008) in side channel and backwater habitats on an unchannelized reach of the Missouri river: River Research and Applications, v. 29, no. 4, p. 493–501. [Also available at https://doi.org/10.1002/rra.1614.]
Appendix 1. Datasets
Table 1.1.
Datasets generated for the 39-mile and 59-mile segments of the Missouri National Recreational River and data release associated with this report (Elliott, 2022).[--, not part of data release; GIS, geographic information system; ft3/s, cubic feet per second; USACE, U.S. Army Corps of Engineers; lidar, light detection and ranging]
| Title | Missouri National Recreational River Segment | Data release file name | Format | Source |
|---|---|---|---|---|
| Cross section results | ||||
| Cross section locations and summary results, 39-mile segment of the Missouri National Recreational River | 39-mile | 39_mile_cross_section_summary.shp | Vector | Elliott, 2022 |
| Cross section locations and results, 59-mile segment of the Missouri National Recreational River | 59-mile | 59_mile_cross_section_summary.shp | Vector | Elliott, 2022 |
| Raw cross-section sedimentation range data from U.S. Army Corps of Engineers | -- | -- | -- | Elliott, 2022 |
| GIS layers and polygons | ||||
| Missouri River revetment and dikes, Missouri National Recreational River | Both | MNRR_revetment_dikes_1999.shp | Vector | Elliott and Jacobson, 2006 |
| Valley wall, Missouri National Recreational River | Both | MNRR_valley_polygon.shp | Vector | Elliott and Jacobson, 2006 |
| Bank erosion | ||||
| Banklines for the 39-mile segment of the Missouri National Recreational River, 1993–2016 | 39-mile | 39_mile_1993_2016.shp | Vector | Elliott and Jacobson, 2006; Elliott, 2022 |
| Banklines digitized from imagery for the 59-mile segment of the Missouri National Recreational River, 1993–2018 | 59-mile | 59_mile_1993_2018.shp | Vector | Elliott and Jacobson, 2006; Elliott, 2022 |
| Bankline Erosion rates for the 39-mile segment of the Missouri National Recreational River, 1993–2016 | 39-mile | bank_erosion_rates_39_mile_segment.shp | Vector | Elliott, 2022 |
| Bankline Erosion rates for the 59-mile segment of the Missouri National Recreational River, 1993–2018 | 59-mile | bank_erosion_rates_59_mile_segment.shp | Vector | Elliott, 2022 |
| Bank erosion "hotspots" from 1993–2018 from aerial imagery in the 59-mile segment of the Missouri National Recreational River | 59-mile | 59_mile_erosion_hotspots_1993_2018.shp | Vector | Elliott, 2022 |
| River polygons and migration zone boundaries | ||||
| Bankline polygon for the Missouri National Recreational River from 1894 Missouri River commission maps | Both | 1894.shp | Vector | Elliott and Jacobson, 2006 |
| Bankline polygons for the 39-mile segment of Missouri National Recreational River from historical maps and aerial imagery 1949–2016 | 39-mile | 39_mile_1949_2016_polygons.shp | Vector | Elliott, 2022 |
| Bankline polygons for the 59-mile segment of Missouri National Recreational River from historical aerial photography and imagery 1941–2018 | 59-mile | 59_mile_1941_2018_polygons.shp | Vector | Elliott, 2022 |
| Historic channel polygon 1949–2016 for the 39-mile segment of the Missouri National Recreational River | 39-mile | 39_mile_1949_to_2016.shp | Vector | Elliott, 2022 |
| Bankline projections for 10 and 20 years from 2020 for the 39-mile segment of the Missouri National Recreational River | 39-mile | 39_mile_predictions_10_20_year.shp | Vector | Elliott, 2022 |
| Bankline projections for 10 and 20 years from 2020 for the 59-mile segment of the Missouri National Recreational River | 59-mile | 59_mile_predictions_10_20_year.shp | Vector | Elliott, 2022 |
| Flood-plain modeling | ||||
| Flood-plain inundation model of the 39-mile segment of the Missouri National Recreational River at a Missouri River discharge of 12,000 ft3/s | 39-mile | 39_fp_12k.tif | Raster | Elliott, 2022 |
| Flood-plain inundation model of the 39-mile segment of the Missouri National Recreational River at a Missouri River discharge of 24,000 ft3/s | 39-mile | 39_fp_24k.tif | Raster | Elliott, 2022 |
| Flood-plain inundation model of the 39-mile segment of the Missouri National Recreational River at a Missouri River discharge of 30,000 ft3/s | 39-mile | 39_fp_30k.tif | Raster | Elliott, 2022 |
| Flood-plain inundation model of the 39-mile segment of the Missouri National Recreational River at a Missouri River discharge of 37,500 ft3/s | 39-mile | 39_fp_37750.tif | Raster | Elliott, 2022 |
| Flood-plain inundation model of the 39-mile segment of the Missouri National Recreational River at a Missouri River discharge of 48,200 ft3/s | 39-mile | 39_fp_48200.tif | Raster | Elliott, 2022 |
| Flood-plain inundation model of the 39-mile segment of the Missouri National Recreational River at a Missouri River discharge of 53,000 ft3/s | 39-mile | 39_fp_53000.tif | Raster | Elliott, 2022 |
| Flood-plain inundation model of the 39-mile segment of the Missouri National Recreational River at a Missouri River discharge of 60,600 ft3/s | 39-mile | 39_fp_60600.tif | Raster | Elliott, 2022 |
| Flood-plain inundation model of the 39-mile segment of the Missouri National Recreational River at a Missouri River discharge of 67,500 ft3/s | 39-mile | 39_fp_67500.tif | Raster | Elliott, 2022 |
| Flood-plain inundation model of the 39-mile segment of the Missouri National Recreational River at a Missouri River discharge of 160,000 ft3/s | 39-mile | 39_fp_160k.tif | Raster | Elliott, 2022 |
| Flood-plain inundation model of the 59-mile segment of the Missouri National Recreational River at a Missouri River discharge of 15,000 ft3/s | 59-mile | 59_fp_15k.tif | Raster | Elliott, 2022 |
| Flood-plain inundation model of the 59-mile segment of the Missouri National Recreational River at a Missouri River discharge of 20,000 ft3/s | 59-mile | 59_fp_20k.tif | Raster | Elliott, 2022 |
| Flood-plain inundation model of the 59-mile segment of the Missouri National Recreational River at a Missouri River discharge of 30,000 ft3/s | 59-mile | 59_fp_30k.tif | Raster | Elliott, 2022 |
| Flood-plain inundation model of the 59-mile segment of the Missouri National Recreational River at a Missouri River discharge of 35,000 ft3/s | 59-mile | 59_fp_35k.tif | Raster | Elliott, 2022 |
| Flood-plain inundation model of the 59-mile segment of the Missouri National Recreational River at a Missouri River discharge of 48,500 ft3/s | 59-mile | 59_fp_48k.tif | Raster | Elliott, 2022 |
| Flood-plain inundation model of the 59-mile segment of the Missouri National Recreational River at a Missouri River discharge of 54,000 ft3/s | 59-mile | 59_fp_54k.tif | Raster | Elliott, 2022 |
| Flood-plain inundation model of the 59-mile segment of the Missouri National Recreational River at a Missouri River discharge of 60,000 ft3/s | 59-mile | 59_fp_60k.tif | Raster | Elliott, 2022 |
| Flood-plain inundation model of the 59-mile segment of the Missouri National Recreational River at a Missouri River discharge of 70,000 ft3/s | 59-mile | 59_fp_70k.tif | Raster | Elliott, 2022 |
| Flood-plain inundation model of the 59-mile segment of the Missouri National Recreational River at a Missouri River discharge of 160,000 ft3/s | 59-mile | 59_fp_160k.tif | Raster | Elliott, 2022 |
| USACE 2011 flood extent layer for segments 8–9 of the Missouri River | 39-mile | 39_mile_2011_flood_extent_USACE.shp | Vector | Elliott, 2022 |
| USACE 2011 flood extent layer for segments 10–12 of the Missouri River | 59-mile | 59_mile_2011_flood_extent_USACE.shp | Vector | Elliott, 2022 |
| Elevation data | ||||
| Best available lidar floodplain model of the 39-mile segment of the Missouri National Recreational River | 39-mile | 39mile_floodplain_lidar.tif | Raster | Elliott, 2022 |
| Spatial locations of best available lidar floodplain model datasets for the 39-mile segment of the Missouri National Recreational River | 39-mile | 39mile_lidar_sources.shp | Vector | Elliott, 2022 |
| Best available lidar floodplain model of the 59-mile segment of the Missouri National Recreational River | 59-mile | 59_mile_2m_floodplain.tif | Raster | Elliott, 2022 |
| Spatial locations of best available lidar floodplain model datasets for the 59-mile segment of the Missouri National Recreational River | 59-mile | 59mile_lidar_sources.shp | Vector | Elliott, 2022 |
References Cited
Elliott, C.M., 2022, Channel geometry, banklines and floodplain inundation over a range of discharges in two segments of the Missouri National Recreational River, South Dakota and Nebraska, 1955–2018: U.S. Geological Survey data release, accessed May 2022 at https://doi.org/10.5066/P9RZPNJR.
Elliott, C.M., and Jacobson, R.B., 2006, Geomorphic classification and assessment of channel dynamics in the Missouri National Recreational River, South Dakota and Nebraska: U.S. Geological Survey Scientific Investigations Report 2006–5313, 66 p. [Also available at https://doi.org/10.3133/sir20065313.]
Conversion Factors
International System of Units to U.S. customary units
Supplemental Information
Discharge is given in cubic feet per second (ft3/s) in keeping with customary units used by management agencies and stakeholders on the Missouri River. Distances on the Missouri River are measured in miles upstream from the confluence with the Mississippi River at St. Louis, Missouri. The river miles used in this report are in common use along the Missouri River and were established in 1960 by the U.S. Army Corps of Engineers (U.S. Army Corps of Engineers, 2022). In some cases, in the 59-mile segment Missouri River navigation mile markers deviate from the course of the river because the river is unchannelized and the channel centerline has shifted in some places since 1960.
Abbreviations
DSAS
Digital Shoreline Analysis Software
HEC–RAS
Hydrologic Engineering Center–River Analysis System
lidar
light detection and ranging
MNRR
Missouri National Recreational River
NPS
National Park Service
SDGS
South Dakota Geological Survey
USACE
U.S. Army Corps of Engineers
USDA
U.S. Department of Agriculture
USGS
U.S. Geological Survey
For more information about this publication, contact:
Director, USGS Columbia Environmental Research Center
4200 New Haven Road
Columbia, MO 65201
573–875–5399
For additional information, visit: https://www.usgs.gov/centers/cerc
Publishing support provided by the
Rolla Publishing Service Center
Suggested Citation
Elliott, C.M., and Jacobson, R.B., 2022, Sixty years of channel adjustments to dams in the two segments of the Missouri National Recreational River, South Dakota and Nebraska: U.S. Geological Survey Scientific Investigations Report 2022–5087, 75 p., https://doi.org/10.3133/sir20225087.
ISSN: 2328-0328 (online)
Study Area
| Publication type | Report |
|---|---|
| Publication Subtype | USGS Numbered Series |
| Title | Sixty years of channel adjustments to dams in the two segments of the Missouri National Recreational River, South Dakota and Nebraska |
| Series title | Scientific Investigations Report |
| Series number | 2022-5087 |
| DOI | 10.3133/sir20225087 |
| Year Published | 2022 |
| Language | English |
| Publisher | U.S. Geological Survey |
| Publisher location | Reston, VA |
| Contributing office(s) | Columbia Environmental Research Center |
| Description | Report: ix, 75 p.; Data Release |
| Country | United States |
| State | Nebraska, South Dakota |
| Other Geospatial | Missouri National Recreational River |
| Online Only (Y/N) | Y |
| Google Analytic Metrics | Metrics page |