

Ungulate Migrations of the Western United States, Volume 3
Links
- Document: Report (46.6 MB pdf) , HTML , XML
- Data Release: USGS data release— Ungulate migrations of the western United States—Volume 3
- Download citation as: RIS | Dublin Core
Acknowledgments
Numerous agency biologists, wardens, students, and postdocs contributed thousands of hours of planning, collecting, analyzing, and visualizing the data contributed to the herds mapped and described in this report. Original map design and production were done by staff and students from the InfoGraphics Laboratory at the University of Oregon, Department of Geography including cartographic production manager Alethea Steingisser, research assistant Joanna Merson, and student cartographers Ian Freeman, Peyton Carl, and Abby Whelan. Coordination and administration of this work across Department of the Interior agencies and western states was facilitated by Casey Stemler, Zach Bowen, and Jonathan Mawdsley. In Arizona, numerous individuals contributed to data collection and coordination including, but not limited to: Sue Boe, Norris Dodd, Jim Heffelfinger, Steve Rosenstock, Ray Schweinsburg, Rick Langley, Tim Holt, Carl Lutch, Paul Whitefield, Colin Beach, Keith Knutson, T. Patrick McCarthy, Mathew Karam, Chad Loberger, and Haley Nelson. In California, the following individuals at the California Department of Fish and Wildlife assisted with data collection, herd descriptions, and information: Erin Zulliger, Axel Hunnicutt, Sara Holm, Stacy Anderson, Ken Morefield, Pete Figura, Shelly Blair, Evan King, Helayna Pera, David Casady, and Melanie Gogol-Prokurat. Additionally, in California, the following individuals assisted with data collection and herd descriptions: Heiko Wittmer, Christopher Wilmers, and Bogdan Cristescu. In Idaho, the following individuals with the Idaho Department of Fish and Game assisted with data collection and coordination, herd descriptions, and information: Paul Atwood, Arthur Middleton, Regan Berkley, Frank Edelmann, Mike Elmer, Eric Freeman, Charlie Henderson, Curtis Hendricks, Iver Hull, Jason Husseman, Zach Lockyer, Mike McDonald, Dennis Newman, Matt Pieron, Sierra Robatcek, Jessie Shallow, Tom Schrempp, Bret Stansberry, Ryan Walker, Ryan Walrath, Laura Wolf, Barbara Moore, Michelle Commons-Kemner, Jake Powell, and Rick Ward. In Montana, the following individuals with Montana Fish Wildlife & Parks assisted in captures and project logistics: Jesse DeVoe, Justin Gude, and Dean Waltee, as well as Joshua Millspaugh from the University of Montana, Katie Benzel with the Bureau of Land Management, the Greater Yellowstone Coalition, the National Parks Conservation Association, Steve Primm, and Madison Valley Landowners. In Navajo Nation, the following individuals at the Navajo Department of Fish and Wildlife assisted with data collection: Lionel Tsosie, Jamie Begay, Roy Barton Jr., Janelle Josea, Gabryl Sam, Nicholas Chischilly, John Montjoy, Tytus Sandoval, and Jeffrey Cole. In Nevada, the following individuals at the Nevada Department of Wildlife assisted with data collection and coordination for Nevada’s wildlife connectivity programs: Tony Wasley, Kari Huebner, Cody McKee, Alan Jenne, Matt Maples, Jasmine Kleiber, and Mike Cox. In New Mexico, the following individuals, landowners, and agencies assisted with data collection or project logistics: Aguila Gritando Ranch Ltd., Brazos River Ranch, Brazos River High Timber, Bureau of Land Management-Taos Field Office, Shana Burkhardt, Chama Land Cattle Co., Chama Troutstalkers Ranch LLC, Crowthers Ranch, CRT Chama LLC, Dinero Land & Cattle Co. LLC, Donald Gonzales Trustee and Brian Gonzales Trustee, Eastside Group Ltd. (Rancho Lobo), El Chamisal Ranch, Esquibel Ranches, Estancia Valley Cattle and Farms LLC, Leonard Jensen Family, Jicarilla Apache Nation, Montano Revocable Trust, Moya Brazos, Mundy Ranch Inc., New Mexico State Land Office, Neil Perry, Peterson Ranch 2, Quinlan Ranch LLC, Rancho Del Oso Pardo, Rancho Escondido de Chama LLC, Rare Earth New Mexico, Samuel Dean Gardner Jr. Revocable Trust, Ser Melton, John Sherman, Simms Ranch, Sultemeier Ranches, Jeff Tafoya, Kyle Tator, Tony and Carla Martinez, U.S. Department of Agriculture Forest Service Carson National Forest, Walter Boyett, Wilderness Properties LLC, William and Dianne Horn Living Trust, William and Louise Pape, and the Woolley Family Limited Partnership. In Utah, Utah Division of Wildlife Resources, Brigham Young University, Utah State University, Mule Deer Foundation, Bureau of Land Management, Sportsmen for Fish and Wildlife, Google, and SpringML personnel contributed to data collection, project logistics, herd descriptions, and information collection. In Washington, the following individuals at the Washington Department of Fish and Wildlife contributed to captures, data collection, project logistics, or report review: Mike Atamian, Jeff Bernatowicz, Cindy Cole, Devon Comstock, Dan Dziekan, Sara Hansen, Brock Hoenes, Marcus Leuck, Carrie Lowe, Kristin Mansfield, Ben Maletzke, William Moore, Bryan Murphie, Trent Roussin, Elizabeth Torrey, Matt VanderHaegen, Kile Westerman, Steven Wetzel, and Paul Whelan. Additionally, in Washington, the following organizations or individuals assisted with captures or project logistics: the U.S. Fish and Wildlife Service, Little Pend Oreille Wildlife Refuge, U.S. Department of Agriculture Forest Service, Taylor Ganz and Laura Prugh with the University of Washington School of Environmental and Forest Sciences, Joel Adams and Megan Wright with the Kalispel Tribe of Indians Natural Resources Department, Savanah Walker with the Spokane Tribe of Indians, and the many private landowners who allowed us to capture and collect data on their lands. In Wyoming, the following individuals at the Wyoming Game and Fish Department contributed to data collection, herd descriptions, and information collection: Greg Anderson, Doug Brimeyer, Corey Class, Teal Cufaude, Phil Damm, Rebecca Fuda, Lynn Jahnke, Daryl Lutz, Seth Roseberry, Leslie Schreiber, Sam Stephens, Cheyenne Stewart, Dustin Shorma, Dan Thiele, Tim Thomas, Mary Wood, and Mark Zornes. Siva Sundaresan and Doug Wachob were helpful contributors for the Jackson mule deer herd in Wyoming. Additionally in Wyoming, Mike Mazur from the U.S. Fish and Wildlife Service and Ben Snyder, Justin Friday, Wilma Wagon, and Ervin Brown from the Shoshone and Arapaho Fish and Game Department provided project and logistical support.
Funding for the collaring and collection of ungulate migration data across all states that included herd maps was provided by the following organizations: Arizona Antelope Foundation, Arizona Deer Association, Arizona Desert Bighorn Sheep Society, Arizona Department of Transportation, Arizona Elk Society, Arizona Game and Fish Department (Habitat Partnership Committee Regions I, II, and III; and the Research, Contracts, and Game Branches), Black Diamond Minerals LLC, The Boone and Crockett Club, Brigham Young University, British Petroleum North America, Bureau of Land Management-Cody Field Office, Bureau of Land Management-Worland Field Office, California Department of Fish and Wildlife, Charles Engelhard Foundation, Craters of the Moon National Monument & Preserve, Cross Charitable Foundation, George B. Storer Foundation, Grand Teton Association, Grand Teton National Park Foundation, Greater Yellowstone Coordinating Committee, Greater Yellowstone Interagency Brucellosis Committee, Idaho Department of Fish and Game, Idaho Department of Transportation, Kinross Gold, Knobloch Family Foundation, Lava Lake Institute for Science and Conservation, Linn Energy, Meg and Bert Raynes Wildlife Fund, Memorial Resource Development, Montana Fish, Wildlife & Parks, Mule Deer Foundation, Southeast Chapter of the Muley Fanatic Foundation, The Nature Conservancy, The Nature Conservancy of Idaho, Navajo Guide Association, Navajo Nation Department of Fish and Wildlife, Nevada Department of Wildlife, Nevada Wildlife Heritage Fund, New Mexico Department of Game and Fish, Phoenix Chapter of Safari Club International, Rocky Mountain Elk Foundation, Safari Club International, Samson Resources, Sheridan County Sportsman’s Association, Sportsmen for Fish and Wildlife, Teton Science School, University of Nevada–Reno, University of Wyoming (Department of Ecosystem Science and Management, Office of Academic Affairs, Wyoming Department of Transportation, Wyoming Reclamation and Restoration Center, and the School of Energy Resources), U.S. Department of Agriculture Animal Plant Health Inspection Service, U.S. Fish and Wildlife Service, U.S. Fish and Wildlife Service Wildlife and Sport Fish Restoration Program, U.S. Department of Agriculture Forest Service, Bridger-Teton National Forest, Shoshone National Forest, Southwestern Regional Forest Service Office, T&E, Inc., U.S. Geological Survey, Washington Department of Fish and Wildlife, Washington State Legislature, Wildlife Conservation Society North America Program, Wildlife Heritage Foundation of Wyoming, Wyoming Landscape Conservation Initiative, Wyoming Game and Fish Department, Wyoming Governor's Big Game License Coalition, and Wyoming Wildlife Foundation. The U.S. Geological Survey and Rocky Mountain Elk Foundation provided the primary funding for the analysis and compilation of this report.
Drs. J. Terrill Paterson and Katie Dugger provided thoughtful and constructive comments that greatly improved the report.
Abstract
Ungulates (hooved mammals) have a broad distribution across the western United States and play an important role in maintaining predator-prey dynamics, affecting vegetation communities, and providing economic benefits to regional communities through tourism and hunting. Throughout the diverse landscapes they occupy, many ungulate populations undertake seasonal migrations to exploit spatially and temporally variable resources and to avoid predation or other threats. As the human footprint continues to expand across the western United States, ungulates increasingly face more obstacles on their migratory journeys. These obstacles threaten the long-term persistence of existing migrations. As a result, wildlife management agencies across the western United States have worked to identify and protect (or enhance) ungulate migration corridors and seasonal ranges identified from global positioning system (GPS) collar data. These efforts garnered additional support through the U.S. Department of the Interior Secretarial Order (SO) 3362, which was initiated in 2018 and provided Federal support for enhancing habitat quality of big-game winter ranges and migration corridors across the western states.
Further, SO 3362 prompted the U.S. Geological Survey (USGS) to establish the Corridor Mapping Team (CMT): a collaboration between USGS and participating State and Federal wildlife management agencies, as well as numerous Tribal Nations. The CMT works collaboratively to map ungulate migrations and seasonal ranges throughout the western United States within the Ungulate Migrations of the Western United States report series. Volume 1 of the series was published in 2020 and contained migrations and winter ranges from 42 herds across 5 states. Volume 2 was published in 2022 and contained migrations and seasonal ranges from an additional 65 herds. This report, Volume 3 in the series, details migrations and seasonal ranges from an additional 45 herds throughout most western states. In aggregate, the report series has detailed and mapped the migrations and seasonal ranges of 152 ungulate herds and serves as a map-based inventory of the documented ungulate migrations across the western United States. The data layers for most of the herds included in the report series are also available to the public by the USGS. In addition to the included herd maps, this volume provides an overview of the many ways the mapping efforts associated with the CMT are being integrated into local conservation, management, and policy throughout the western United States.
Introduction
Ungulates (hooved mammals) have a broad distribution across the western United States, influencing vegetation communities (Hobbs, 1996; Frank and Evans, 1997) and predator-prey dynamics, in addition to providing economic benefits to regional communities through tourism and hunting (Duffield and Holliman, 1988). Ungulates also hold cultural significance for many Tribal communities. Many ungulate populations undertake seasonal migrations, traversing diverse landscapes (Kauffman and others, 2021b, 2022a). During the last 20 years, global positioning system (GPS) collars have allowed researchers and managers to document migration corridors as well as the summer and winter seasonal ranges the corridors connect. Migratory behaviors of ungulates are diverse and span a continuum from fully resident to fully migratory populations (Cagnacci and others, 2011). Behaviors can also vary among individuals within a population, thus further diversifying migratory portfolios (Chapman and others, 2011; Lowrey and others, 2020). For example, a single herd may contain resident individuals, as well as short-distance migrants (in other words, less than 3 miles [mi]; 5 kilometers [km]) traversing elevational gradients, and long-distance migrants traveling more than 100 mi (160 km) through topographically complex landscapes (Sawyer and others, 2016). On the landscapes where they occur, migrations are increasingly considered a critical behavior to enhance ungulate foraging opportunities and avoid deep snow (Kauffman and others, 2021a). Migratory behavior allows animals to access forage at peak phenology (Aikens and others, 2017; Merkle and others, 2016), which often carries nutritional benefits and increases individual fitness (Middleton and others, 2018). Globally, migrations allow populations to exploit spatially and temporally variable resources (Nandintsetseg and others, 2019) and to avoid predation or other threats (Fryxell and Sinclair, 1988).
In the western United States, species such as Odocoileus hemionus (mule deer), Cervus canadensis (elk), Antilocapra americana (pronghorn), Alces alces (moose), Ovis canadensis (bighorn sheep), and Bison bison (bison) all migrate in some parts of their range (Kauffman and others, 2020a, 2022a). But, as the human footprint in the western United States continues to expand, the migratory journeys of ungulates are becoming increasingly difficult, threatening the long-term persistence of existing migrations (Sawyer and others, 2013). Traffic levels on roadways are increasing, causing direct mortality and severing migration corridors (Kauffman and others, 2018). Fences, which are common on western landscapes, also alter animal movements and cause direct mortality (Jakes and others, 2018). Many of the landscapes that migrating ungulates traverse are fragmented by roads, well pads, and other infrastructure associated with oil and gas (Sawyer and others, 2013), wind (Milligan and others, 2021), and solar energy development (Sawyer and others, 2022). Perhaps most importantly, the vast landscapes that many migrations require are dominated by private lands, which, if developed, would represent a permanent loss of habitat and landscape connectivity. Although various forms of development can reduce the functionality of corridors (Wyckoff and others, 2018), the amount of development that populations can tolerate before migratory use declines is rarely known (Sawyer and others, 2020). Complicating this further is that species may have different levels of tolerance (Lambert and others, 2022).
Because of these challenges, wildlife management agencies across the western United States have worked to identify and protect ungulate migration corridors and seasonal ranges identified from GPS collar data. On-the-ground conservation projects garnered additional support through the U.S. Department of the Interior (DOI) Secretarial Order (SO) 3362, which was initiated in 2018 and provides Federal support for enhancing habitat quality of big-game winter ranges and migration corridors across the western states (U.S. Department of the Interior, 2018). In SO 3362, the U.S. Geological Survey (USGS) was charged to assist western states in mapping migration corridors, which the USGS has done by organizing a Corridor Mapping Team (CMT). The CMT is a collaboration between the USGS and participating western states, which have leveraged existing State, Tribal, and Federal expertise to design and implement a unified mapping effort.
Since its inception in 2018, the CMT has expanded to include participation from all 11 western State wildlife management agencies as well as from multiple Tribal and Federal agencies, which collaboratively publish annual reports containing new mapped herds within a multivolume series. Volume 1 was published in 2020 and contained migrations and winter ranges from 42 herds across five states (Kauffman and others, 2020a, 2020b). Volume 2 was published in spring 2022 and contained migrations and seasonal ranges from an additional 65 herds (Kauffman and others, 2022a, 2022b). This report, Volume 3 in the series, details migrations and seasonal ranges from an additional 45 herds across most western states. In aggregate, the report series has detailed and mapped the migrations and seasonal ranges of 152 ungulate herds and serves as a map-based inventory of the migrations documented thus far across the western United States. The map files for many of the herds included in the report series are also available publicly (Kauffman and others, 2020b, 2022b, 2022c).
The primary motivation for mapping ungulate corridors and seasonal ranges of the western United States is to facilitate the long-term functionality of migrations through management and conservation. Numerous case studies have shown how detailed mapping of a migration corridor can help pinpoint threats and conservation opportunities (Kauffman and others, 2018). Likewise, it is exceedingly difficult to strategically manage or advance proactive policy measures for unknown (in other words, unmapped) corridors. As the CMT continues to map ungulate migrations, there has been a congruent expansion of the integration of detailed migration maps and spatial layers into regional management, conservation, and policy. Migration maps can serve as a powerful platform for collaboration among partners to conserve and enhance big-game migratory habitats (Middleton and others, 2020), which can include land-use planning and authorization of development projects. The examples of implementation are diverse across the western states. While some states are beginning to map migrations for the first time using GPS collars, others are expanding on a long history of collaring ungulates. These established collaring programs, with full-time staff positions focused on animal movement, are beginning to inform State and Tribal policies or conservation actions with the aim of conserving migration corridors and seasonal ranges.
Herein, we describe a variety of conservation actions that have been guided by migration mapping and implemented by State and Tribal wildlife management agencies, Federal land management agencies, and other conservation groups. While they are by no means a complete inventory of projects across the western United States, the conservation efforts outlined below provide an overview of the science-based management facilitated by detailed migration mapping. Ultimately, strategic implementation of projects like those we describe below will be necessary to maintain the functionality and persistence of the region’s ungulate migration corridors.
Roads as Obstacles to Migration
Roads, especially those with high traffic volumes, have both direct and indirect effects on migrating wildlife. Wildlife-vehicle collisions (WVC) along roads are a direct cause of mortality (Riginos and others, 2022), but busy roadways can also restrict wildlife movement when they become too difficult to cross (Kauffman and others, 2018; Robb and others, 2022). Simply plotting migration routes or corridors, along with the locations of WVC, helps identify important road crossings. Using detailed movement data to guide how best to mitigate these effects has become a common practice across western states (Coe and others, 2015).
Examples of combining GPS collar data with WVC hotspots for effective WVC mitigation come from Colorado. Between 2004 and 2010, the Southern Ute Indian Tribe and Colorado Parks and Wildlife (CPW) partnered to collar mule deer in the southern San Juan Mountains east of Bayfield in southwestern Colorado. The impetus for the effort was to evaluate potential effects from a proposed energy development on critical mule deer winter range on U.S. Department of Agriculture Forest Service (FS) lands within the Southern Ute Indian Reservation. While the energy development ultimately never happened at the expected intensity, the GPS collar data from that effort proved useful. In particular, the Southern Ute Indian Tribe’s early efforts at modeling mule deer migration routes illustrated how WVC data could be matched to where migrating deer crossed U.S. Highway 160 west of Pagosa Springs. This was the first time that migration data were connected to WVC hotspots along U.S. Highway 160. After several years of effort and planning, the Southern Ute Indian Tribe and CPW, with further support from the Colorado Wildlife and Transportation Alliance, partnered with the Colorado Department of Transportation to fund the project. The result was a 2-mi (3-km) project that consisted of a large wildlife underpass and an overpass connected by wildlife exclusion fencing. The underpass was finished in 2021 and the overpass, the first constructed in the southwestern part of Colorado, will be completed in 2022.
Colorado has also been active in broader efforts, including the West Slope Wildlife Prioritization Study and the East Slope and Plains Wildlife Prioritization Study (Kintsch and others, 2019), which emerged out of a collaboration between the Colorado Department of Transportation and CPW. The studies sought to identify wildlife/highway conflict areas where targeted mitigation could have the greatest impact on reducing WVC. To meet this objective, the studies identified, mapped, and prioritized highway segments based on the risk of WVC and the need for ungulates to cross highways, particularly during migration or within the animals’ winter range. As part of the project, Brownian bridge movement models (BBMM) were generated for all CPW ungulate GPS data. Briefly, BBMM estimate an animal’s distribution or where an animal could have traveled across a landscape given the sequence of GPS locations (Horne and others, 2007; see appendix 1 for more details). The prioritization results and mitigation recommendations for high-priority segments in each region have been integrated into a decision-support framework, which includes a cost-benefit analysis to inform the siting, design, and construction of effective wildlife and highway mitigation projects across the state.
The Navajo Nation Department of Fish and Wildlife, jointly with the Navajo Department of Transportation, New Mexico Department of Transportation, and Arizona Department of Transportation, plan to acquire several unique message boards in an attempt to mitigate vehicular collisions with mule deer. The message boards will be installed along two separate stretches of Indian Route 12 along the Arizona and New Mexico borders that intersect critical, high-use migration corridors used by mule deer in the Ram Pasture and Canyon de Chelly herds. These herds migrate from lower elevation winter range to high-elevation summer range on the Navajo Nation Tribal lands (see the “Ram Pasture Mule Deer” and “Canyon de Chelly Mule Deer” sections of this report). The message boards will be deployed for 1–2 months during the spring and fall migration to help alert drivers to seasonal movements of mule deer and reduce the number of potentially fatal vehicular collisions.
The Idaho Transportation Department and Idaho Department of Fish and Game (IDFG) are collaborating to design wildlife crossing structures south of Montpelier at Rocky Point on U.S. Highway 30. Approximately 6,000 mule deer cross U.S. Highway 30 as they migrate between their summer range in the Caribou Range and the winter range on the Bear Lake Plateau. Up to 100 WVC are reported each year on a 20-mi (32-km) section of U.S. Highway 30; approximately 70 percent of these WVC occur on the 4-mi (6-km) stretch at Rocky Point. Acquiring GPS collar data and developing a standard migration map of the Bear Lake Plateau mule deer have been essential in project development. Collaring efforts have also helped strategically identify and acquire IDFG conservation easements on private lands necessary for the project. The Idaho Transportation Department plans to initiate project construction in 2025 (Idaho Transportation Department, 2022).
In California, GPS collar data shared between the California Department of Fish and Wildlife (CDFW) and the California Department of Transportation (CalTrans) have been instrumental for increasing ungulate connectivity and mitigating WVC. For example, using migration corridor analyses from the Downieville-Nevada City mule deer herd (see the “Downieville-Nevada City Mule Deer” section of this report), CalTrans planned, designed, and implemented two wildlife crossings with exclusionary fencing in Nevada County for the U.S. Highway 20 Omega Curve Correction project. Although only a small number of known migratory deer use this area, data revealed both a collared mule deer crossing and a collared mule deer mortality within the footprint of the planned mitigation project. (A third collared mule deer moved adjacent to the highway, but seemingly made no attempt to cross.) Construction of the mitigation project, funded by CalTrans, was completed in 2022. Such GPS collar data will continue to guide future connectivity projects to maintain ungulate migration routes and reduce WVC across California.
In Arizona, millions of motorists traverse Interstate 17 each year (more than 20,000 vehicles per day in some sections; Arizona Department of Transportation, 2021). The northernmost 31-mi (50-km) section, connecting the Verde Valley and Flagstaff, passes through an important elk migration corridor that was mapped in Volume 1 of this report series (Kauffman and others, 2020a). The Arizona Game and Fish Department (AZGFD) has worked closely with the Arizona Department of Transportation and the FS in planning two highway overpasses and exclusionary fencing along this stretch of Interstate 17. A project assessment, a required step in the planning process, has been funded by AZGFD. Cooperating agencies continue to work with partners and stakeholders to obtain funding to complete the project.
Corridor Mapping of the Pequop Mule Deer Herd in Nevada
Wildlife safety crossings have been used in Nevada to reduce WVC and increase the connectivity of wildlife movements in fragmented landscapes since the early 1980s. A more concerted planning effort began in 2008 to minimize or eliminate WVC in areas of known hot spots in Elko County, Nevada. The first dedicated crossing structures (two overpasses and three underpasses) for wildlife were constructed on U.S. Highway 93, just north of Wells, Nevada (HD Summit, 10 Mile Summit, fig. 1), in 2010. The Nevada Department of Wildlife (NDOW) collaborated with the Nevada Department of Transportation (NDOT) to collect initial baseline data, including GPS collar data from eight individuals, highway crash data from a comprehensive assessment of WVC, and carcass counts collected by road maintenance crews (fig. 1A−C). Upon completion of the crossing structures, both agencies collaborated with researchers at the University of Nevada-Reno to document more than 34,500 mule deer using one of the structures in the first four years alone (Simpson and others, 2016), averaging close to 4,300 individuals per migration. Mule deer used the overpasses more frequently and were repelled less frequently when compared to the underpasses (Simpson and others, 2016). Of the 34,500 crossings, approximately 82 percent crossed an overpass and 18 percent crossed through an underpass (Simpson and others, 2016). Since 2010, WVC research has continued, and mule deer GPS collar deployments were increased to better understand fine-scale movements of migration corridors and ungulate use of existing crossing structures (Blum and Stewart, 2014). So far, NDOW has collared approximately 86 mule deer from 2015 to 2019 to further analyze movements and corridor use (Kauffman and others, 2020a).
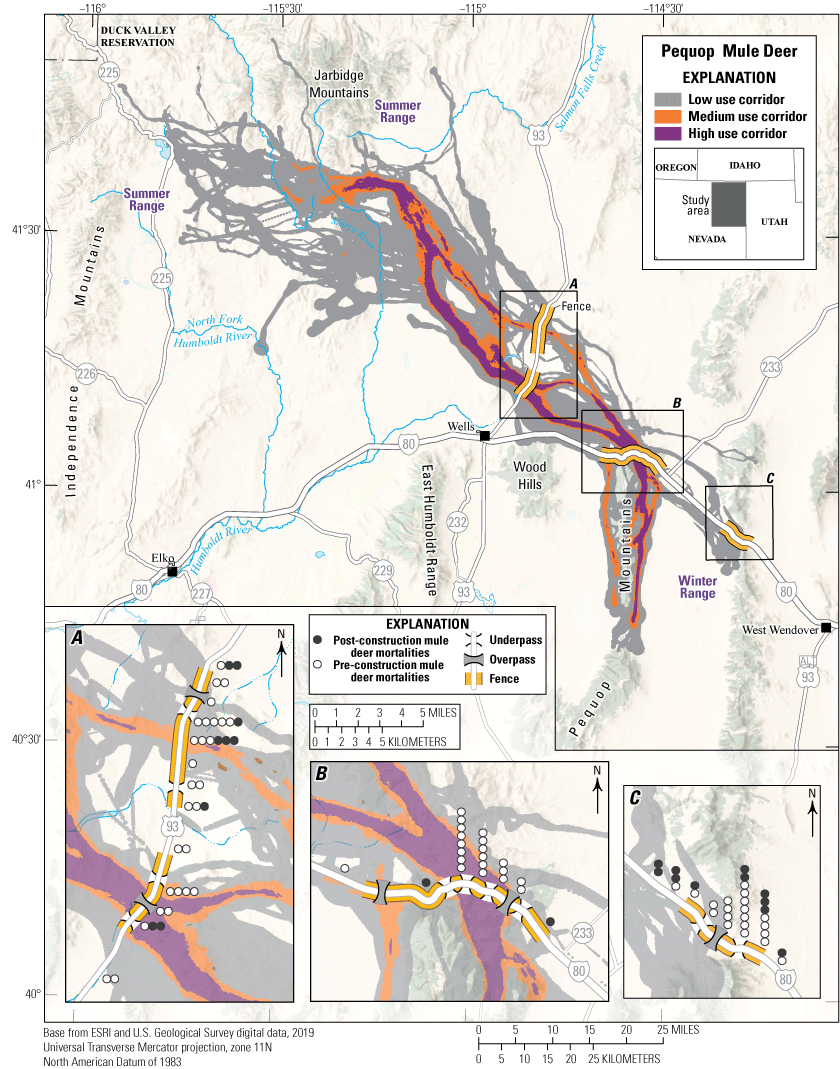
Corridor mapping of the Pequop Mule Deer herd. Nevada Department of Wildlife and Nevada Department of Transportation collaborated to identify and mitigate several hotspots of deer-vehicle collisions (A–C) along Interstate 80 and U.S. Highway 93 with a series of crossing structures.
Upon completion of the HD Summit and 10 Mile Summit projects on U.S. Highway 93, NDOT installed an additional overpass structure in 2013 that spanned Interstate 80 near Silver Zone Pass just west of West Wendover, Nevada. The placement of this structure was largely informed by analyzing WVC and carcass reports involving mule deer by the NDOT. In 2021, NDOW and NDOT began using GPS collar data to assess the use of mule deer on this wildlife-crossing structure, and data continue to be analyzed to inform future management (Nevada Department of Wildlife, 2021).
In 2015, planning efforts began to construct two additional wildlife overpasses and modify four existing underpasses on Interstate 80, approximately 18 mi (29 km) east of Wells, Nevada. Data from GPS collars, analyzed using BBMM (Sawyer and others, 2009), helped inform the high-use migration corridor that intersected the Pequop Summit area. Additionally, NDOT crash data indicated approximately 60–80 mule deer were hit annually, further reinforcing the siting of the structures. The Pequop Summit crossing structures were completed in October 2018.
Upon total completion of these projects on U.S. Highway 93 and Interstate 80, it is estimated that WVC will have been reduced by 90 percent within the migration corridor. In summary, the collaboration and communication between multiple agencies and stakeholders was necessary to initiate data collection and planning of these important crossing structures for wildlife. Funding for the projects was obtained from a variety of sources including Federal highway funds, Nevada State road improvement funds, and Pittman-Robertson Act funds from the U.S. Fish and Wildlife Service. The success of this project will ultimately provide increased safety for motorists and increased connectivity for a variety of wildlife species that use these structures.
Fences as Barriers to Migration
Fences crisscross the western United States. They are constructed for a variety of reasons, including managing livestock, delineating property boundaries, and marking rights of way. Unfortunately for migrating ungulates, fences can be a persistent source of mortality by entanglement (McInturff and others, 2020) and may severely restrict or even sever migratory movements (Jakes and others, 2018; Robb and others, 2022). Some fences are relatively permeable and easy to navigate by migrating ungulates, while others can present formidable barriers. In particular, a 6–8 foot (ft; 1.8–2.4-meter [m]) high woven-wire fence can be a nearly impermeable barrier to ungulate movement. As migration mapping progresses across the western states, managers can identify many of the important landscapes that ungulates move through and the problematic fences that constrain their movements. Fence-mitigation projects abound across the western states, and we highlight a few representative examples here.
Since 2011, CPW has led an effort to remove obsolete fences in the northwest portion of Colorado. The project seeks to mitigate fencing’s effects on multiple mule deer and elk herds primarily within the herds’ winter ranges and migration corridors. One example is the Bears Ear elk herd. Portions of this herd winter in the Great Divide area northwest of Craig, Colorado, and migrate in the summer as far east as Mount Zirkel in the Park Range along the Continental Divide. Approximately 40 mi (64 km) of fence, including three- and four-strand barb-wire fences and woven-wire fences topped with one or two strands of barb wire, have been removed from winter ranges and migration corridors by volunteers, agency staff, and contractors. Problematic fences have been removed on Bureau of Land Management (BLM), State Land Board, CPW State Wildlife Areas, National Park Service (for example, Dinosaur National Monument), and private lands. Partner agencies and CPW have invested more than $150,000 to complete this work, including support from the Rocky Mountain Elk Foundation, RESTORE Colorado, and the BLM. By the end of summer 2022, more than 100 mi (161 km) of fence will be removed from key mule deer and elk habitat.
In southeastern Idaho, the Soda Springs Hills support approximately 4,000 wintering mule deer, many of which migrate from their summer range on the Caribou-Targhee National Forest east of Soda Springs, Idaho. Telemetry data allowed mapping of the Soda Springs Hills mule deer migration routes (Kauffman and others, 2020a), which clarified that most mule deer migrate through a narrow bottleneck between a residential development and the Bayer phosphate industrial plant on the north end of Soda Springs. Subsequent trail camera work showed that approximately 1,500 mule deer migrate through an area less than 246-ft (75-m) wide. From 2020 to 2022, IDFG and Bayer partnered to enhance, protect, and widen this vital migration route. Bayer has realigned a large perimeter fence to widen the migratory pathway and allow for additional space next to the adjacent highway in hopes of reducing WVC. They also removed obstructions and modified vegetation and ground cover to facilitate deer movement. Biologists at the IDFG plan to radio collar additional mule deer in 2022 to better understand this migration and improve their technical assistance to Bayer, Soda Springs, and other partners.
In Wyoming, the world’s longest mule deer migration was mapped in 2014 (Sawyer and others, 2014). The detailed mapping revealed that mule deer migrated approximately 150 mi (120 km), and that nearly two-thirds of the way along their spring migration from the Red Desert winter range, they had to navigate a 0.25-mi (0.40-km) wide bottleneck. The migration corridor narrowed along the foothills of the Wind River Range, where the bottleneck was formed by Fremont Lake to the north and the expanding suburbs of Pinedale, Wyoming, to the south. A 360-acre (146-hectare [ha]) parcel of private land sat at the outlet of the lake, forcing migrating deer to navigate an 8-ft (2-m) high woven-wire fence that was built to exclude elk from private land where they could cause damage to hayfields or transmit disease (for example, brucellosis; Rayl, 2019). At this time, the 360-acre (146-ha) parcel was for sale and slated for development into lakeside cottages. Maps of mule deer movements identified this bottleneck as the top threat to the functionality of the corridor (Sawyer and others, 2014), which prompted The Conservation Fund to raise the necessary funding to purchase the property and turn it over to the Wyoming Game and Fish Department to create the Luke Lynch Wildlife Habitat Management Area. The 8-ft (2-m) woven-wire fence was then removed to preserve this portion of the corridor for migrating deer in perpetuity (fig. 2).
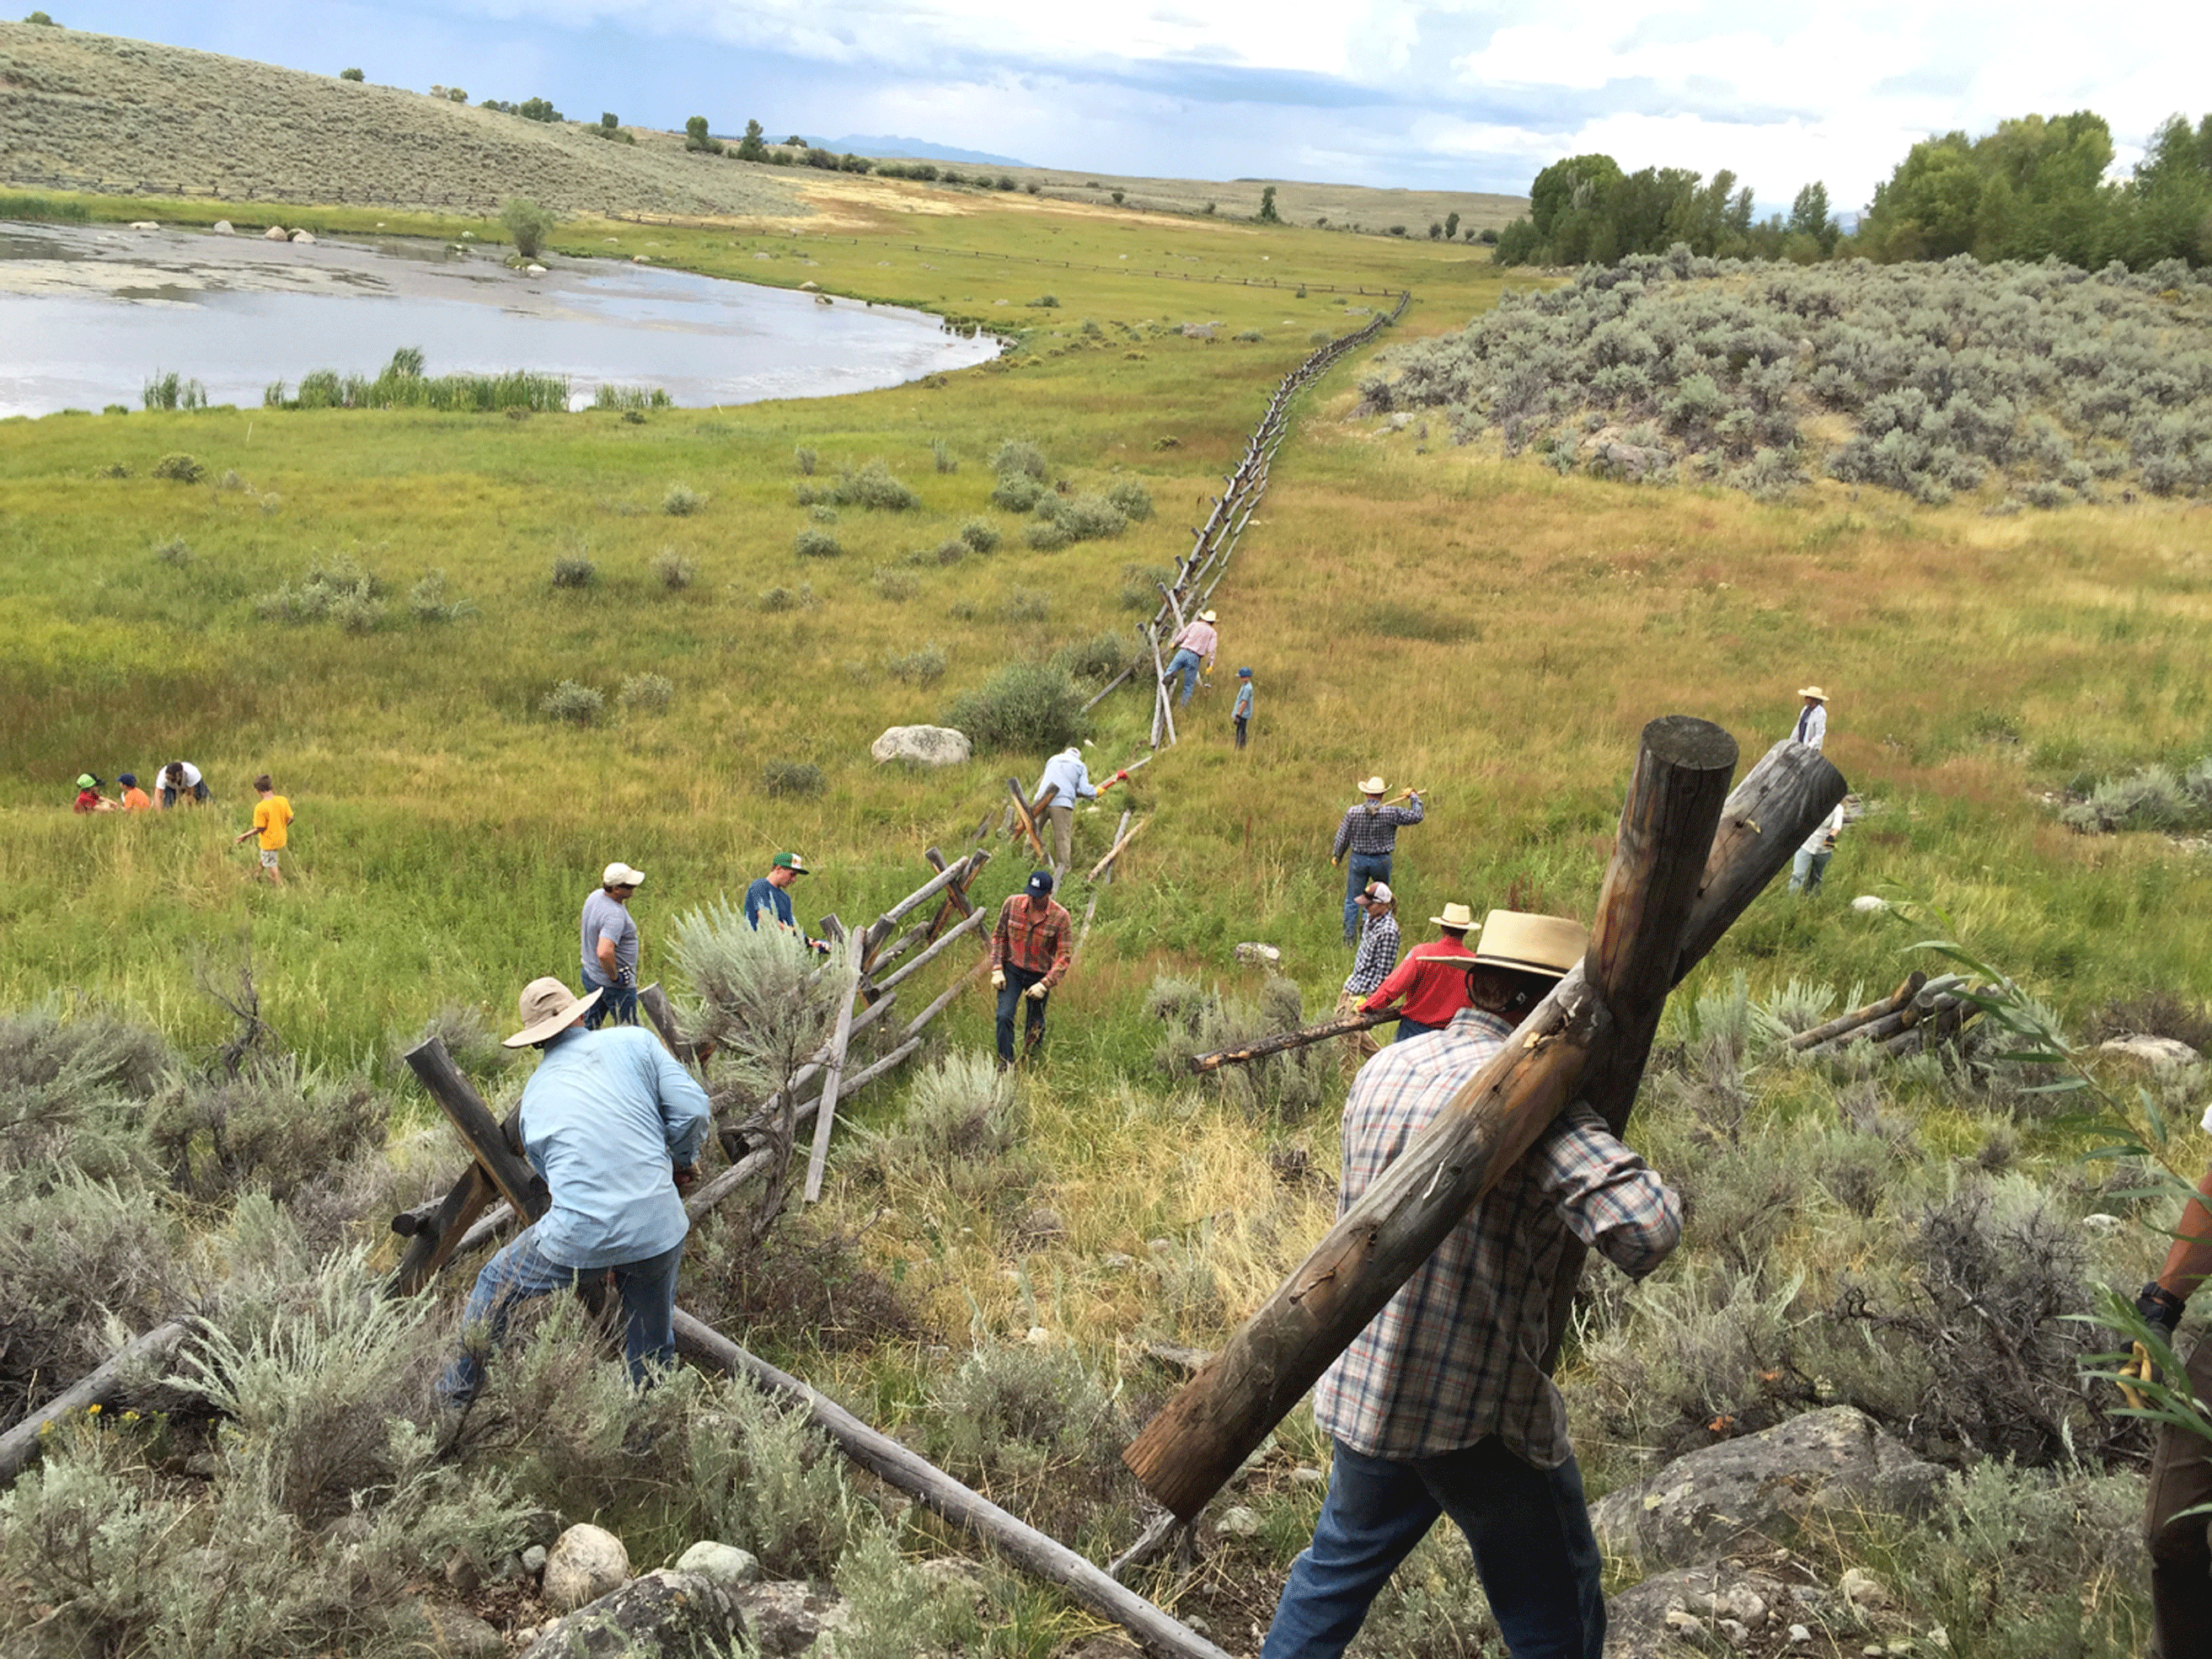
Volunteers working to remove problematic fences in the Fremont Lake bottleneck, which is used twice a year by 4,000–5,000 migrating mule deer. Photograph by Brian Remlinger, Alder Environmental, LLC.
Fence Modification for Madison Pronghorn in Southwest Montana
A pronghorn collaring study conducted by Montana Fish, Wildlife & Parks in 2020 identified a fence barrier to migration in the Madison Valley herd, which supports one of the largest wintering pronghorn populations in southwest Montana. Maps of pronghorn movements highlighted a blockage to the southern migratory route between U.S. Highway 287 and the Madison River (fig. 3A−C). Five collared pronghorn encountered the fence barrier on their spring migration. Once encountered, four of the five pronghorn backtracked 3 mi (5 km) to the north before crossing U.S. Highway 287 to resume their southbound migration. Field visits identified a dilapidated jack-leg and woven-wire fence obstructing a wildlife passage that was located between the BLM and private lands. The BLM surveyed the property and worked with the landowner to replace the impassable fence using wildlife-friendly materials and design to allow pronghorn passage. After modification, two collared pronghorn passed through the wildlife-friendly fence during their spring migration. Montana Fish, Wildlife & Parks continues to monitor animal movements in the area.
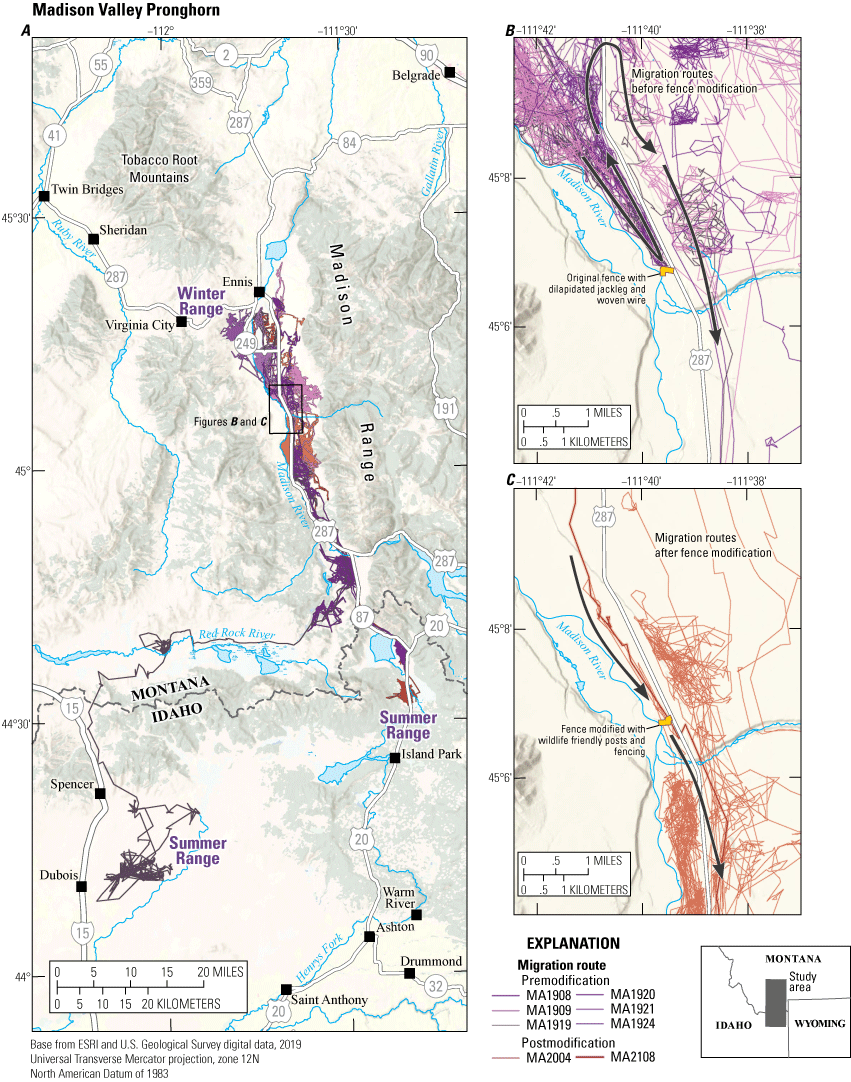
A, annual range (including migratory movements) of the Madison Valley pronghorn herd in southwest Montana and showing B, premodification and C, postmodification of fences.
Mitigating Development Within Corridors
In many areas throughout the western United States, the public lands where ungulates overwinter or move through during migration are at risk of being affected by energy development. Recent studies indicate that disturbances from energy development disrupt the behavior of migrating animals. Migrating deer, for example, reduce stopover use, increase their travel speed, and sometimes detour around energy development (Sawyer and others, 2013; Wyckoff and others, 2018). Once surface disturbance, the amount of native vegetation that is converted to well pads and access roads, exceeds approximately 3 percent of an area, use sharply declines for migratory mule deer (Sawyer and others, 2020). Similar results have been seen with pronghorn when their migration corridors encounter energy development on the landscape (Milligan and others, 2021; Lambert and others, 2022). Sawyer and others (2013) noted that this type of disturbance has the potential to further reduce the functionality of corridors already affected by human barriers, like high-traffic roads and impermeable fences. Indeed, a recent study found that the behavioral disturbances created by energy developments caused the movements of mule deer to become temporally mismatched from the optimal green wave of high-quality forage (Aikens and others, 2022).
Mapping migration routes has made it clear that many migrating ungulates can navigate around or through some minimal level of development (Kauffman and others, 2018). However, threshold levels of development that threaten migration persistence are rarely quantified (but see Sawyer and others, 2020). In the absence of such guidance, wildlife and land managers have sought to minimize development that occurs within the migration corridors. For example, in south-central Idaho, the commercial-scale Lava Ridge Wind Energy Project is proposed to be constructed on and around Owinza Butte, which serves as important winter and migratory habitat for mule deer and pronghorn. Mapped with data from pronghorn radio-collared on summer ranges in 2019 and 2020, the newly mapped Owinza Pronghorn migration (Kauffman and others, 2022a) connects the winter range, associated with the proposed project, with the pronghorn summer range more than 40 mi (64 km) to the north. As part of their ongoing technical assistance for the wind energy project, IDFG shared maps of the Owinza Pronghorn migration with the BLM to inform National Environmental Policy Act analyses of potential project effects on pronghorn and to develop recommendations to avoid or minimize adverse effects. Monitoring of radio-collared pronghorn and mule deer by IDFG plans to continue before, during, and after project construction, if the project continues, to refine the migration maps and allow better understanding of how wind energy may affect big-game winter habitat selection, seasonal movements, and demographic performance.
In southwestern Wyoming, the Red Desert to Hoback mule deer migration (Kauffman and others, 2020a) extends north from their winter range north of Interstate 80, crossing expansive tracts of BLM land that were made available for energy development leasing in 2019. After discovering the Red Desert to Hoback mule deer migration (Sawyer and others, 2014), the Wyoming Game and Fish Department (WGFD) designated this corridor, enrolling it as the first migration to be officially recognized by Wyoming as part of its Ungulate Corridor Conservation Strategy (Wyoming Game and Fish Department, 2016). Having designated and mapped a corridor of known width allowed the WGFD to evaluate if any leases would potentially reduce the functionality of the corridor. After the spatial overlap was evaluated, Wyoming requested that numerous leases be deferred. For example, in the first quarter of 2019 alone, the DOI deferred 14,020 acres (5,674 ha) of oil and gas leases within the mapped corridor because developing them posed too great of a risk to the corridor (Kauffman and others, 2021b).
Human recreation that impinges on migration can also disrupt migrating animals if not managed properly. In Idaho, construction of a new mountain bike trail was proposed in 2017 on U.S. Army Corps of Engineers lands along the shoreline of Lucky Peak Lake, which is surrounded by big-game winter range on the Boise River Wildlife Management Area (WMA). The Boise River WMA supports the largest and most-hunted mule deer herd in Idaho and is specifically managed to provide winter range for migratory mule deer and elk. The area supports more than 3,500 wintering mule deer, some of which migrate more than 70 mi (113 km) to their summer range in upper reaches of the Boise River watershed. The WMA’s Charcoal Segment, which would have been directly affected by the bike trail, contains the highest quality winter range on the WMA. Mapping of the Blacks Creek mule deer migration route (Kauffman and others, 2022a) was a communication centerpiece that served to inform the 2020 U.S. Army Corps of Engineers decision to not construct the trail. The project was deemed to have far-reaching landscape effects on mule deer, big-game hunting, and Idaho’s related socioeconomics.
Private Land Conservation
While many ungulate seasonal ranges are anchored by extensive swaths of public lands, they are often stitched together by large tracts of private ranchlands (Gigliotti and others, 2022). Many migrations span elevational and habitat gradients, forcing ungulates to traverse a diverse matrix of publicly and privately owned lands (Middleton and others, 2020). As the human population in western states continues to grow, many of the ranchlands that underpin migration corridors and other seasonal ranges are at risk of subdivision, which can compromise migrations and degrade the quality and functionality of winter range (Wyckoff and others, 2018).Conservation easements are a common conservation solution to protect private lands from subdivision. A conservation easement is a legal contract wherein a private landowner receives financial compensation in exchange for the property’s development rights. The agreements are always voluntary, and the rights are typically transferred to a land trust or other government entity. Numerous land trusts, State wildlife agencies, and other conservation groups are working across western states to conserve wildlife habitat through conservation easements, thereby preventing future development.
One area where conservation easements have been used effectively to protect private lands associated with ungulate migrations is in the Upper Green River Basin of Wyoming. The lowlands of the basin consist of expansive Artemisia spp. (sagebrush) habitat, which gives way to mountain shrub communities, forests, and alpine habitats moving west into the Wyoming Range or north into the Gros Ventre and Wind River Ranges. Elk, mule deer, pronghorn, and moose all migrate through this region, wintering in the sagebrush basins and summering in the mountains. The sagebrush winter ranges tend to be public lands managed by the BLM, while much of the summer range is public and managed by the FS. However, the areas between the seasonal ranges are frequently comprised of working lands: large tracts of private lands interspersed with some public lands, which are primarily used for ranching.
Because this region also has high-quality sagebrush habitat and abundant Centrocercus spp. (sage grouse) populations, it was a focal region for private land conservation to keep sage grouse from being listed under the Endangered Species Act. From 2010 to 2018, the U.S. Department of Agriculture Natural Resources Conservation Service, through its Sage Grouse Initiative, worked with State and nongovernmental organization partners to fund 55 conservation easements (approximately 75,000 acres [30,351 ha]) throughout the Upper Green River Basin (fig. 4). Although this private land conservation did not specifically target migration corridors, ungulate mapping efforts in this region indicated that the Natural Resources Conservation Service’s effort focused on sage grouse has had a substantial additional benefit in conserving the private lands that support the ungulate migrations of the Upper Green River Basin (Ryan, 2015).
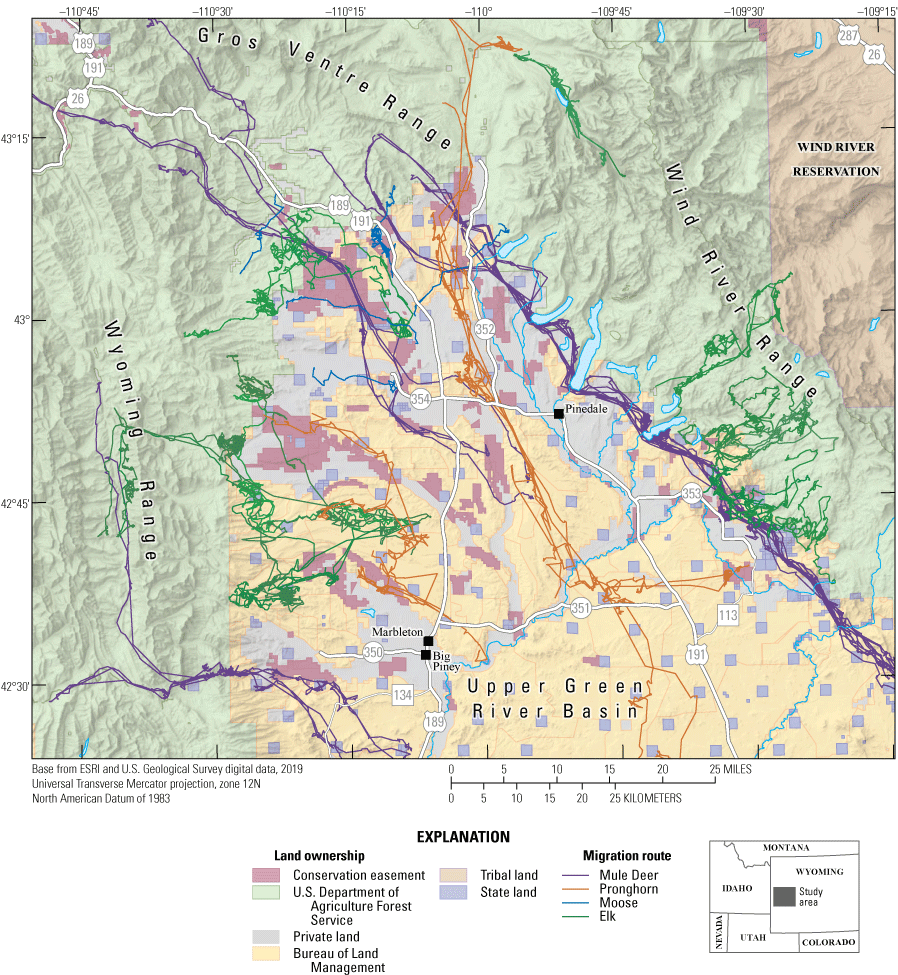
Conservation easements and ungulate migrations in the Wyoming Upper Green River Basin.
Wildlife Corridor in Eagle Mountain, Utah
In 2018, the Utah Division of Wildlife Resources (UDWR) began radio collaring mule deer in and around Eagle Mountain, Utah. As the collar data were collected, the UDWR realized that the population used a migration corridor that traversed habitat between two rapidly growing parts of the city, to the north and south (fig. 5A). Since 2018, 46 mule deer have been collared, yielding a robust representation of their seasonal movements. Wildlife managers estimate that approximately 2,000 mule deer migrate through the Eagle Mountain area. Because Eagle Mountain is one of the fastest growing cities in Utah (State of Utah, 2014), wildlife managers and city planners recognized that continued growth of the city would likely threaten the existing corridor. In an effort to maintain the corridor, the Eagle Mountain City Council approved a Wildlife Corridor Overlay Zone in 2021, becoming the first city in Utah to consider this type of zoning. While the final designs have not been settled, the Wildlife Corridor Overlay Zone may limit development and other barriers within a 1,300-acre (526-ha) corridor area. Although the corridor is only 330-ft (101-m) wide in some places, it is the first attempt of its kind to proactively plan for urban and suburban development and accommodate the seasonal movement of migratory ungulates. In addition to the corridor zone, the UDWR is also working with the Utah Department of Transportation to construct an impermeable fence along the south side of State Route 73 to funnel animals to a suitable crossing point. An automatic system is also being developed to alert drivers to crossing deer.
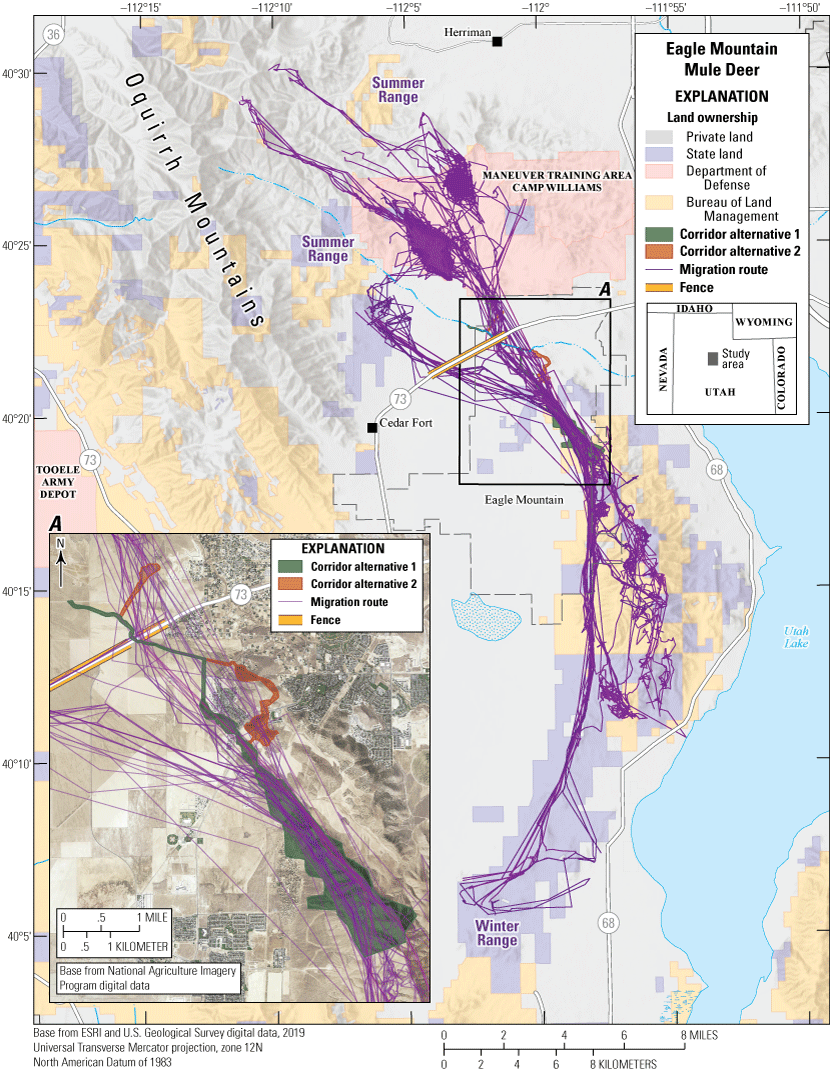
Wildlife corridor in Eagle Mountain, Utah as well as A, focused view of the two corridor alternatives.
Policies to Enhance Ungulate Migration and Winter Habitat
The U.S. Department of the Interior issued SO 3362 in 2018 to encourage Federal agencies to support western states and their efforts to enhance the migration and winter habitat for mule deer, elk, and pronghorn on Federal lands (U.S. Department of the Interior, 2018). Since then, this Federal directive has provided millions of dollars to 11 western states for migration research and on-the-ground mitigation efforts. Additionally, this broader emphasis on migratory ungulates and conserving migration corridors has prompted various policy actions at the State level. For example, Colorado (State of Colorado, 2019), Wyoming (State of Wyoming, 2020), and Nevada (State of Nevada, 2021) have issued executive orders aimed at identifying and developing collaborative strategies to conserve big-game migration routes. Other States have passed legislation aimed at improving landscape connectivity for migratory ungulates, including the Wildlife Corridors Act (State of New Mexico, 2019) and the Wildlife Corridors Bill (State of Oregon, 2019). Together, these State and Federal policies encourage widespread planning, research, and mitigation efforts that accommodate, or at least consider, the habitat requirements of migratory ungulates in the western United States. Winter, stopover, and migration habitats identified by the State and Federal analysts working to map migrations for this report series will continue to help inform these policies as they evolve.
Herd Summaries
The herd-specific maps and associated summary text provide the core of the Ungulate Migrations of the Western United States report series. In the following sections, we provide previously unpublished maps documenting 45 migrations, within most western states and select Tribal lands. These maps have been produced in close collaboration with participating State or Tribal agencies, which have collected the GPS collar data in most cases. The data layers mapped for each herd vary based on State-level policies and may include migration routes (lines) or corridors (polygons), stopovers, winter ranges, and (or) annual ranges. In addition to the herd maps, we provide project and analytical details, summary statistics on the included data, and relevant contacts and reports. The general workflow for the analysis of each herd’s data consisted of the following steps: (1) select migration dates for each animal-year using the Migration Mapper application (Merkle and others, 2022), (2) use a BBMM to estimate a unique utilization distribution (UD) for each migration sequence (Horne and others, 2007), (3) average the UD for a given individual’s spring and fall migration sequences across all years, and (4) stack the averaged individual UD for a given herd and define different levels of migration-route use based on the number of individuals using a given pixel, or defined area of space. In general, we defined low use as areas traversed by at least one collared individual during migration, medium use as areas used by greater than 10 percent of collared migrants within the population, and high use as areas used by greater than 20 percent of collared migrants within the herd. However, some individual states adapted these general methods to adhere to state-specific methodologies. A complete description of the methods, sometimes varying by herd, is included in appendix 1.
In combination with the map for each herd and the associated text, these summary statistics provide an overview of the documented ungulate migrations across the western United States and serve as an additional tool to help inform local and regional management and conservation. The data layers for many of the herds mapped in this section are also available to the public through the associated data release (Kauffman and others, 2022c).
Arizona | Mule Deer
South of Interstate 40 Mule Deer
The South of Interstate 40 mule deer reside in Game Management Units (GMUs) 8 and 6B in Arizona. The herd summers in high-elevation open meadows and Pinus ponderosa (ponderosa pine) habitat southwest of Flagstaff, Arizona. In late October, the herd migrates west to lower elevation Pinus spp. (pinyon pine)-Juniperus spp. (juniper) and shrub habitats near the junction of Interstate 40 and U.S. Highway 89 (fig. 6). With funding support by the DOI through SO 3362, research on this herd’s migration began in February 2020. Additional GPS collars were deployed in January 2022 with support from the FS, Mule Deer Foundation, and other partners. Primary threats to the herd’s migration involve high-volume roads including Interstate 40 and U.S. Highways 89 and 89A.
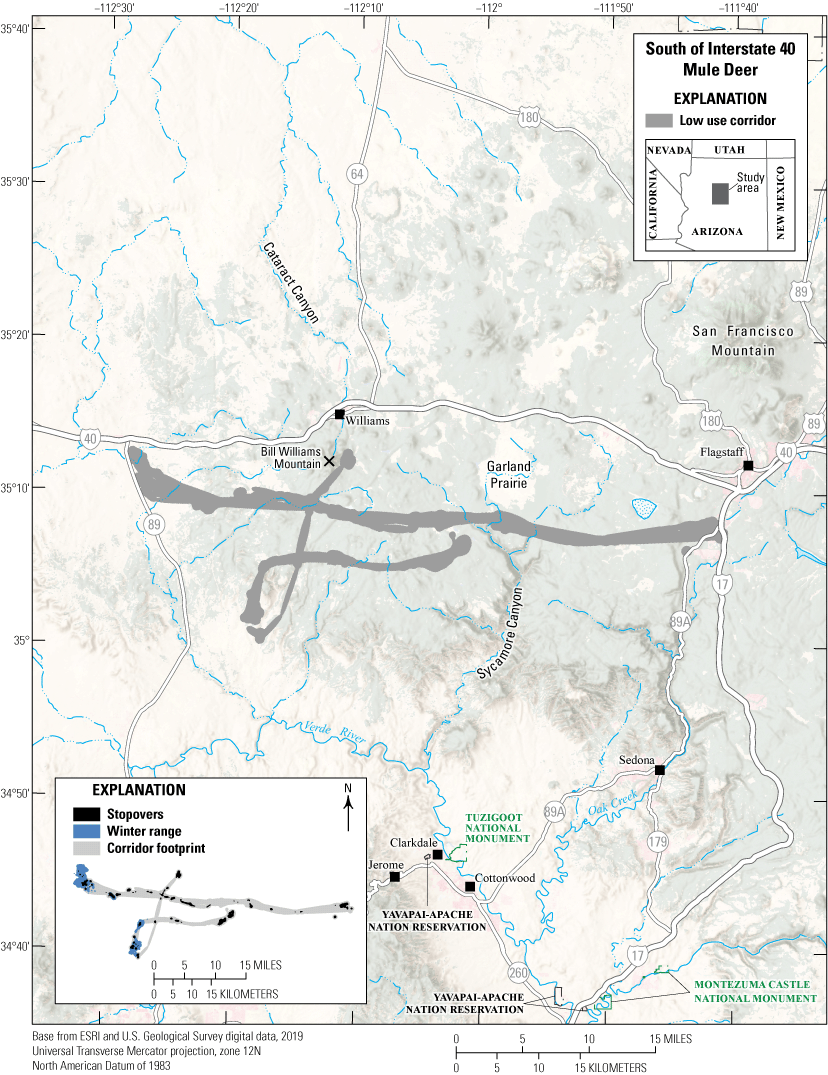
Migration corridors, stopovers, and winter range of the South of Interstate 40 mule deer herd.
Data Analysis
-
Corridor, stopover, and winter range analysis: BBMM (Sawyer and others, 2009); corridor analysis used Fixed Motion Variance (see appendix 1 for further description)
-
Delineation of migration periods: Net Squared Displacement (NSD) (Bunnefeld and others, 2011)
Corridor and Stopover Summary
Migration start and end dates (median):
Average number of days migrating: Migration corridor length: Migration corridor area:California | Mule Deer
Blue Canyon Mule Deer
The Blue Canyon mule deer herd winters in the western foothills of the Sierra Nevada south of Interstate 80. The winter range includes dense conifer and oak woodland that is shared with a resident portion of the herd on a mix of public and private lands. In the spring, the Blue Canyon herd migrates from their winter range eastward along two main paths located on the north and south sides of the Forest Hill Divide to higher elevation terrain near Soda Springs and the crest of the Sierra Nevada (fig. 7). The summer range includes primarily mixed-conifer forests opening up to high alpine granite near the crest of the Sierra Nevada. The population size is not well known because of limited surveys, but is considered stable to declining, affected primarily by increasingly dense overstory and habitat loss. This GPS collaring project was designed as part of a region-wide effort to obtain abundance estimates for deer using fecal DNA and home range analyses, with pinpointing migration routes and identifying winter ranges a secondary priority. Because of the small sample of GPS-tagged mule deer, additional migration routes and winter ranges probably exist beyond the extent of our model output.
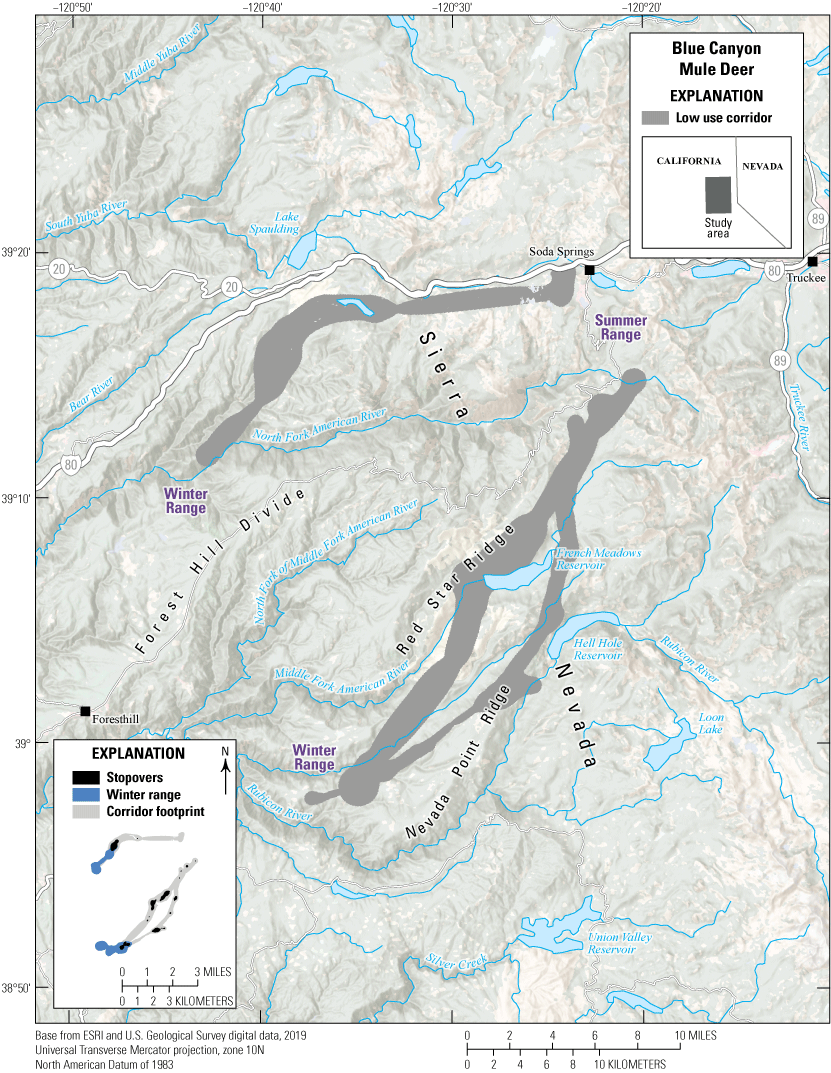
Migration corridors, stopovers, and winter ranges of the Blue Canyon mule deer herd.
Data Analysis
-
Corridor, stopover, and winter range analysis: Fixed Motion Variance (see appendix 1 for further description)
-
Delineation of migration periods: NSD (Bunnefeld and others, 2011)
-
Models derived from:
-
Migration: 9 sequences from 3 individuals (3 spring sequences, 6 fall sequences)
-
Winter: 6 sequences from 3 individuals
Corridor and Stopover Summary
Migration start and end dates (median):
Average number of days migrating: Migration corridor length: Migration corridor area:California | Mule Deer
Bucks Mountain-Mooretown Mule Deer
The Bucks Mountain-Mooretown mule deer herd winters in the western foothills of the Sierra Nevada. The winter range includes vernal pool grassland, oak woodland, and dense-conifer that is shared with a resident portion of the herd on a mix of public and private lands. In the spring, the Bucks Mountain-Mooretown herd migrates along the U.S. Highway 70 corridor and high-elevation locations of the Sierra Nevada east and south to higher elevation terrain in the surrounding national forest lands east of the Sierra Nevada near Quincy and La Porte, California (fig. 8). The summer range is primarily mixed-conifer forests opening up to high alpine granite near the crest and transitioning to a mix of conifer and shrub communities on the eastern side of the Sierra Nevada. Although the population size is not well known, it is considered stable to declining, affected primarily by increasingly dense overstory, environmental stressors, and habitat loss. This GPS collaring project was designed as part of a region-wide effort to obtain abundance estimates for deer using fecal DNA and home range analyses, with pinpointing migration routes and identifying winter ranges a secondary priority. Because of the low sample size, additional migration routes and winter ranges probably exist beyond the extent of our model output.
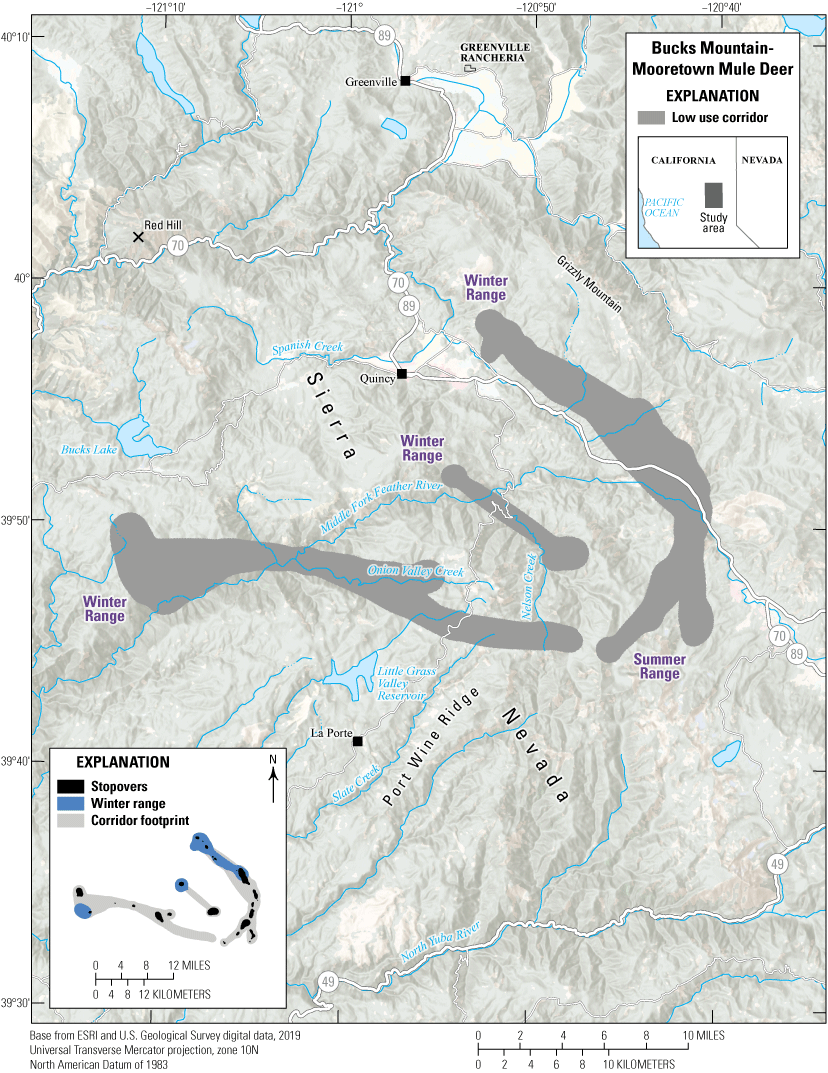
Migration corridors, stopovers, and winter ranges of the Bucks Mountain-Mooretown mule deer herd.
Data Analysis
-
Corridor, stopover, and winter range analysis: Fixed Motion Variance (see appendix 1 for further description)
-
Delineation of migration periods: NSD (Bunnefeld and others, 2011)
-
Models derived from:
-
Migration: 11 sequences from 4 individuals (5 spring sequences, 6 fall sequences)
-
Winter: 6 sequences from 4 individuals
Corridor and Stopover Summary
Migration start and end dates (median):
Average number of days migrating:Migration corridor length:
Migration corridor area:Other Information
Project contacts:
-
Julie Garcia (Julie.Garcia@wildlife.ca.gov), Deer Biologist, California Department of Fish and Wildlife
-
Sara Holm (Sara.Holm@wildlife.ca.gov), Wildlife Biologist, California Department of Fish and Wildlife
-
Stacy Anderson (Stacy.Anderson@wildlife.ca.gov), Wildlife Biologist, California Department of Fish and Wildlife
Data analyst:
California | Mule Deer
Downieville-Nevada City Mule Deer
The Downieville-Nevada City mule deer herd winters in the western foothills of the Sierra Nevada range. The winter range includes dense conifer and oak woodland that is shared with a resident portion of the herd on a mix of public and private lands. In the spring, the migratory component of the herd migrates north and east of Nevada City on both sides of the middle fork of the Yuba River, staying north of Interstate 80, to high-elevation summer range along the crest of the Sierra Nevada (fig. 9). The summer range is primarily mixed-conifer habitat opening up to high alpine granite near the crest of the Sierra Nevada. The population size is unknown because of limited survey capacity, but the population is considered stable to declining, affected primarily by dense overstory, environmental stressors, and habitat loss. This GPS collaring project was designed as part of a region-wide effort to obtain abundance estimates for deer using fecal DNA and home range analyses, with pinpointing migration routes and identifying winter ranges a secondary priority. Because of the small sample size, additional migration routes and winter ranges probably exist beyond the extent of our model output.
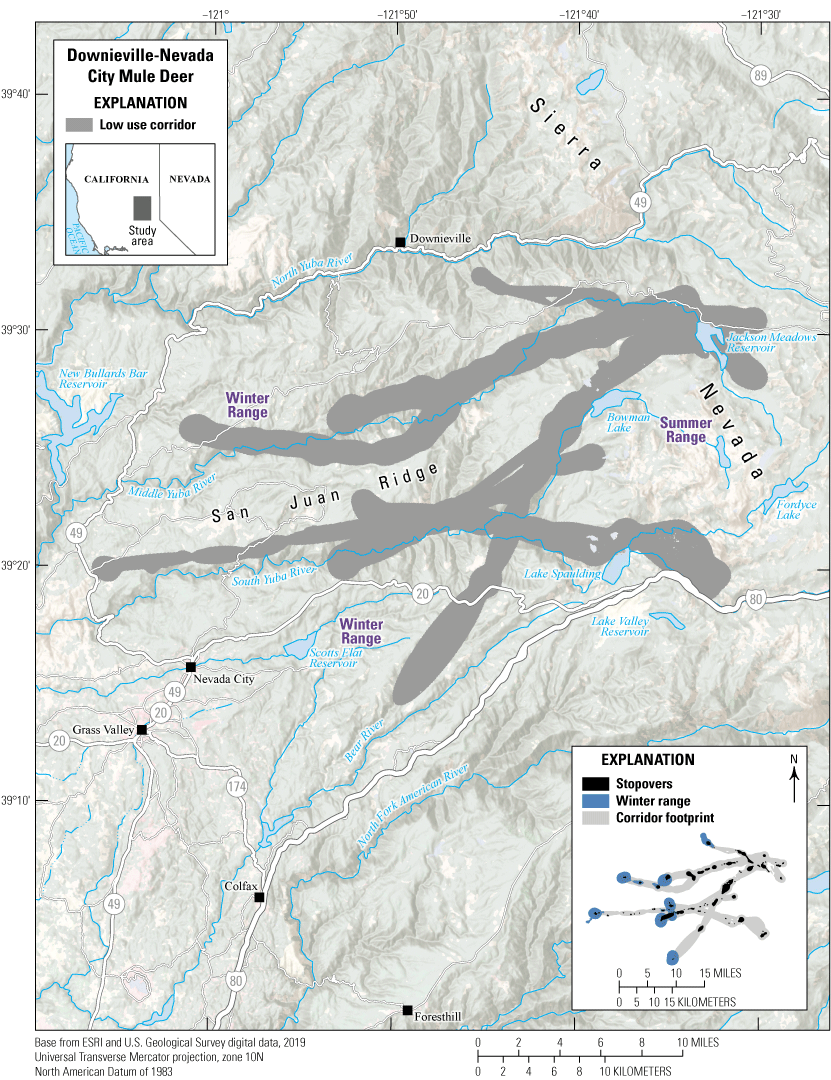
Map showing migration corridors, stopovers, and winter ranges of the Downieville-Nevada City mule deer herd.
Data Analysis
-
Corridor, stopover, and winter range analysis: Fixed Motion Variance (see appendix 1 for further description)
-
Delineation of migration periods: NSD (Bunnefeld and others, 2011)
-
Models derived from:
-
Migration: 19 sequences from 8 individuals (8 spring sequences, 11 fall sequences)
-
Winter: 10 sequences from 8 individuals
Corridor and Stopover Summary
Migration start and end dates (median):
Average number of days migrating: Migration corridor length: Migration corridor area:Other Information
Project contacts:
-
Julie Garcia (Julie.Garcia@wildlife.ca.gov), Deer Biologist, California Department of Fish and Wildlife
-
Sara Holm (Sara.Holm@wildlife.ca.gov), Wildlife Biologist, California Department of Fish and Wildlife
-
Stacy Anderson (Stacy.Anderson@wildlife.ca.gov), Wildlife Biologist, California Department of Fish and Wildlife
California | Mule Deer
East Tehama Mule Deer
The East Tehama herd is the largest migratory population of mule deer in California (Hill and Figura, 2020). Population numbers peaked in the 1960s but have declined in recent decades (Ramsey and others, 1981). These mule deer migrate from a lower elevation winter range in the foothills east of the Sacramento Valley to upper elevation summer ranges in the southern Cascades and northern Sierra Nevada (fig. 10). Although portions of the herd winter on the California Department of Fish and Wildlife’s Tehama Wildlife Area and other public lands, the herd’s winter range also comprises many private ranchlands. The herd’s summer range includes significant portions of surrounding national forest lands as well as Lassen Volcanic National Park and private timberlands. Primarily oak woodlands and annual grasslands characterize the winter range, while the summer range consists of conifer forests, montane meadows, and montane chaparral. Potential threats to the herd include habitat changes resulting from fire management (including fire suppression and catastrophic wildfires), forest succession, vegetation management, and climate change. A small percentage of the herd are residents, inhabiting areas along the Sacramento River and areas of irrigated agriculture.
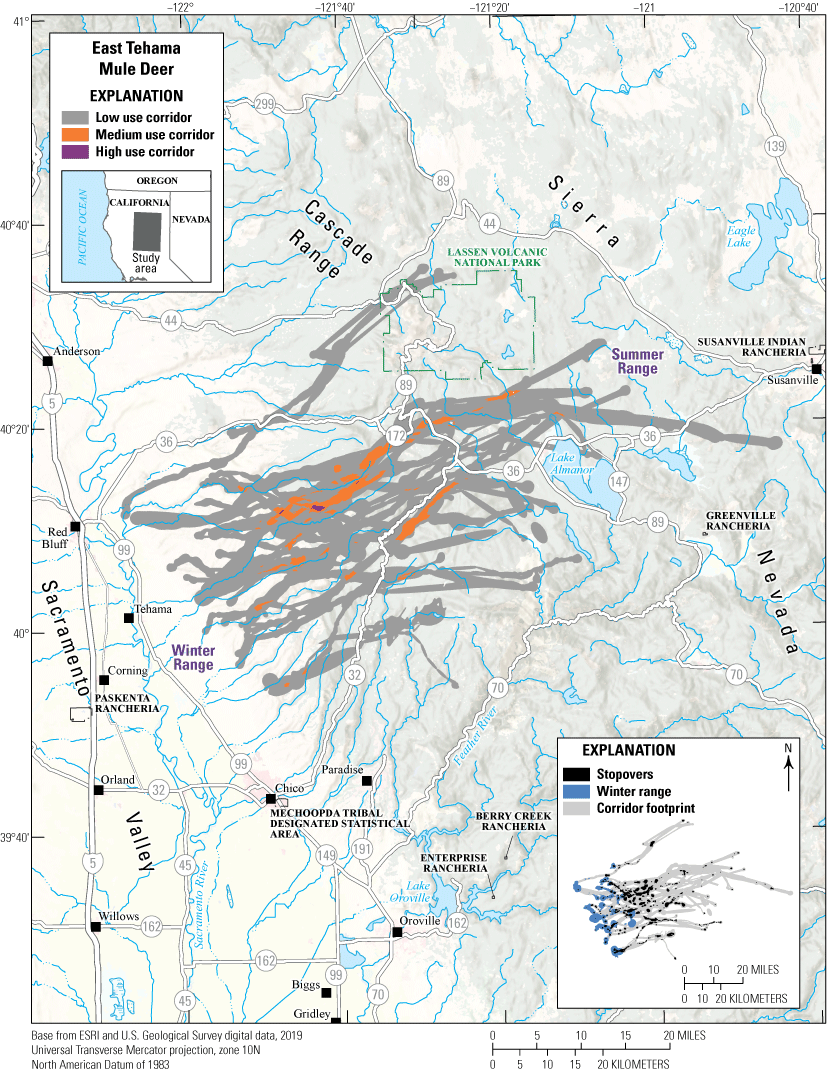
Migration corridors, stopovers, and winter ranges of the East Tehama mule deer herd.
Data Analysis
-
Corridor, stopover, and winter range analysis: Fixed Motion Variance (see appendix 1 for further description)
-
Delineation of migration periods: NSD (Bunnefeld and others, 2011)
-
Models derived from:
-
Migration: 63 sequences from 33 individuals (28 spring sequences, 35 fall sequences)
-
Winter: 36 sequences from 33 individuals
Corridor and Stopover Summary
Migration start and end dates (median):
Average number of days migrating: Migration corridor length: Migration corridor area:Other Information
Project contacts:
-
Julie Garcia (Julie.Garcia@wildlife.ca.gov), Deer Biologist, California Department of Fish and Wildlife
-
Ken Morefield (Ken.Morefield@wildlife.ca.gov), GIS Supervisor, California Department of Fish and Wildlife
-
Stacy Anderson (Stacy.Anderson@wildlife.ca.gov), Wildlife Biologist, California Department of Fish and Wildlife
-
Pete Figura (Pete.Figura@wildlife.ca.gov), Wildlife Management Supervisor, California Department of Fish and Wildlife
-
Hill, S.C., and Figura, P.J., 2020, Migration and seasonal ranges of the Eastern Tehama deer herd in northern California: California Fish and Wildlife Journal, v. 106, p. 170–185.
-
Ramsey, T.E., Pyshora, L., and Thompson, S.J., 1981, Eastern Tehama deer herd management plan: Reading, Calif., California Department of Fish and Wildlife, 148 p.
California | Mule Deer
Grizzly Flat Mule Deer
The Grizzly Flat herd winters in the western foothills of the Sierra Nevada near Grizzly Flats, California. The winter range includes conifer forests, vineyards, and oak woodland that is shared with a resident portion of the herd on a mix of private and public lands. In the spring, the Grizzly Flat herd migrates east to higher elevation terrain in the surrounding national forest, staying south of Interstate 50 and primarily north of U.S. Highway 88, to the crest of the Sierra Nevada (fig. 11). The summer range contains primarily mixed-conifer forests opening up to high alpine granite near the crest of the Sierra Nevada. Although the population size of the Grizzly Flat herd is unknown because of limited surveys, it is considered stable to declining, affected primarily by dense overstory, environmental stressors, and habitat loss. This GPS-collaring project was designed as part of a region-wide effort to obtain abundance estimates for deer using fecal DNA and home range analyses, with pinpointing migration routes and identifying winter ranges a secondary priority. Because of the small sample size of GPS-tagged mule deer, additional migration routes and winter ranges probably exist beyond the extent of our model output.
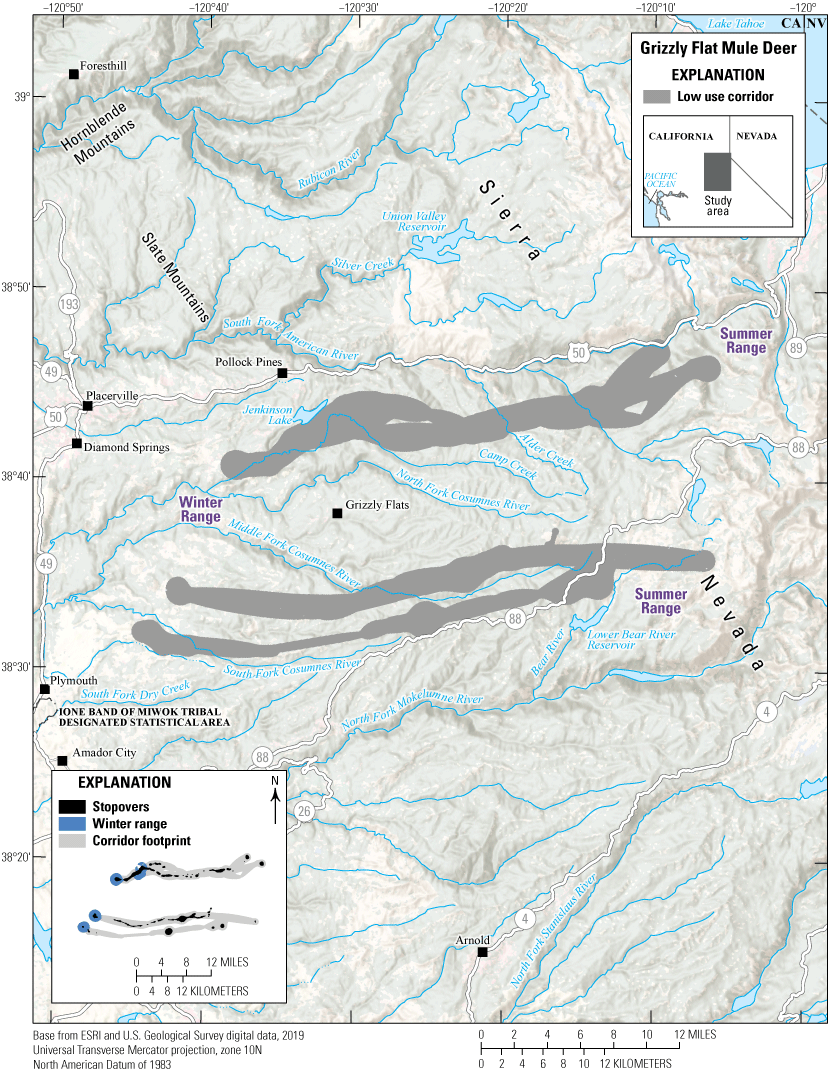
Migration corridors, stopovers, and winter ranges.
Data Analysis
-
Corridor, stopover, and winter range analysis: Fixed Motion Variance (see appendix 1 for further description)
-
Delineation of migration periods: NSD (Bunnefeld and others, 2011)
-
Models derived from:
-
Migration: 16 sequences from 5 individuals (8 spring sequences, 8 fall sequences)
-
Winter: 8 sequences from 5 individuals
Corridor and Stopover Summary
Migration start and end dates (median):
Average number of days migrating: Migration corridor length: Migration corridor area:Other Information
Project contacts:
-
Julie Garcia (Julie.Garcia@wildlife.ca.gov), Deer Biologist, California Department of Fish and Wildlife
-
Sara Holm (Sara.Holm@wildlife.ca.gov), Wildlife Biologist, California Department of Fish and Wildlife
-
Shelly Blair (Shelly.Blair@wildlife.ca.gov), Wildlife Biologist, California Department of Fish and Wildlife
California | Mule Deer
Kern River Mule Deer
The Kern River deer herd abundance peaked in 1949, but numbers have decreased in recent decades. The population size estimate is now considered stable, owing primarily to habitat expansion by the 2001 McNally fire (California Department of Fish and Wildlife, 2022). The Kern River herd winters in regional national forest lands north of Johnsondale and east of Slate Mountain. In the spring, the herd migrates northward to an area by Redrocks Meadows and along the Kern Canyon ridgeline to their summer range in Sequoia National Park (fig. 12). The herd’s annual range spans the watersheds of the Kern and Little Kern Rivers in eastern Tulare County. Elevations range from 2,500 ft (762 m) on the southern slopes of the winter range to above 11,000 ft (3,353 m) on the northern summer range. Telemetry data during the past two decades show considerable mixing between this herd and the Manache herd on their summer ranges. Further research may support the hypothesis that these herds are subherds of a larger population. This GPS-collaring project was designed as part of a statewide deer-monitoring effort to obtain abundance estimates, demographic rates, and movement datasets.
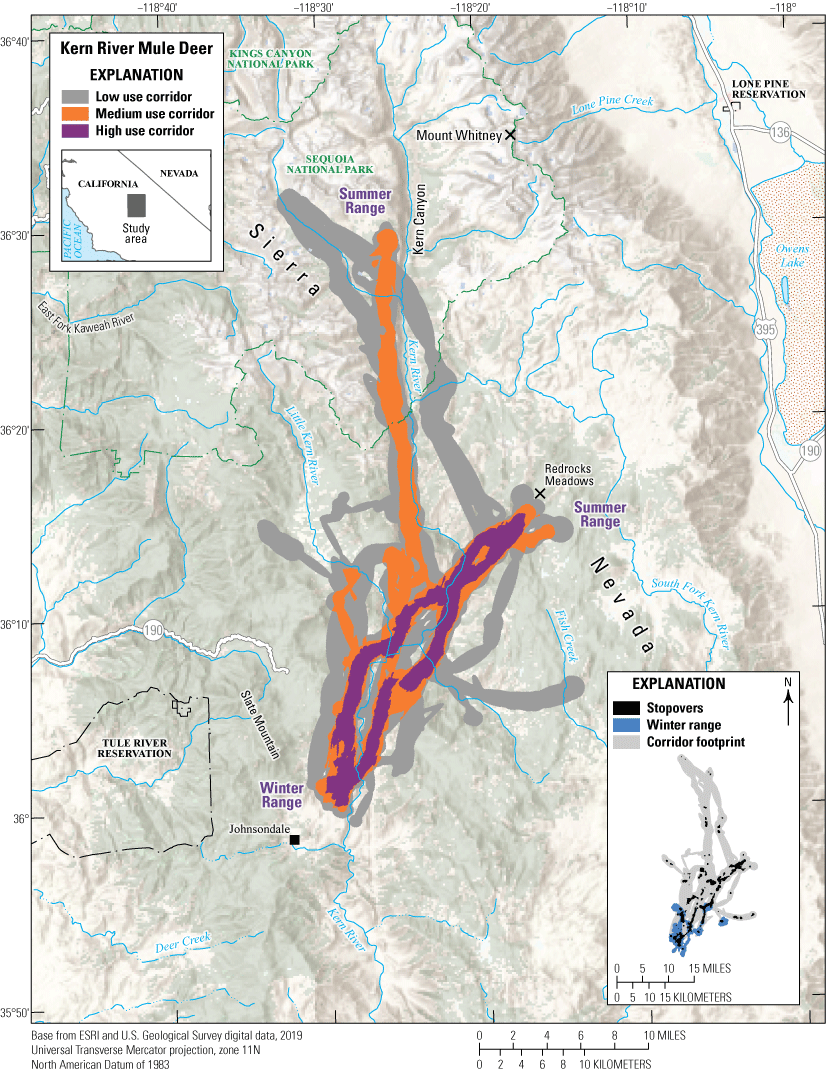
Migration corridors, stopovers, and winter ranges of the Kern River mule deer herd.
Data Analysis
-
Corridor, stopover, and winter range analysis: Combination of BBMM (Sawyer and others, 2009) and Fixed Motion Variance (see appendix 1 for further description)
-
Delineation of migration periods: NSD (Bunnefeld and others, 2011)
-
Models derived from:
-
Migration: 69 sequences from 27 individuals (43 spring sequences, 26 fall sequences)
-
Winter: 60 sequences from 27 individuals
Corridor and Stopover Summary
Migration start and end dates (median):
Average number of days migrating: Migration corridor length: Migration corridor area: Stopover area: 14,109 acres (5,710 ha)California | Mule Deer
Manache Mule Deer
The Manache mule deer herd predominantly covers the eastern slopes and crest of the Sierra Nevada. Elevation stretches from 3,200 ft (975 m) on the Owens Valley winter range to above 11,000 ft (3,353 m) on the summer range in Sequoia National Park. The Manache herd migrates from winter ranges just west of U.S. Highway 395 on the steep slopes and valleys of the Sierra Nevada near Dunmovin and Haiwee west to some of the highest elevations in the continental United States in the surrounding national forests (fig. 13). Deer numbers have fluctuated since 1900, attributed largely to livestock allotments, fire regimes, and timber-harvest practices. The population size in 2022 was unknown because of limited data. This GPS-collaring project was designed as part of a statewide deer-monitoring effort to obtain abundance estimates, demographic rates, and movement datasets.
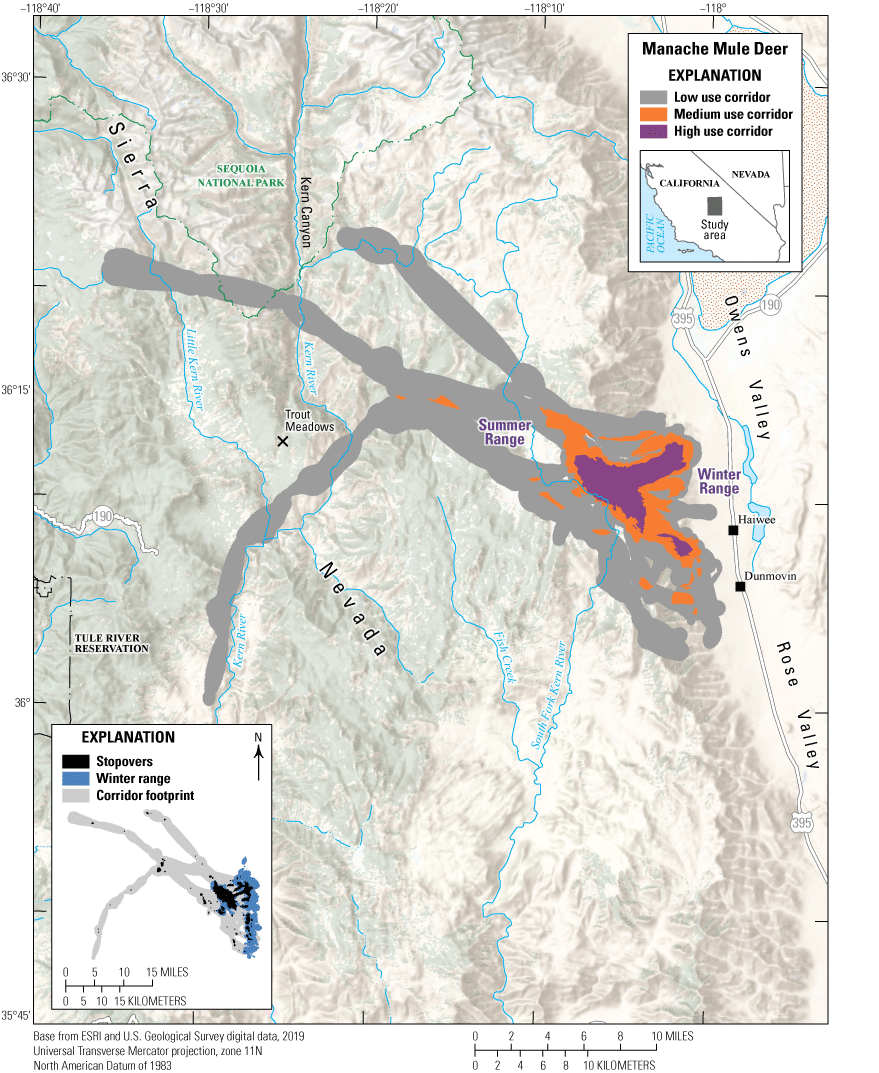
Migration corridors, stopovers, and winter ranges of the Manache mule deer herd.
Animal Capture and Data Collection
-
Sample size: 47 adult female mule deer
-
Relocation frequency: Approximately 2 hours
-
Project duration: 2020−2021
-
Data Analysis
-
Corridor, stopover, and winter range analysis: Combination of BBMM (Sawyer and others, 2009) and Fixed Motion Variance (see appendix 1 for further description)
-
Delineation of migration periods: NSD (Bunnefeld and others, 2011)
-
Models derived from:
-
Migration: 97 sequences from 39 individuals (64 spring sequences, 33 fall sequences)
-
Winter: 96 sequences from 42 individuals
Corridor and Stopover Summary
Migration start and end dates (median):
Average number of days migrating: Migration corridor length: Migration corridor area:California | Mule Deer
Salt Springs Mule Deer
The Salt Springs herd winters in the western foothills of the Sierra Nevada predominantly on private property from Tylers Corner south to Sheep Ranch. The summer range is in high-elevation terrain near Lower Bear River Reservoir and Salt Springs Reservoir (fig. 14). The winter range consists of mainly oak woodland habitat, and the summer range includes primarily mixed-conifer forests opening up to high alpine granite terrain near the crest of the Sierra Nevada. The population size is unknown because of limited data. This GPS-collaring project was designed as part of a region-wide effort to obtain abundance estimates for deer using fecal DNA and home range analyses, with pinpointing migration routes and identifying winter ranges a secondary priority. Therefore, other winter range and migration corridor routes probably exist apart from what the limited sample size revealed. Future work will help pinpoint the boundaries of this herd. The Salt Springs herd is particularly important for comparison to the Railroad Flat herd, which overlaps on the winter range with the Salt Springs herd (though the Railroad Flat herd uses a unique summer range).
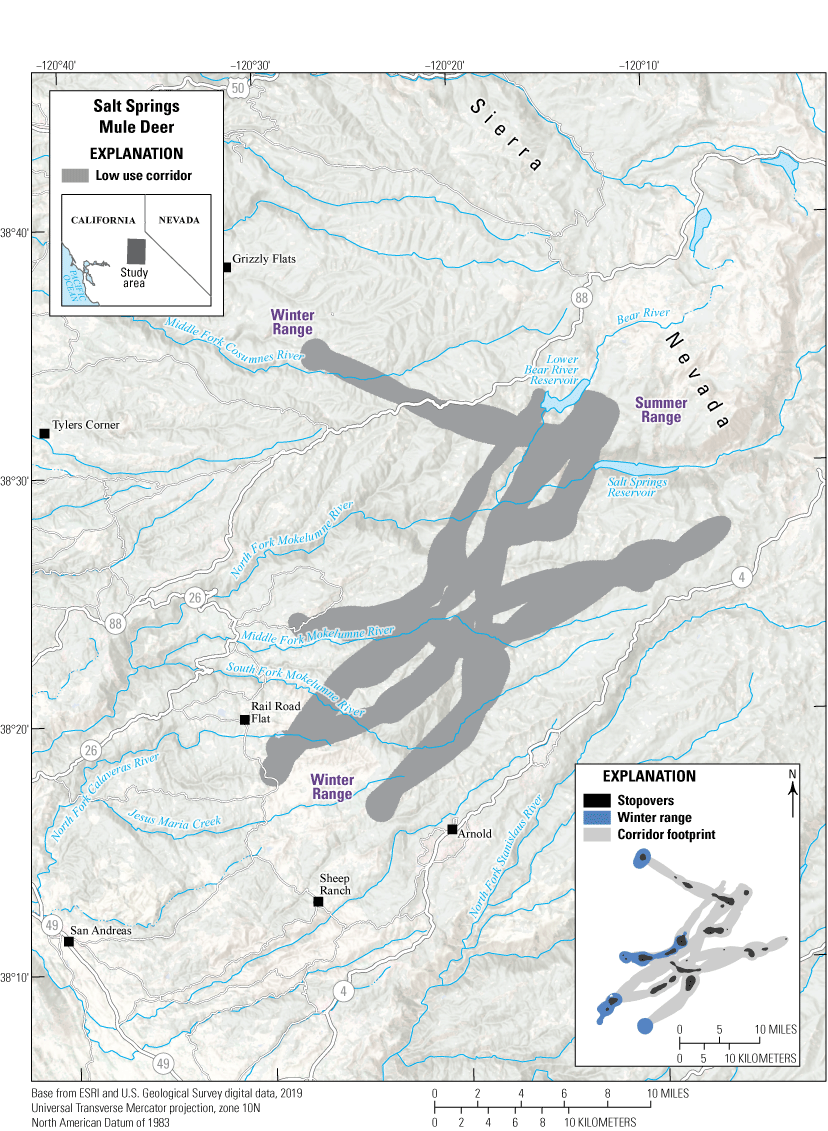
Migration corridors, stopovers, and winter ranges of the Salt Springs mule deer herd.
Animal Capture and Data Collection
-
Sample size: 8 adult female mule deer
-
Relocation frequency: Approximately 1−13 hours
-
Project duration: 2018−2020
-
Data Analysis
-
Corridor, stopover, and winter range analysis: Fixed Motion Variance (see appendix 1 for further description)
-
Delineation of migration periods: NSD (Bunnefeld and others, 2011)
-
Models derived from:
-
Migration: 13 sequences from 6 individuals (6 spring sequences, 7 fall sequences)
-
Winter: 8 sequences from 6 individuals
Corridor and Stopover Summary
Migration start and end dates (median):
Average number of days migrating: Migration corridor length: Migration corridor area:Other Information
Project contacts:
-
Julie Garcia (Julie.Garcia@wildlife.ca.gov), Deer Biologist, California Department of Fish and Wildlife
-
Helayna Pera (Helayna.Pera@wildlife.ca.gov), Environmental Scientist, California Department of Fish and Wildlife
-
Sara Holm (Sara.Holm@wildlife.ca.gov), Wildlife Biologist, California Department of Fish and Wildlife
California | Mule Deer
Siskiyou Mule Deer
The Siskiyou mule deer herd migrates from winter ranges primarily north and east of Mount Shasta (for example, Lake Shastina, Mount Dome, Mount Hebron, Tionesta, and Wild Horse Mountain) to sprawling summer ranges within regional wilderness areas in the west and the Burnt Lava Flow Geological Area to the east (fig. 15). A small percentage of the herd are residents, residing largely within winter ranges across the central and northeast areas of the herd’s annual distribution. The total population size of the Siskiyou herd is unknown, but adult deer densities averaged 6.01 deer per square kilometer (15.4 deer per square mile) on summer ranges in 2017 and 5.16 deer per square kilometer (13.23 deer per square mile) on winter ranges in 2019 (Wittmer and others, 2021). Some deer from the Siskiyou herd, including individuals not collared from this dataset but moving within herd boundaries, cross major highways during their seasonal migrations (U.S. Highways 97 and 89), and road mortalities of telemetered deer have been recorded (Cristescu and others, 2022). The summer range poses few concerns to the health of the herd, although limited water availability and recent forest fires may affect deer to some extent. Possible risks to deer population health on the winter range are relatively unknown. While recreational (hunting) opportunities have declined, the herd’s status is considered stable.
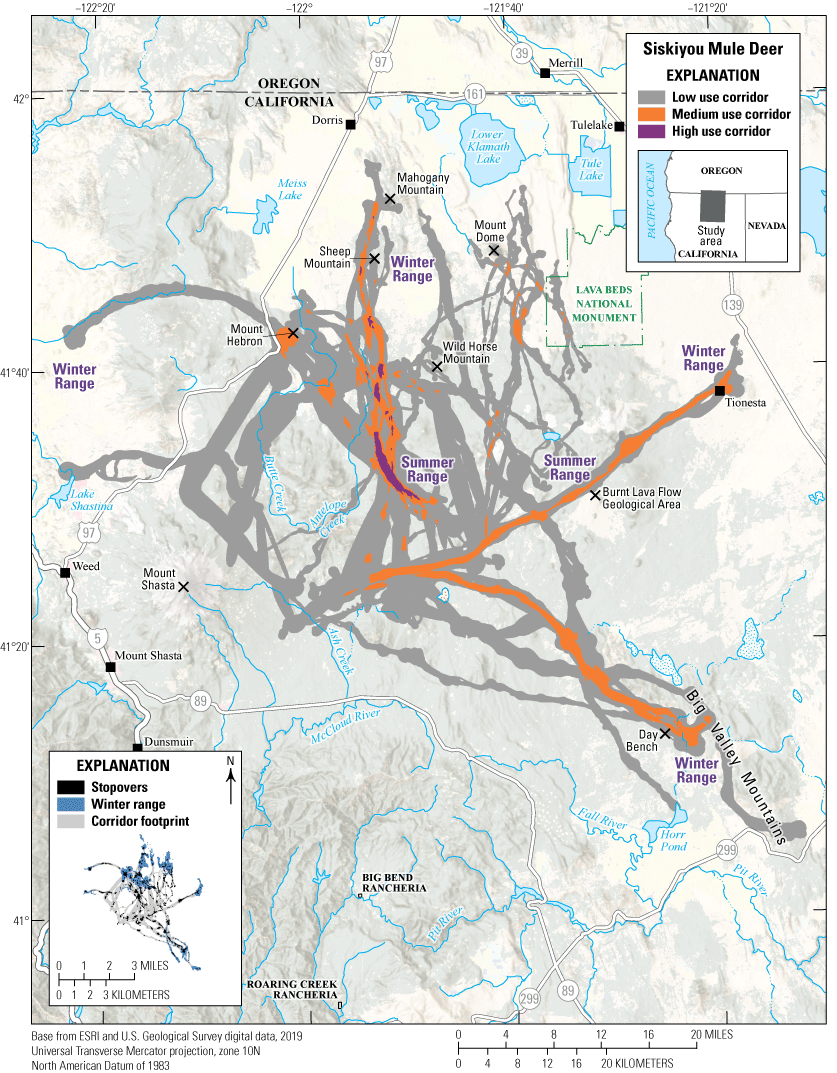
Migration corridors, stopovers, and winter ranges of the Siskiyou mule deer herd.
Animal Capture and Data Collection
-
Sample size: 82 adult female mule deer
-
Relocation frequency: Approximately 1−13 hours
-
Project duration: 2015−2020
-
Data Analysis
-
Corridor, stopover, and winter range analysis: Combination of BBMM (Sawyer and others, 2009) and Fixed Motion Variance (see appendix 1 for further description)
-
Delineation of migration periods: NSD (Bunnefeld and others, 2011)
-
Models derived from:
-
Migration: 167 sequences from 67 individuals (82 spring sequences, 85 fall sequences)
-
Winter: 111 sequences from 66 individuals
Corridor and Stopover Summary
Migration start and end dates (median):
Average number of days migrating: Migration corridor length: Migration corridor area:Other Information
Project contacts:
-
Heiko Wittmer (heiko.wittmer@vuw.ac.nz), School of Biological Sciences, Victoria University of Wellington
-
Christopher Wilmers (cwilmers@ucsc.edu), Center for Integrated Spatial Research, Environmental Studies Department, University of California
-
Julie Garcia (Julie.Garcia@wildlife.ca.gov), Deer Biologist, California Department of Fish and Wildlife
-
Wittmer, H.U., Cristescu, B., Spitz, D.B., Nisi, A., and Wilmers, C.C., 2021, Final report Siskiyou deer-mountain lion study (2015–2020): California Department of Fish and Wildlife, 71 p. [Also available at https://doi.org/10.13140/RG.2.2.31758.28480.]
Idaho | Mule Deer
Albion Mountains Mule Deer
Albion Mountains mule deer winter on the lower south- and west-facing aspects of the Albion Mountains (fig. 16). However, the majority of deer that summer in the Albion Mountains migrate east to the Albion and Jim Sage Mountains and, to a lesser extent, north to the Cotterel Mountains. In 2017, an estimated 4,000 mule deer wintered in the southern portions of the Albion and Jim Sage Mountains. The Albion Mountain range is a small, isolated mountain range surrounded by private agricultural land. The Cotterel Mountains and Jim Sage Mountains are other isolated ranges, separated by private agricultural valleys spanning a few miles between ranges. On average, the Albion Mountains mule deer migrate 15 mi (24 km) between their summer and winter habitats. There is low risk of conversion of private agricultural lands to habitat unsuitable for mule deer. Because many of these deer have to cross private lands to reach their winter range, it is important to maintain private land as agricultural so migrations are not inhibited.
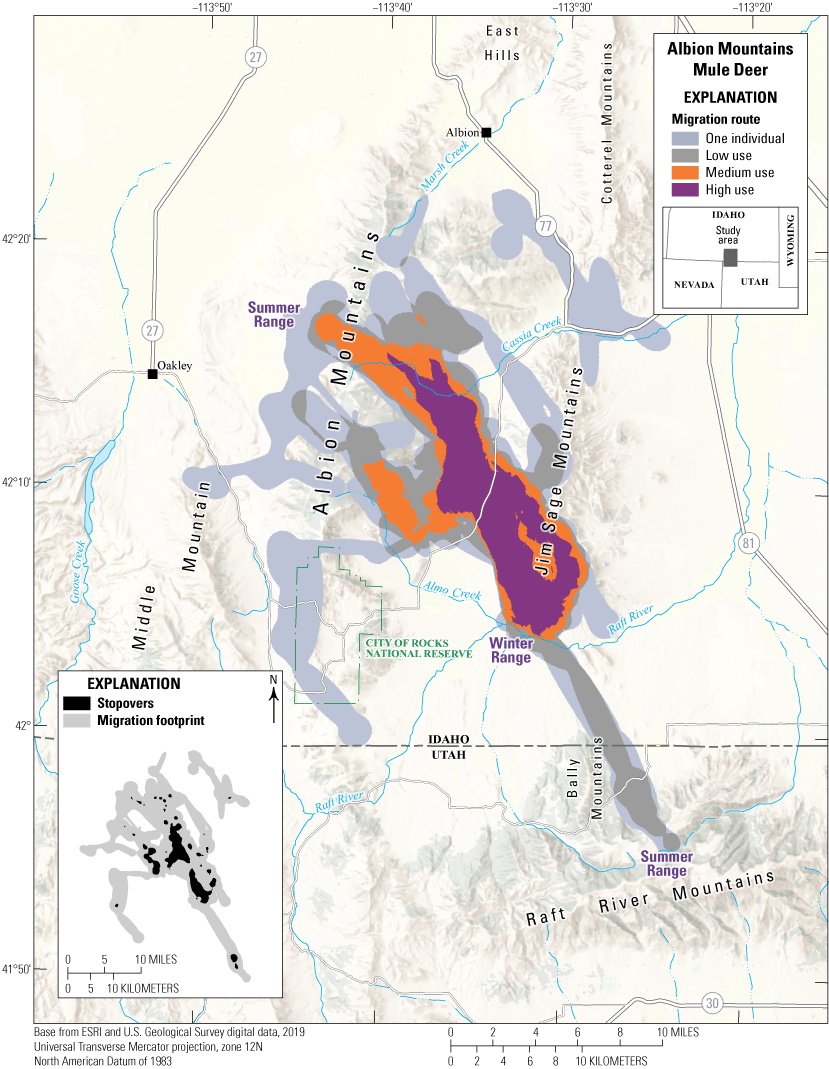
Migration routes and stopovers of the Albion Mountains mule deer herd.
Data Analysis
-
Migration and stopover analysis: of 85 individual seasonal migrations, 57 used Fixed Motion Variance (1,000 m [3,281 ft]; see appendix 1 for further description) with a 14-hour time lag; 28 used Fixed Motion Variance (1,000 m) [3,281 ft] with a 27-hour time lag.
-
Delineation of migration periods: NSD (Bunnefeld and others, 2011)
-
Models derived from:
-
Migration: 85 sequences from 32 individuals (55 spring sequences, 30 fall sequences)
Migration and Stopover Summary
Migration start and end date (median):
Average number of days migrating: Migration length: Migration area:Other Information
Project contacts:
-
Shane Roberts (shane.roberts@idfg.idaho.gov), Wildlife Research Supervisor, Idaho Department of Fish and Game
-
Mark Hurley (mark.hurley@idfg.idaho.gov), Principal Wildlife Research Biologist, Idaho Department of Fish and Game
-
Mike McDonald (mike.mcdonald@idfg.idaho.gov), Regional Wildlife Manager, Idaho Department of Fish and Game
-
Jake Powell (jake.powell@idfg.idaho.gov), Regional Wildlife Biologist, Idaho Department of Fish and Game
-
Sierra Robatcek (sierra.robatcek@idfg.idaho.gov), Regional Wildlife Biologist, Idaho Department of Fish and Game
-
Scott Bergen (scott.bergen@idfg.idaho.gov), Senior Wildlife Research Biologist, Idaho Department of Fish and Game
-
Jodi Berg, Senior Research Scientist, Wyoming Cooperative Fish and Wildlife Research Unit, University of Wyoming
-
Robert Ritson (robert.ritson@idfg.idaho.gov), Associate Research Scientist, Wyoming Cooperative Fish and Wildlife Research Unit, University of Wyoming
-
Hurley, M.A., and Roberts, S., 2020, F19AF00856 statewide wildlife research final performance report: Boise, Idaho, Idaho Department of Fish and Game, 62 p. [Also available at https://collaboration.idfg.idaho.gov/WildlifeTechnicalReports/F19AF00856%20Statewide%20Wildlife%20Research%20Final%20Report%20FY20.pdf.]
-
Meints, D., Ward, R., Knetter, J., Miyasaki, H., Oelrich, K., Mosby, C., Ellstrom, M., Roche, E., Elmer, M., Crea, S., Smith, D., Hribik, D., Hickey, C., Berkley, R., McDonald, M., Lockyer, Z., Hendricks, C., Painter, G., and Newman, D., 2020, F19AF00858 statewide surveys and inventory final performance report: Boise, Idaho, Idaho Department of Fish and Game, 20 p. [Also available at https://collaboration.idfg.idaho.gov/WildlifeTechnicalReports/F19AF00858%20Statewide%20Surveys%20%20Inventory%20Final%20Report%20FY20.pdf.]
Idaho | Mule Deer
North Hansel Mountains Mule Deer
North Hansel Mountains mule deer winter east of Stone, Idaho, along the border of Idaho and Utah (fig. 17). Recent aerial abundance surveys indicate that 1,600–2,200 mule deer winter here. Below-average winter snow depths result in deer dispersing throughout the North Hansel Mountains and the Pleasantview Hills to the north. In contrast, above-average snow depths force deer farther south into Utah. In the spring, deer migrate north−northeast and north−northwest into the Pleasantview Hills and Deep Creek Mountains, respectively. On average, these mule deer travel 27 mi (43 km) between their summer and winter ranges. Livestock fencing, wildfires, and the proliferation of exotic annual grasses all have the potential to negatively affect migration and seasonal habitats for this herd.
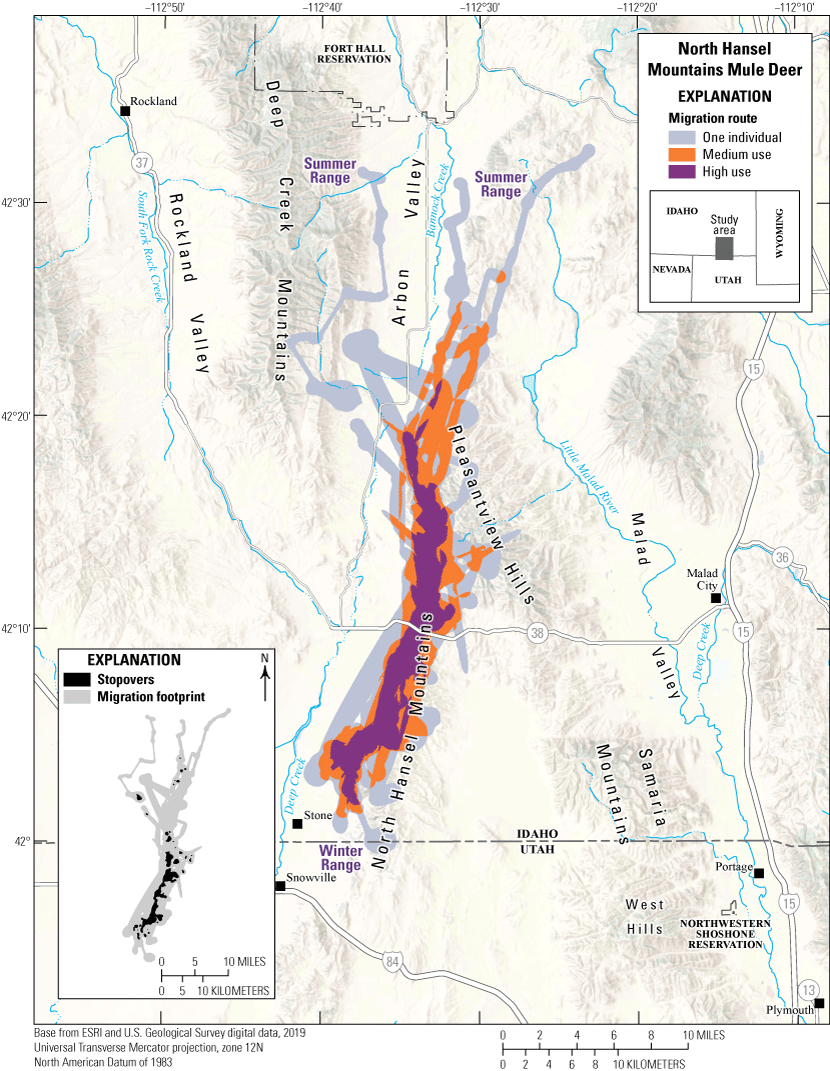
Migration routes of the North Hansel Mountains mule deer herd.
Data Analysis
-
Migration: of 22 individual seasonal migrations, 12 used BBMM (Sawyer and others, 2009) with an 8-hour time lag; 4 used Fixed Motion Variance (1,000 m [3,281 ft]; see appendix 1 for further description) with a 14-hour time lag; 6 used Fixed Motion Variance (1,000 m [3,281 ft]) with a 27-hour time lag.
-
Delineation of migration periods: NSD (Bunnefeld and others, 2011)
-
Models derived from:
-
Migration: 22 sequences from 16 individuals (18 spring sequences, 4 fall sequences)
Migration and Stopover Summary
Migration start and end dates (median):
Average number of days migrating: Migration length: Migration area:Other Information
Project contacts:
-
Shane Roberts (shane.roberts@idfg.idaho.gov), Wildlife Research Supervisor, Idaho Department of Fish and Game
-
Mark Hurley (mark.hurley@idfg.idaho.gov), Principal Wildlife Research Biologist, Idaho Department of Fish and Game
-
Zack Lockyer (zack.lockyer@idfg.idaho.gov), Region-l Wildlife Manager, Idaho Department of Fish and Game
-
Eric Freeman (eric.freeman@idfg.idaho.gov), Regional Wildlife Biologist, Idaho Department of Fish and Game
-
Scott Bergen (scott.bergen@idfg.idaho.gov), Senior Wildlife Research Biologist, Idaho Department of Fish and Game
-
Jodi Berg, Senior Research Scientist, Wyoming Cooperative Fish and Wildlife Research Unit, University of Wyoming
-
Robert Ritson (robert.ritson@idfg.idaho.gov), Associate Research Scientist, Wyoming Cooperative Fish and Wildlife Research Unit, University of Wyoming
-
Hurley, M.A., and Roberts, S., 2020, F19AF00856 statewide wildlife research final performance report: Boise, Idaho, Idaho Department of Fish and Game, 62 p. [Also available at https://collaboration.idfg.idaho.gov/WildlifeTechnicalReports/F19AF00856%20Statewide%20Wildlife%20Research%20Final%20Report%20FY20.pdf.]
-
Meints, D., Ward, R., Knetter, J., Miyasaki, H., Oelrich, K., Mosby, C., Ellstrom, M., Roche, E., Elmer, M., Crea, S., Smith, D., Hribik, D., Hickey, C., Berkley, R., McDonald, M., Lockyer, Z., Hendricks, C., Painter, G., and Newman, D., 2020, F19AF00858 statewide surveys and inventory final performance report: Boise, Idaho, Idaho Department of Fish and Game, 20 p. [Also available at https://collaboration.idfg.idaho.gov/WildlifeTechnicalReports/F19AF00858%20Statewide%20Surveys%20%20Inventory%20Final%20Report%20FY20.pdf.]
Idaho | Mule Deer
Sand Creek Mule Deer
Approximately 3,800 mule deer winter on the slightly rolling terrain surrounding Sand Creek (this area is regionally known as the Sand Creek Desert), located in GMU 60A (fig. 18). Human entry restrictions across much of the area during winter provide mule deer with undisturbed access to high-quality sage steppe habitats. The area primarily consists of sagebrush or bitterbrush overstory with grass and forb understory. In certain areas, these brush communities are interspersed with stands of juniper, Prunus virginiana (chokecherry), and other shrub species, which provide both cover and browse for mule deer. Pseudotsuga menziesii (Douglas fir) and Pinus contorta (lodgepole pine) communities become common throughout Big Bend Ridge as elevation increases to the north of the Sand Creek Desert. In the summer, Sand Creek mule deer largely disperse north and east into forested habitats (often east of U.S. Highway 20) to GMUs 60, 62, and 62A, with some individuals traveling to Wyoming. Two main challenges these mule deer face during migration include an extensive network of fencing and traffic on U.S. Highway 20.
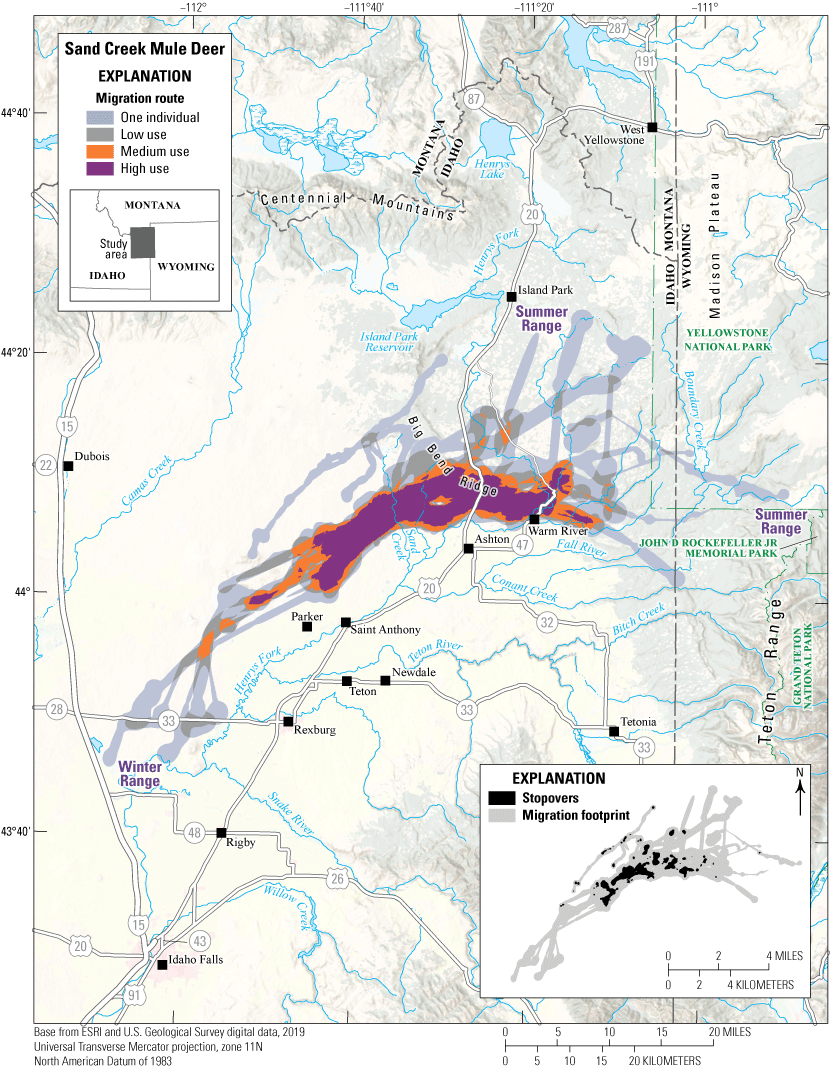
Migration routes and stopovers of the Sand Creek mule deer herd.
Data Analysis
-
Migration and stopover analysis: of 56 individual seasonal migrations, 9 used BBMM (Sawyer and others, 2009) with an 8-hour time lag; 9 used Fixed Motion Variance (1,000 m [3,281 ft]; see appendix 1 for further description) with a 14-hour time lag; 38 used Fixed Motion Variance (1,000 m [3,281 ft]) with a 27-hour time lag.
-
Delineation of migration periods: NSD (Bunnefeld and others, 2011)
-
Models derived from:
-
Migration: 56 sequences from 24 individuals (34 spring sequences, 22 fall sequences)
Migration and Stopover Summary
Migration start and end dates (median):
Average number of days migrating: Migration length: Migration area:Other Information
Project contacts:
-
Shane Roberts (shane.roberts@idfg.idaho.gov), Wildlife Research Supervisor, Idaho Department of Fish and Game
-
Mark Hurley (mark.hurley@idfg.idaho.gov), Principal Wildlife Research Biologist, Idaho Department of Fish and Game
-
Curtis Hendricks (curtis.hendricks@idfg.idaho.gov), Regional Wildlife Manager, Idaho Department of Fish and Game
-
Jacob Gray (jacob.gray@idfg.idaho.gov), Environmental Staff Biologist, Idaho Department of Fish and Game
-
Matt Pieron (matt.pieron@idfg.idaho.gov), Mule Deer Initiative Coordinator, Idaho Department of Fish and Game
-
Scott Bergen (scott.bergen@idfg.idaho.gov), Senior Wildlife Research Biologist, Idaho Department of Fish and Game
-
Jodi Berg, Senior Research Scientist, Wyoming Cooperative Fish and Wildlife Research Unit, University of Wyoming
-
Robert Ritson (robert.ritson@idfg.idaho.gov), Associate Research Scientist, Wyoming Cooperative Fish and Wildlife Research Unit, University of Wyoming
-
Hurley, M.A., and Roberts, S., 2020, F19AF00856 statewide wildlife research final performance report: Boise, Idaho, Idaho Department of Fish and Game, 62 p. [Also available at https://collaboration.idfg.idaho.gov/WildlifeTechnicalReports/F19AF00856%20Statewide%20Wildlife%20Research%20Final%20Report%20FY20.pdf.]
-
Meints, D., Ward, R., Knetter, J., Miyasaki, H., Oelrich, K., Mosby, C., Ellstrom, M., Roche, E., Elmer, M., Crea, S., Smith, D., Hribik, D., Hickey, C., Berkley, R., McDonald, M., Lockyer, Z., Hendricks, C., Painter, G., and Newman, D., 2020, F19AF00858 statewide surveys and inventory final performance report: Boise, Idaho, Idaho Department of Fish and Game, 20 p. [Also available at https://collaboration.idfg.idaho.gov/WildlifeTechnicalReports/F19AF00858%20Statewide%20Surveys%20%20Inventory%20Final%20Report%20FY20.pdf.]
Idaho | Mule Deer
South Hills Mountains Mule Deer
South Hills mule deer primarily winter on the northern end of the South Hill and spend the summer on national forest lands to the south-southeast (fig. 19). The lower south-facing slopes are generally free from significant snow, and an abundance of bitterbrush provides forage for more than 6,000 mule deer. The South Hill area is popular for off-road and all-terrain vehicle enthusiasts because of the extensive motorized-use trails and roads in the area. Some seasonal access restrictions protect mule deer on their winter range. On average, these mule deer migrate 20 mi (33 km) between their winter range and summer ranges in the higher elevations of the region. Several large wildfires have burned hundreds of thousands of acres in the South Hills in the last decade, affecting winter range distributions.
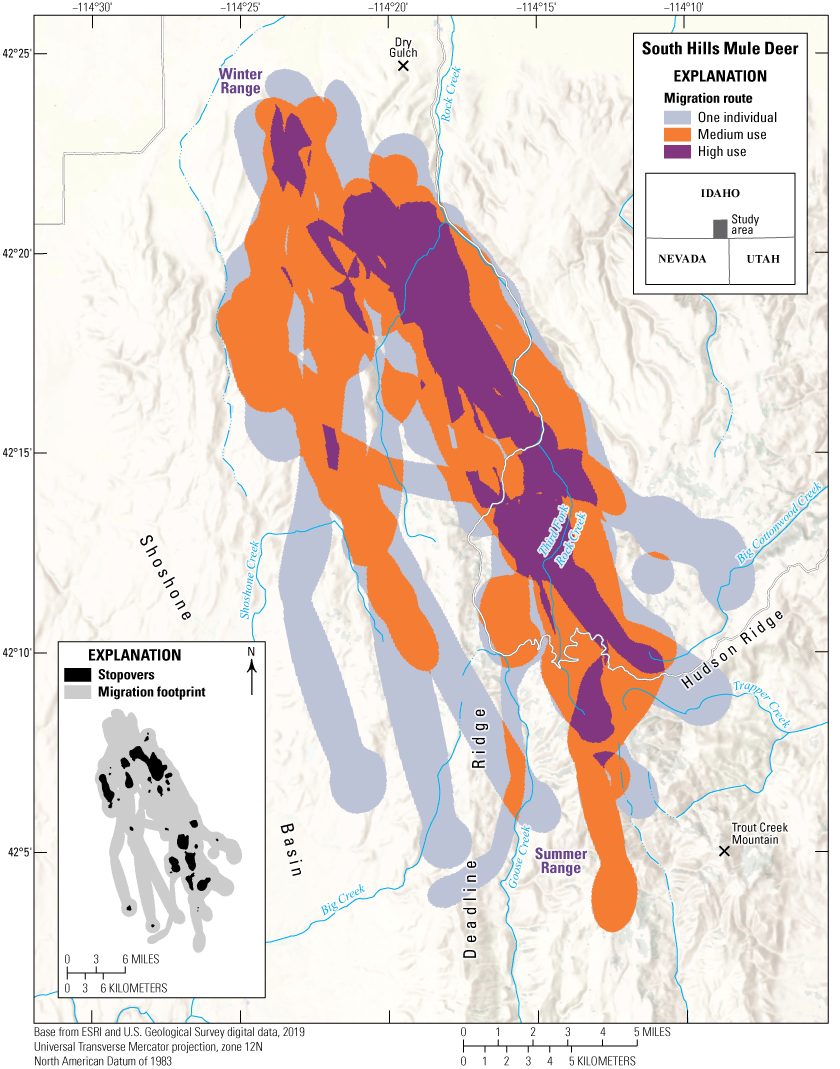
Migration routes and stopovers of the South Hills mule deer herd.
Animal Capture and Data Collection
-
Sample size: 18 adult female mule deer
-
Relocation frequency: Approximately 12.5–23.5 hours
-
Project duration: April 2015–December 2018
-
Data Analysis
-
Migration and stopover analysis: of 44 individual seasonal migrations, 32 used Fixed Motion Variance (1,000 m [3,281 ft]; see appendix 1 for further description) with a 14-hour time lag; 12 used Fixed Motion Variance (1,000 m [3,281 ft]) with a 27-hour time lag.
-
Delineation of migration periods: NSD (Bunnefeld and others, 2011)
-
Models derived from:
-
Migration: 44 sequences from 18 individuals (27 spring sequences, 17 fall sequences)
Migration and Stopover Summary
Migration start and end dates (median):
Average number of days migrating: Migration corridor length: Migration area:Other Information
Project contacts:
-
Shane Roberts (shane.roberts@idfg.idaho.gov), Wildlife Research Supervisor, Idaho Department of Fish and Game
-
Mark Hurley (mark.hurley@idfg.idaho.gov), Principal Wildlife Research Biologist, Idaho Department of Fish and Game
-
Mike McDonald (mike.mcdonald@idfg.idaho.gov), Regional Wildlife Manager, Idaho Department of Fish and Game
-
Jake Powell (jake.powell@idfg.idaho.gov), Regional Wildlife Biologist, Idaho Department of Fish and Game
-
Sierra Robatcek (sierra.robatcek@idfg.idaho.gov), Regional Wildlife Biologist, Idaho Department of Fish and Game
-
Scott Bergen (scott.bergen@idfg.idaho.gov), Senior Wildlife Research Biologist, Idaho Department of Fish and Game
-
Jodi Berg, Senior Research Scientist, Wyoming Cooperative Fish and Wildlife Research Unit, University of Wyoming
-
Robert Ritson (robert.ritson@idfg.idaho.gov), Associate Research Scientist, Wyoming Cooperative Fish and Wildlife Research Unit, University of Wyoming
-
Hurley, M.A., and Roberts, S., 2020, F19AF00856 statewide wildlife research final performance report: Boise, Idaho, Idaho Department of Fish and Game, 62 p. [Also available at https://collaboration.idfg.idaho.gov/WildlifeTechnicalReports/F19AF00856%20Statewide%20Wildlife%20Research%20Final%20Report%20FY20.pdf.]
-
Meints, D., Ward, R., Knetter, J., Miyasaki, H., Oelrich, K., Mosby, C., Ellstrom, M., Roche, E., Elmer, M., Crea, S., Smith, D., Hribik, D., Hickey, C., Berkley, R., McDonald, M., Lockyer, Z., Hendricks, C., Painter, G., and Newman, D., 2020, F19AF00858 statewide surveys and inventory final performance report: Boise, Idaho, Idaho Department of Fish and Game, 20 p. [Also available at https://collaboration.idfg.idaho.gov/WildlifeTechnicalReports/F19AF00858%20Statewide%20Surveys%20%20Inventory%20Final%20Report%20FY20.pdf.]
Idaho | Mule Deer
Stone Hills Mule Deer
Stone Hills mule deer winter west−southwest of Stone, Idaho, and north of Snowville, Utah, between Interstate 84 and Stone (fig. 20). Aerial abundance surveys in 2015 and 2022 documented more than 1,900 mule deer wintering in the Stone Hills. In the spring, these deer migrate north−northwest and north−northeast into the Sublett Range and Deep Creek Mountain, respectively. On average, these mule deer migrate 26 mi (42 km) between their summer and winter ranges. Prior to the construction of Interstate 84 in 1969, many deer from the summer range in the Sublett Range migrated to the winter range along the Black Pine Mountains; that migration no longer exists. Transportation infrastructure, wildfires, and the proliferation of non-native annual grasses negatively affect the winter and summer habitats for these deer.
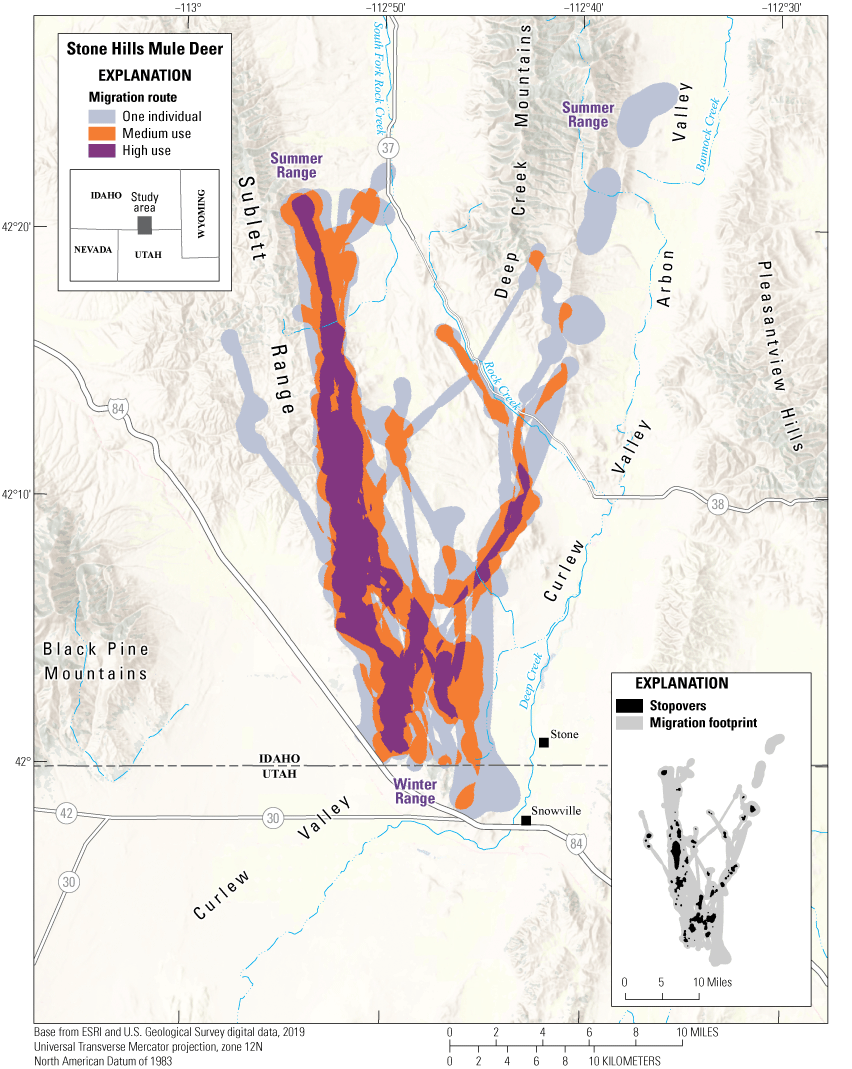
Migration routes of the Stone Hills mule deer herd.
Data Analysis
-
Migration analysis: of 31 individual seasonal migrations, 12 used BBMM (Sawyer and others, 2009) with an 8-hour time lag; 17 used Fixed Motion Variance (1,000 m [3,281 ft]; see appendix 1 for further description) with a 14-hour time lag; 2 used Fixed Motion Variance (1,000 m [3,281 ft]) with a 27-hour time lag.
-
Delineation of migration periods: NSD (Bunnefeld and others, 2011)
-
Models derived from:
-
Migration: 31 sequences from 19 individuals (23 spring sequences, 8 fall sequences)
Migration and Stopover Summary
Migration start and end dates (median):
Average number of days migrating: Migration length: Migration area:Other Information
Project contacts:
-
Shane Roberts (shane.roberts@idfg.idaho.gov), Wildlife Research Supervisor, Idaho Department of Fish and Game
-
Mark Hurley (mark.hurley@idfg.idaho.gov), Principal Wildlife Research Biologist, Idaho Department of Fish and Game
-
Zack Lockyer (zack.lockyer@idfg.idaho.gov), Regional Wildlife Manager, Idaho Department of Fish and Game
-
Mike McDonald (mike.mcdonald@idfg.idaho.gov), Regional Wildlife Manager, Idaho Department of Fish and Game
-
Jake Powell (jake.powell@idfg.idaho.gov), Regional Wildlife Biologist, Idaho Department of Fish and Game
-
Sierra Robatcek (sierra.robatcek@idfg.idaho.gov), Regional Wildlife Biologist, Idaho Department of Fish and Game
-
Scott Bergen (scott.bergen@idfg.idaho.gov), Senior Wildlife Research Biologist, Idaho Department of Fish and Game
-
Jodi Berg, Senior Research Scientist, Wyoming Cooperative Fish and Wildlife Research Unit, University of Wyoming
-
Robert Ritson (robert.ritson@idfg.idaho.gov), Associate Research Scientist, Wyoming Cooperative Fish and Wildlife Research Unit, University of Wyoming
-
Hurley, M.A., and Roberts, S., 2020, F19AF00856 statewide wildlife research final performance report: Boise, Idaho, Idaho Department of Fish and Game, 62 p. [Also available at https://collaboration.idfg.idaho.gov/WildlifeTechnicalReports/F19AF00856%20Statewide%20Wildlife%20Research%20Final%20Report%20FY20.pdf.]
-
Meints, D., Ward, R., Knetter, J., Miyasaki, H., Oelrich, K., Mosby, C., Ellstrom, M., Roche, E., Elmer, M., Crea, S., Smith, D., Hribik, D., Hickey, C., Berkley, R., McDonald, M., Lockyer, Z., Hendricks, C., Painter, G., and Newman, D., 2020, F19AF00858 statewide surveys and inventory final performance report: Boise, Idaho, Idaho Department of Fish and Game, 20 p. [Also available at https://collaboration.idfg.idaho.gov/WildlifeTechnicalReports/F19AF00858%20Statewide%20Surveys%20%20Inventory%20Final%20Report%20FY20.pdf.]
Navajo Nation | Mule Deer
Canyon de Chelly Mule Deer
The Canyon de Chelly population is one of several mule deer herds that winter in the foothills of the Chuska Mountains, a mountain range measuring 80 mi (129 km) long within the southeast Colorado Plateau in the Navajo Nation Reservation. The winter ranges and migration corridors of the Canyon de Chelly mule deer herd lie just 7 mi (11 km) south of the Ram Pasture herd but are separated geographically by Canyon del Muerto and Black Rock Canyon (fig. 21). These canyons are part of a larger canyon system known as the Canyon de Chelly National Monument. The Canyon de Chelly National Monument is one of four parks in the Federal park system comanaged with a Native American Tribe, though the United States government owns none of the parklands (National Park Service, 2021). Members of the Navajo Nation continue to live inside the Canyon de Chelly National Monument and the surrounding canyons where they maintain livestock (cattle and sheep) and grow crops. Although there are routes into the canyon and perennial streams throughout the bottom of the canyon, the collared mule deer spend most of their winter season on top of the canyon mesas. Windmills installed for livestock use by the Navajo Nation Department of Water Resources are an important source of water for mule deer during winter. During spring and fall migrations, the Canyon de Chelly herd’s migration corridors cross Indian Route 12, a busy rural highway along the Arizona and New Mexico border. Vehicular collisions, urban development, and overgrazing by livestock are the herd’s predominant challenges within this migration corridor. Because of the small sample of GPS-tagged mule deer, additional migration routes and winter range areas may exist beyond the extent of our model output.
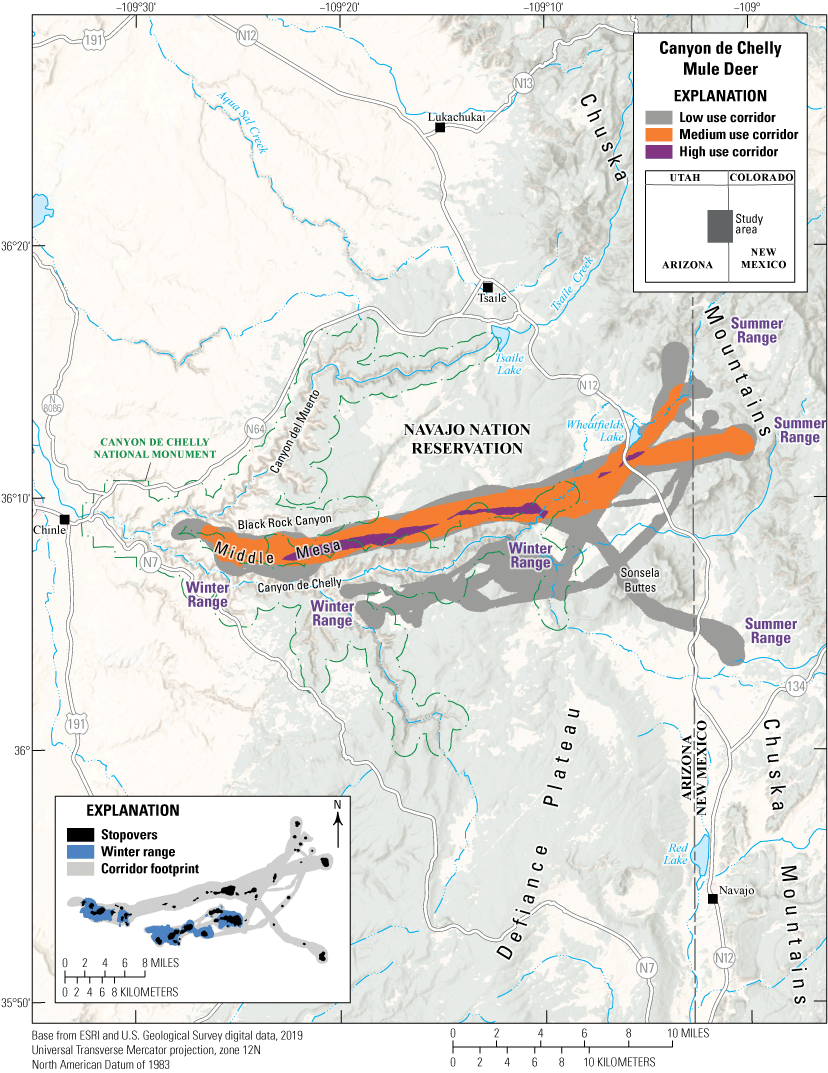
Migration corridors, stopovers, and winter ranges of the Canyon de Chelly mule deer herd.
Animal Capture and Data Collection
-
Sample size: 6 adult female mule deer
-
Relocation frequency: Approximately 1–4 hours
-
Project duration: 2018–present
-
Data Analysis
-
Stopover and winter range analysis: BBMM (Sawyer and others, 2009); corridor analysis used Fixed Motion Variance (see appendix 1 for further description)
-
Delineation of migration periods: NSD (Bunnefeld and others, 2011)
-
Models derived from:
-
Migration: 21 sequences from 6 individuals (11 spring sequences, 10 fall sequences)
-
Winter: 12 sequences from 6 individuals
Corridor and Stopover Summary
Migration start and end dates (median):
Average number of days migrating: Migration length: Migration corridor area:Navajo Nation | Mule Deer
Ram Pasture Mule Deer
The Ram Pasture population is one of several mule deer herds that winter in the foothills of the Chuska Mountains, a mountain range measuring 80 mi (129 km) long within the Navajo Nation Reservation (fig. 22). These mule deer winter in pinyon-juniper and sagebrush foothills, migrate east to higher elevations in the spring, and summer in habitats comprised of mixed-conifer, aspen, high alpine meadows, and ponderosa pine. Both winter and summer ranges remain entirely within Tribal trust lands managed by the Navajo Nation Department of Fish and Wildlife. Similar to the Canyon de Chelly mule deer herd, every spring and fall, the Ram Pasture herd must cross Indian Route 12, a busy rural highway along the Arizona and New Mexico border. Vehicular collisions are a continuous problem in these areas during migration seasons. Aerial surveys in 2020 estimated 1,583 mule deer as the minimum number known to be alive throughout the herd’s winter ranges in the Chuska Mountains. The limiting factors for this herd include low-quality habitat caused by overgrazing and resource competition with feral horses and unregulated livestock (Davies and Boyd, 2019; Wallace and others, 2021). Furthermore, extended drought and habitat fragmentation driven by urban development have accelerated the decline of habitat suitability (Redsteer and others, 2013; Nania and others, 2014).
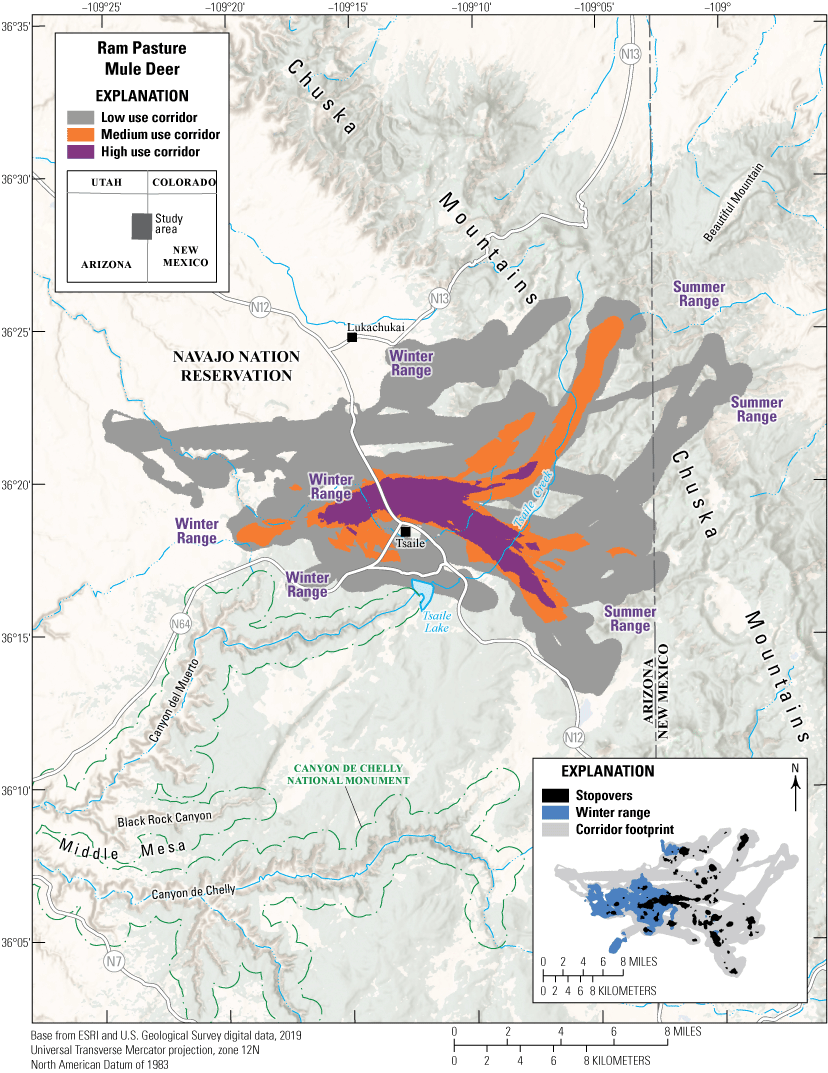
Migration corridors, stopovers, and winter ranges of the Ram Pasture mule deer herd.
Data Analysis
-
Stopover and winter range analysis: BBMM (Sawyer and others, 2009); corridor analysis used Fixed Motion Variance (see appendix 1 for further description)
-
Delineation of migration periods: NSD (Bunnefeld and others, 2011)
-
Models derived from:
-
Migration: 95 sequences from 32 individuals (57 spring sequences, 38 fall sequences)
-
Winter: 60 sequences from 30 individuals
Corridor and Stopover Summary
Migration start and end dates (median):
Average number of days migrating: Migration corridor length: Migration corridor area:New Mexico | Mule Deer
Crow Mesa Mule Deer
The Crow Mesa Mule Deer study was initiated in 2019 to identify the seasonal movements and distribution patterns of mule deer in the eastern half of GMU 2C. This GPS study builds on nearby studies of mule deer and elk conducted by the BLM, the Southern Ute Tribe, the Jicarilla Apache Nation, and the New Mexico Department of Fish and Game. Migration corridors extended 20–75 mi (32–110 km) from the winter ranges in GMU 2C to various summer ranges on national forest lands to the northeast near Dulce, and to the southeast near Cuba (fig. 23). The Crow Mesa herd relies largely on winter ranges administered by the BLM, where approximately 70 percent of the population remains year round (Sawyer, 2021). The other 30 percent of the herd migrates through and summers on an assortment of private, Tribal, and FS lands. Notably, all recorded mule deer migration corridors crossed Jicarilla Apache Nation Reservation immediately east of this herd’s winter range. Key management challenges with this deer herd include fence barriers, highway crossings, and habitat loss and human disturbance associated with energy development.
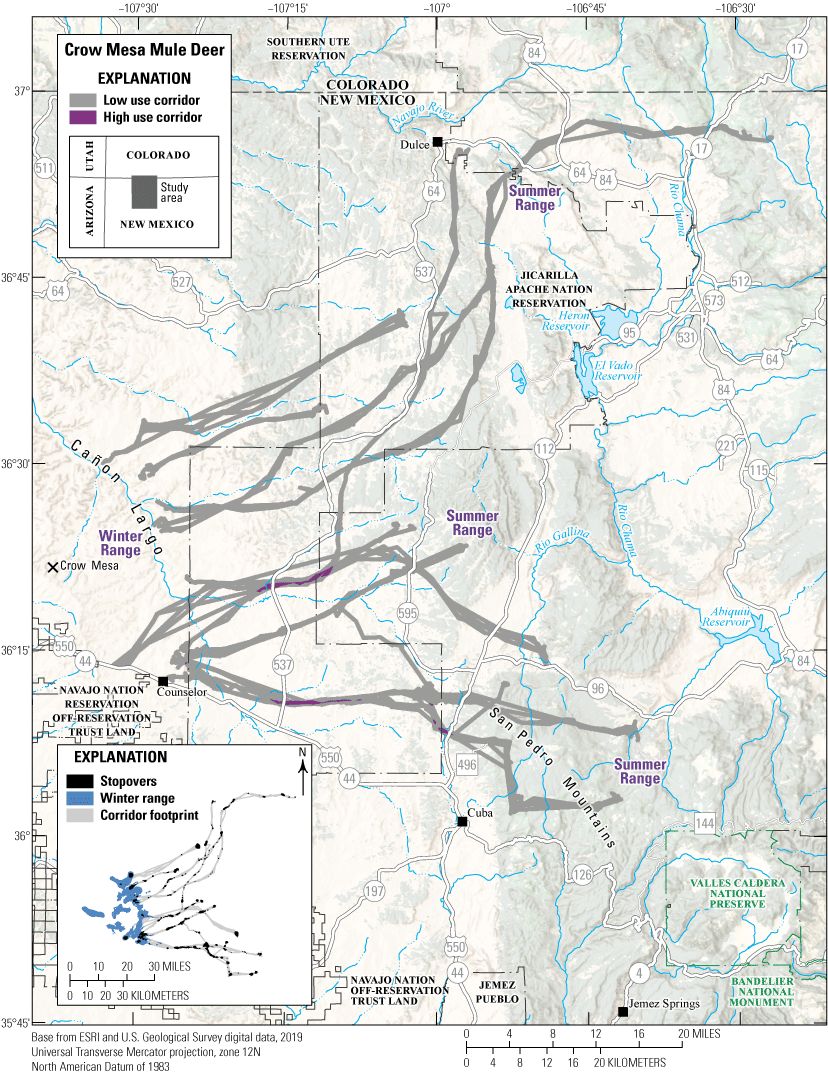
Migration corridors, stopovers, and winter ranges of the Crow Mesa mule deer herd.
Data Analysis
-
Stopover and winter range analysis: BBMM (Sawyer and others, 2009); corridor analysis used line buffer (300 m [984 ft]) method, where lines from migration sequences were buffered by 300 m (984 ft; see appendix 1 for further description)
-
Delineation of migration periods: NSD (Bunnefeld and others, 2011)
-
Models derived from:
-
Migration: 40 sequences from 12 individuals (23 spring sequences, 17 fall sequences)
-
Winter: 103 sequences from 42 individuals
Corridor and Stopover Summary
Migration start and end dates (median):
Average number of days migrating: Migration corridor length: Migration corridor area:Other Information
Project contacts:
-
John Sherman (Jssherma@blm.gov), State Wildlife Program Lead, Roswell Field Office, Bureau of Land Management
-
Hall Sawyer (hsawyer@west-inc.com), Research Biologist, Western Ecosystems Technology, Inc.
-
Orrin Duvuvuei (Orrin.Duvuvuei@dgf.nm.gov), Deer Program Manager, New Mexico Department of Game and Fish.
New Mexico | Mule Deer
Rio Chama Mule Deer
The Rio Chama mule deer herd has one of the highest-density populations of any herd in New Mexico. The herd migrates from north-central New Mexico along the Continental Divide and through the San Juan Mountains, with some individuals moving to summer ranges in southern Colorado (7,871–11,500 ft [2,399–3,505 m] elevation; fig. 24). These deer migrate through a mosaic of private, public, and Jicarilla Apache Nation Reservation lands. The herd winters south and east of Heron Reservoir and El Vado Reservoir in habitat consisting primarily of sagebrush steppe, grasslands, pinyon-juniper mesas, and oak woodlands. The mule deer use two primary migration corridors: One corridor follows the Rio Chama to the northeast and a shorter corridor heads east across U.S. Highways 84 and 64. The shorter corridor initially follows Rio de los Ojos before branching into separate corridors north and south of U.S. Highway 64. Interspersed agricultural lands along the Rio Chama and U.S. Highways 84 and 64 may serve as stopover sites for some mule deer during their spring migration. Ponderosa pine, mixed-conifer, and Populus tremuloides (quaking aspen) forests characterize the corridors and stopovers within mid-elevation landscapes. As the Rio Chama mule deer continue northeast, they travel through subalpine spruce-fir forests and montane meadows until reaching their high-elevation summer range, which consists of mixed-conifer and aspen forests. Challenges the herd faces include crossing U.S. Highways 84 and 64, increasing density of housing subdivisions in some areas along the routes, and fencing, especially taller fencing that mule deer cannot jump.
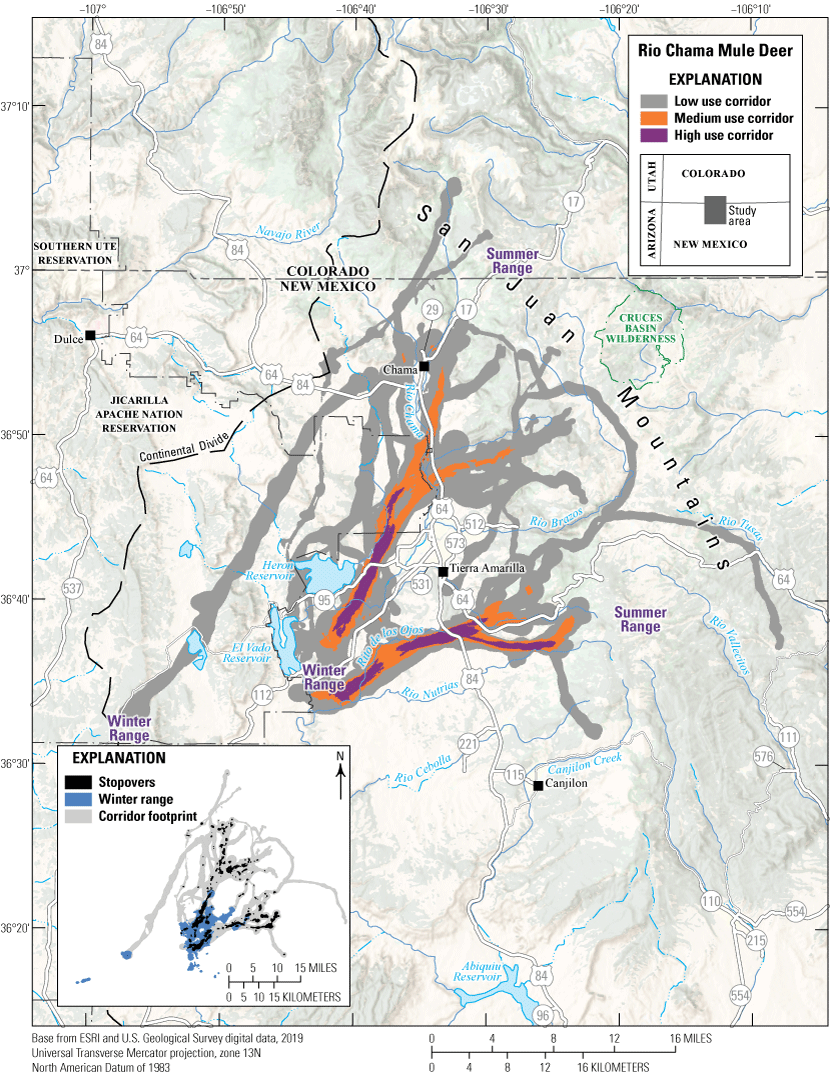
Migration corridors, stopovers, and winter ranges of the Rio Chama mule deer herd.
Data Analysis
-
Corridor, stopover, and winter range analysis: BBMM (Sawyer and others, 2009); corridor analysis also used Fixed Motion Variance (see appendix 1 for further description)
-
Delineation of migration periods: NSD (Bunnefeld and others, 2011)
-
Models derived from:
-
Migration: 160 sequences from 58 individuals (83 spring sequences, 77 fall sequences)
-
Winter: 116 sequences from 57 individuals
Corridor and Stopover Summary
Migration start and end dates (median):
Average number of days migrating: Migration corridor length: Migration corridor area:Utah | Mule Deer
Book Cliffs Mule Deer
Framed by Interstate 70 to the south, the Book Cliffs region is a barren, wild landscape of the Colorado Plateau and is critical to the survival of wildlife in Utah. The area begins in the northern desert shrub zone of the Uinta Basin and, to the south, rises gradually to aspen and fir zones in the Tavaputs Plateau, averaging 6,000 ft (1,829 m) elevation. The Book Cliffs mule deer herd uses the roadless backcountry terrain to migrate annually between their summer and winter ranges (fig. 25). The Book Cliffs mule deer are summer range limited, where habitat consists primarily of oak, sagebrush, Douglas fir, and Utah juniper vegetation types. Areas of high winter use by the Book Cliffs herd include open pinyon-juniper woodland and sagebrush (Karpowitz, 1984). Many economic activities occur within these habitats, such as oil and gas extraction and cattle grazing (U.S. Department of Agriculture, 2005; Utah Division of Wildlife Resources, 2020). The Utah Division of Wildlife Resources collaborates with partners and land management agencies that make up the patchwork of the Book Cliffs region to balance mule deer herd and human needs.
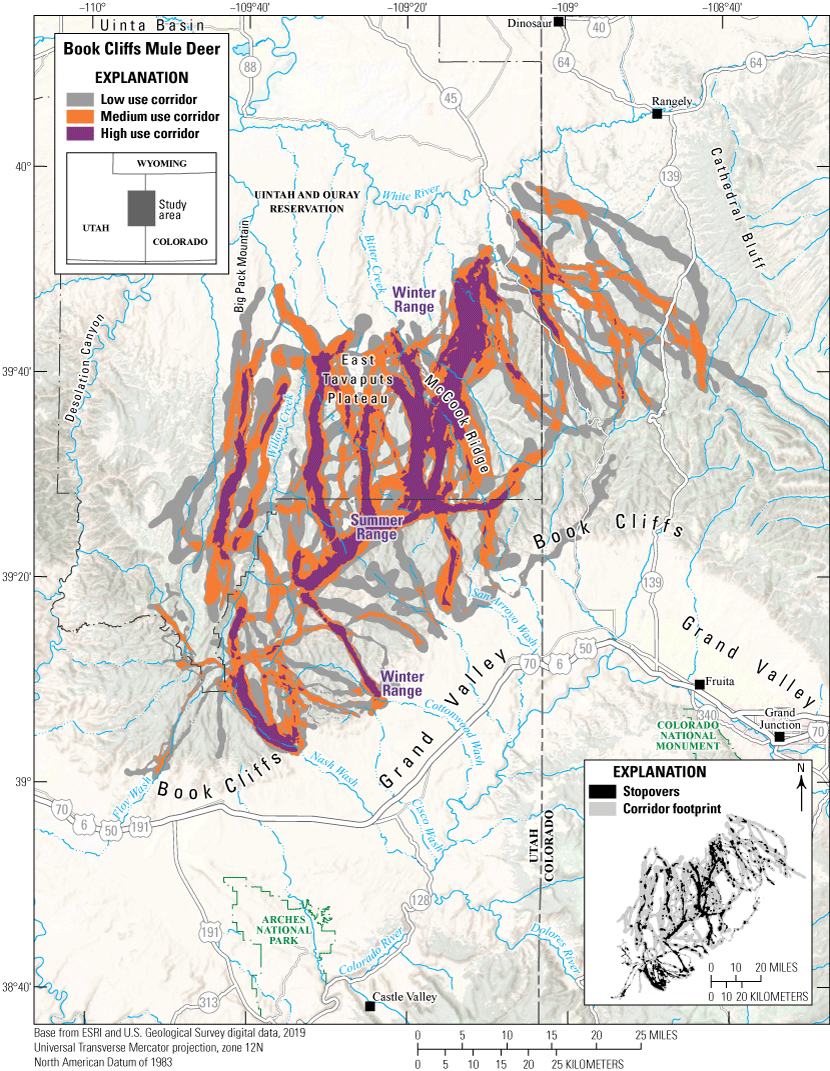
Migration corridors and stopovers of the Book Cliffs mule deer herd.
Data Analysis
-
Corridor and stopover analysis: BBMM (Sawyer and others, 2009); corridor analysis used Fixed Motion Variance (see appendix 1 for further description)
-
Delineation of migration periods: NSD (Bunnefeld and others, 2011)
-
Models derived from:
-
Migration: 246 sequences from 145 individuals (183 spring sequences, 63 fall sequences)
Utah | Mule Deer
Eagle Mountain Mule Deer
Eagle Mountain is located in central Utah on the northwest side of Utah Lake. In the early 1990s, the area was relatively undeveloped. Now, there are approximately 30,000 residents, and the population is projected to triple by 2040 (State of Utah, 2014). Prior to 2018, the Utah Division of Wildlife Resources had a small amount of data, which showed that mule deer migrated from winter ranges in the Lake Mountains to summering areas in the Oquirrh Mountains. The migration crosses State Route 73, which connects Eagle Mountain, Utah with the suburbs of Salt Lake City. In December 2018, 38 mule deer were captured and fitted with GPS tracking devices. Tracking data indicate that there are two major migration routes in the area (fig. 26): one eastern route and one western route. The western route crosses State Route 73 at Fivemile Pass in an area with substantial recreational use but not at risk for development. The eastern migration route passes through Eagle Mountain in an area that will probably be developed in the near future. The Utah Division of Wildlife Resources is working with Eagle Mountain, Utah Department of Transportation, BLM, the Mule Deer Foundation, and others to preserve migration corridors in response to the rapid changes occurring in the area.
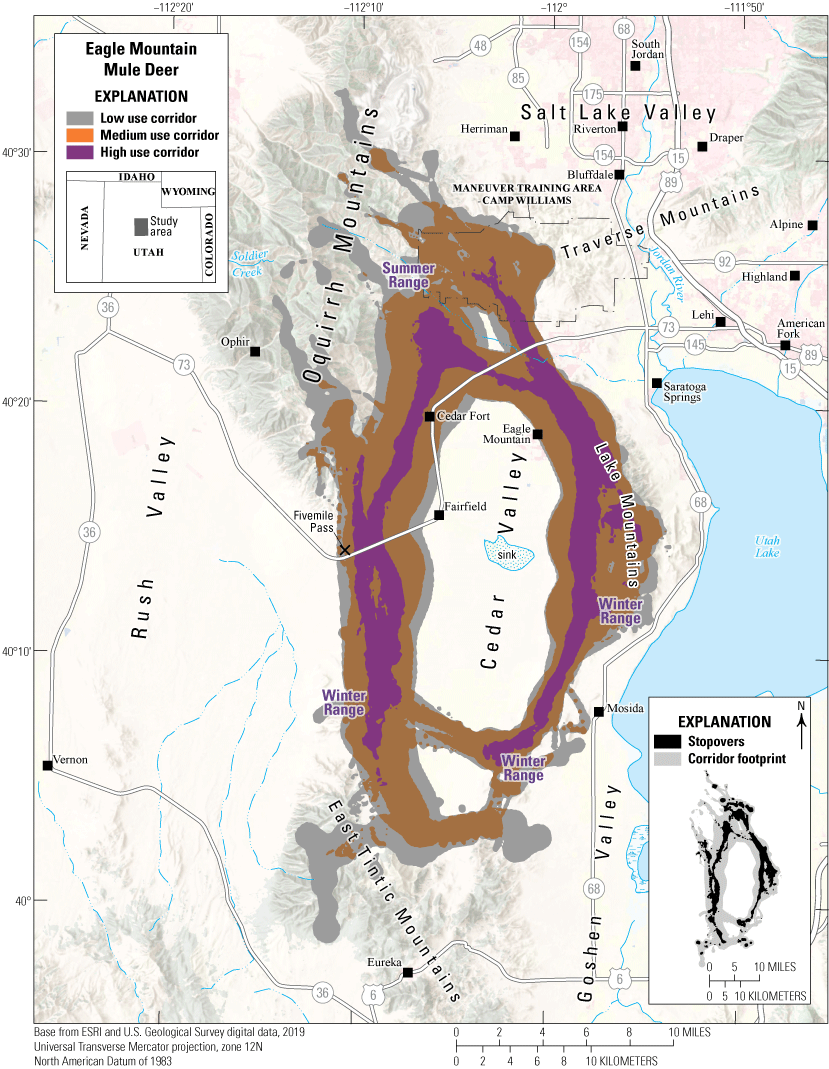
Migration corridors and stopovers of the Eagle Mountain mule deer herd.
Data Analysis
-
Corridor and stopover analysis: BBMM (Sawyer and others, 2009); corridor analysis used Fixed Motion Variance (see appendix 1 for further description)
-
Delineation of migration periods: NSD (Bunnefeld and others, 2011)
-
Models derived from:
-
Migration: 126 sequences from 40 individuals (82 spring sequences, 44 fall sequences)
Route Summary
Migration start and end dates (median):
Average number of days migrating: Migration corridor length: Migration corridor area:Utah | Mule Deer
Morgan-South Rich Mule Deer
The Morgan-South Rich herd is located in northern Utah, northeast of Park City, and is made up of nearly 10,000 mule deer (Bernales and others, 2020). From collaring efforts started in 2020, GPS tracking data indicate mule deer migrate from higher elevations in the Wasatch Range to the winter-range habitats on the north slopes of Weber River, Lost Creek, and Echo Canyon (fig. 27). A detached, smaller wintering area lies on the south-facing slopes above Cottonwood Creek. However, the available area of low-elevation winter habitat is severely limited. Mule deer heavily use the lower elevation habitat types of sagebrush and mountain browse, but in severe winters, browsing availability is greatly reduced (Utah Division of Wildlife Resources, 2017).
Traditional winter-range habitats are at high risk of habitat loss and degradation, threatened by increasing development and urbanization in Morgan Valley and Henefer areas (Utah Division of Wildlife Resources, 2017). In addition, highway mortality presents a significant concern in this migration corridor and winter range. Two major interstates, Interstates 80 and 84, form the southwest boundary of this population and pose a threat to its migratory and wintering mule deer. Cooperative efforts with the Utah Department of Transportation are underway to construct highway fences and wildlife warning signs to allow for safer crossing.
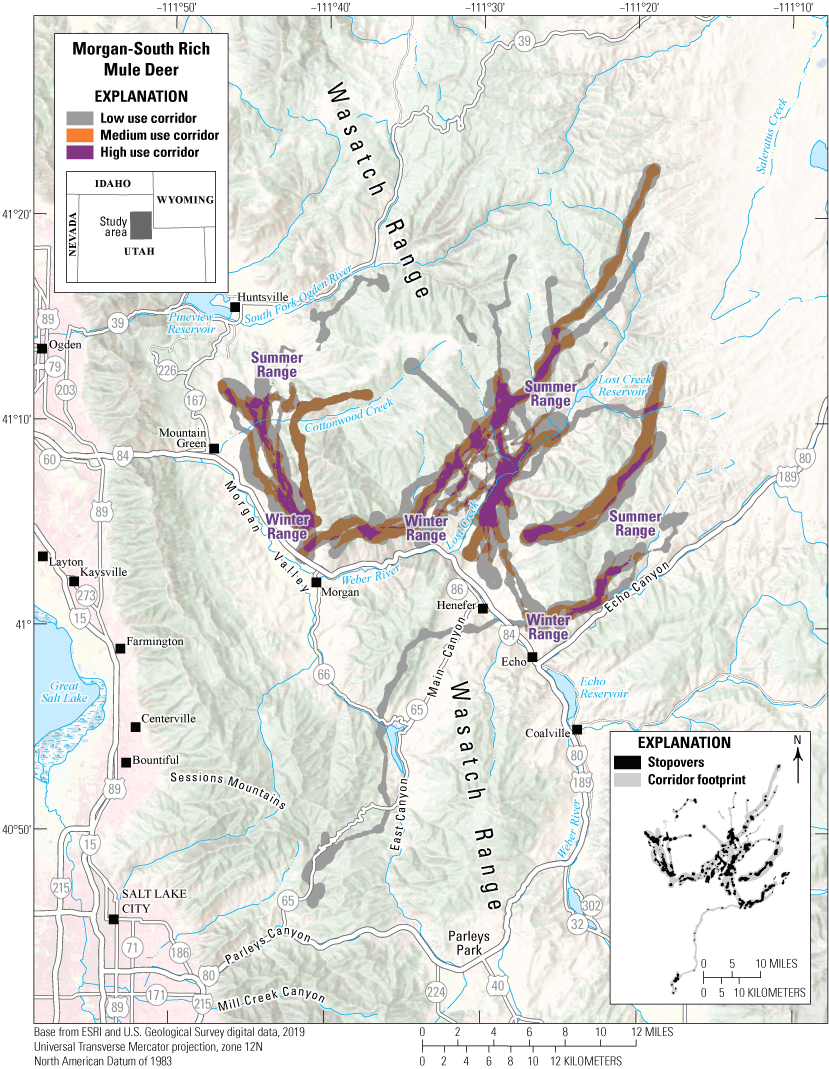
Migration corridors and stopovers of the Morgan-South Rich mule deer herd.
Data Analysis
-
Corridor and stopover analysis: BBMM (Sawyer and others, 2009); corridor analysis used Fixed Motion Variance (see appendix 1 for further description)
-
Delineation of migration periods: NSD (Bunnefeld and others, 2011)
-
Models derived from:
-
Migration: 42 sequences from 39 individuals (38 spring sequences, 4 fall sequences)
Route Summary
Migration start and end dates (median):
Average number of days migrating: Migration corridor length: Migration corridor area:Utah | Mule Deer
North Slope Mule Deer
Stretching across northeastern Utah along the Utah−Wyoming border and east to the Colorado state line, the North Slope herd is home to nearly 5,800 mule deer (Bernales and others, 2020). The peaks of the Uinta Mountains span the southern border of this region, with elevations ranging from 8,000 ft (2,438 m) to 13,000 ft (3,658 m), with hundreds of high alpine lakes scattered between the summits. The North Slope mule deer herd predominantly migrates east and west, traversing the northern perimeter of the Uinta Mountains and crossing the national forest lands (fig. 28). Beginning in 2018, 70 migratory mule deer have been tracked traveling short distances of almost 3 mi (5 km) to longer stretches of 73 mi (118 km). Seventeen of the GPS-tracked mule deer migrated from Utah into Wyoming or Colorado.
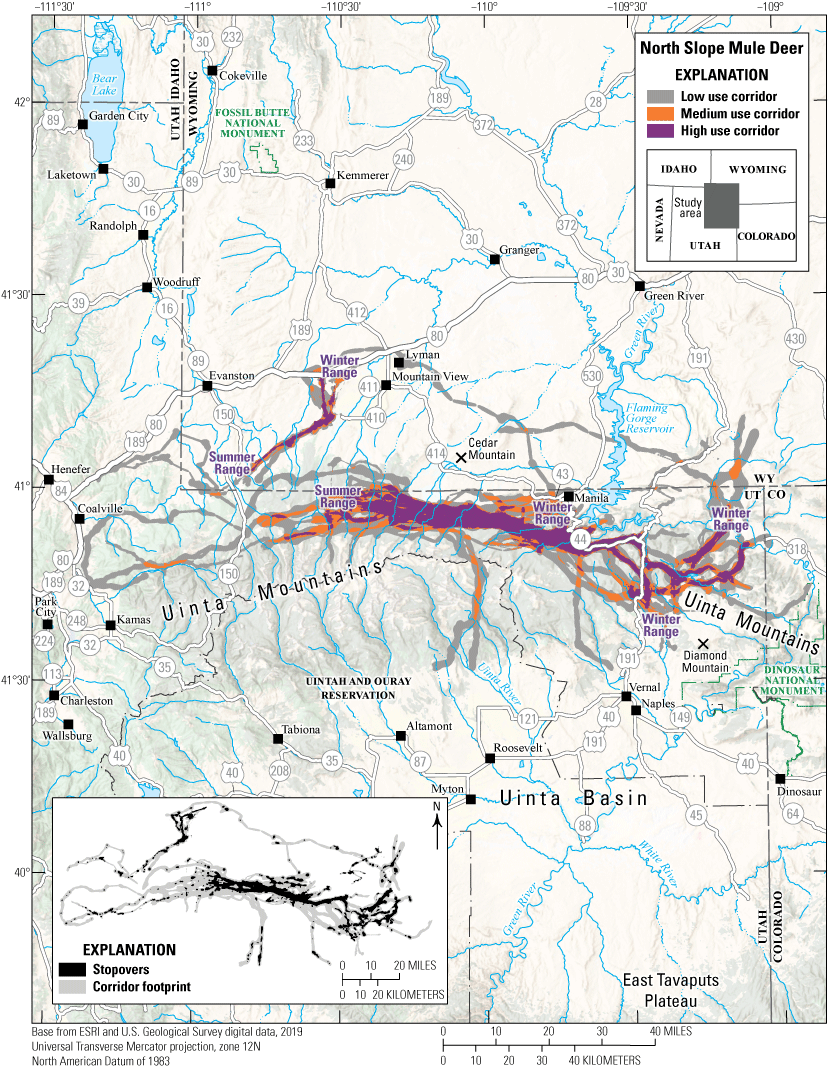
Migration corridors and stopovers of the North Slope mule deer herd.
Data Analysis
-
Corridor and stopover analysis: BBMM (Sawyer and others, 2009); corridor analysis used Fixed Motion Variance (see appendix 1 for further description)
-
Delineation of migration periods: NSD (Bunnefeld and others, 2011)
-
Models derived from:
-
Migration: 223 sequences from 70 individuals (112 spring sequences, 111 fall sequences)
Route Summary
Migration start and end dates (median):
Average number of days migrating: Migration corridor length: Migration corridor area:Utah | Mule Deer
San Juan Mule Deer
The San Juan mule deer reside in the southeast corner of Utah. The summer range for these mule deer occupies higher elevations in the Abajo Mountains, and a majority of the deer migrate to winter ranges at lower elevations in Alkali Point and Harts Draw areas (fig. 29). Habitat types in the summer range include conifer, aspen, alpine, and mountain shrubs. The herd’s winter-range habitats include sagebrush steppe, pinyon-juniper woodlands, and salt desert shrub that support valuable browse in mild to moderate winters (Utah Division of Wildlife Resources, 2015). Highway mortality is a significant concern in this migration corridor because the mule deer must traverse two major roads: U.S. Highway 191 and U.S. Route 491. The Utah Division of Wildlife Resources, Utah Department of Transportation, San Juan County, Sportsman for Fish and Wildlife, and others collaborated and determined priorities for reducing WVC along these stretches of highway. As a result, six wildlife crossing structures and approximately 7 mi (11 km) of highway fencing have been constructed on U.S. Highway 191 near Monticello, Utah, allowing for safer wildlife crossings.
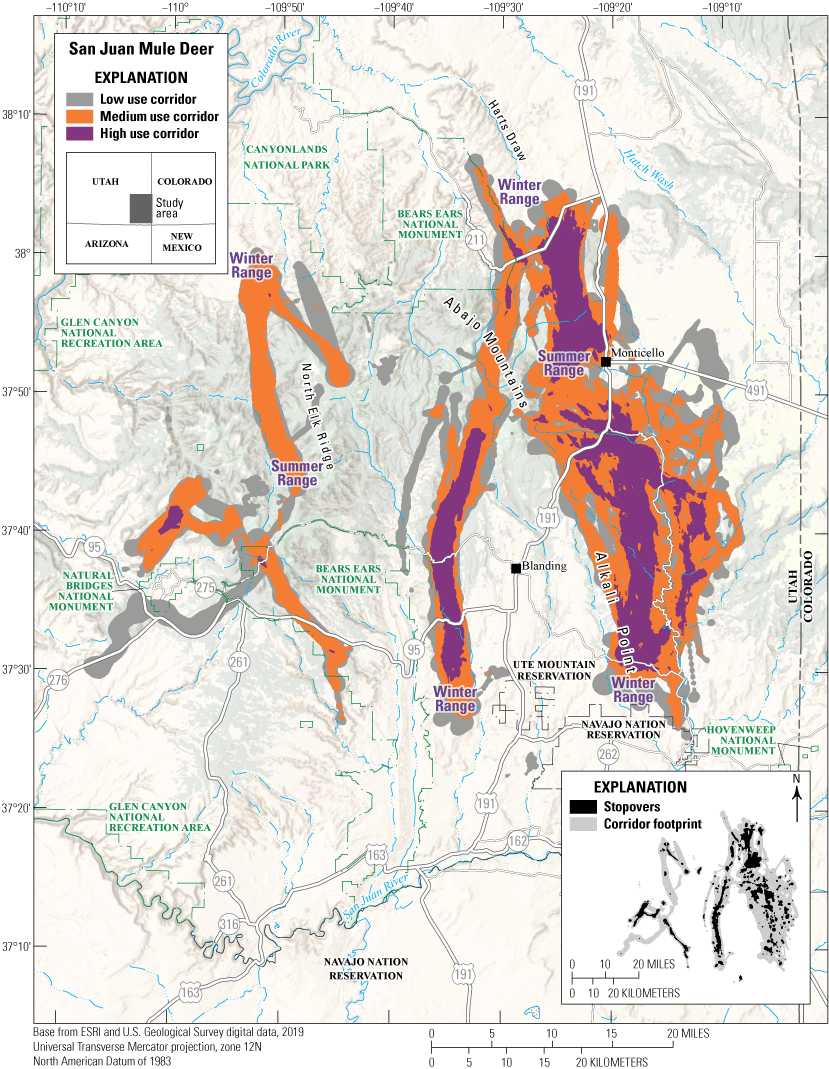
Migration corridors and stopovers of the San Juan mule deer herd.
Data Analysis
-
Corridor and stopover analysis: BBMM (Sawyer and others, 2009); corridor analysis used Fixed Motion Variance (see appendix 1 for further description)
-
Delineation of migration periods: NSD (Bunnefeld and others, 2011)
-
Models derived from:
-
Migration: 465 sequences from 139 individuals (245 spring sequences, 220 fall sequences)
Washington | Mule Deer
Chelan Mule Deer
The Chelan mule deer herd occupies a mix of private and public lands from the Columbia River to the crest of the Cascade Range in central Washington. U.S. Highway 2, northwest of Wenatchee, Washington, serves as the southern boundary for this herd, and Lake Chelan bounds the northern edge. The high-use winter range includes the southeastern shore of Lake Chelan, the breaks of the Columbia River, the lower Entiat River drainage, and the foothills east of Cashmere, Washington. In the spring, migratory individuals travel northwest into the Entiat and Chelan Mountains to their summer ranges in regional wilderness areas. A small sample of Chelan mule deer was captured near the Swakane Wildlife Area in January 2020 (n = 19 adult females). Thus far, most captured individuals have been migratory, although some individuals reside year round in the foothills east of Cashmere and along the Columbia River (fig. 30). On the winter range, residential development and disturbance from human recreation continue to be a concern. Semipermeable barriers to migration include U.S. Highway 97A, which overlaps the winter range along the Columbia River, and U.S. Highway 2, which bisects several individual migration routes.
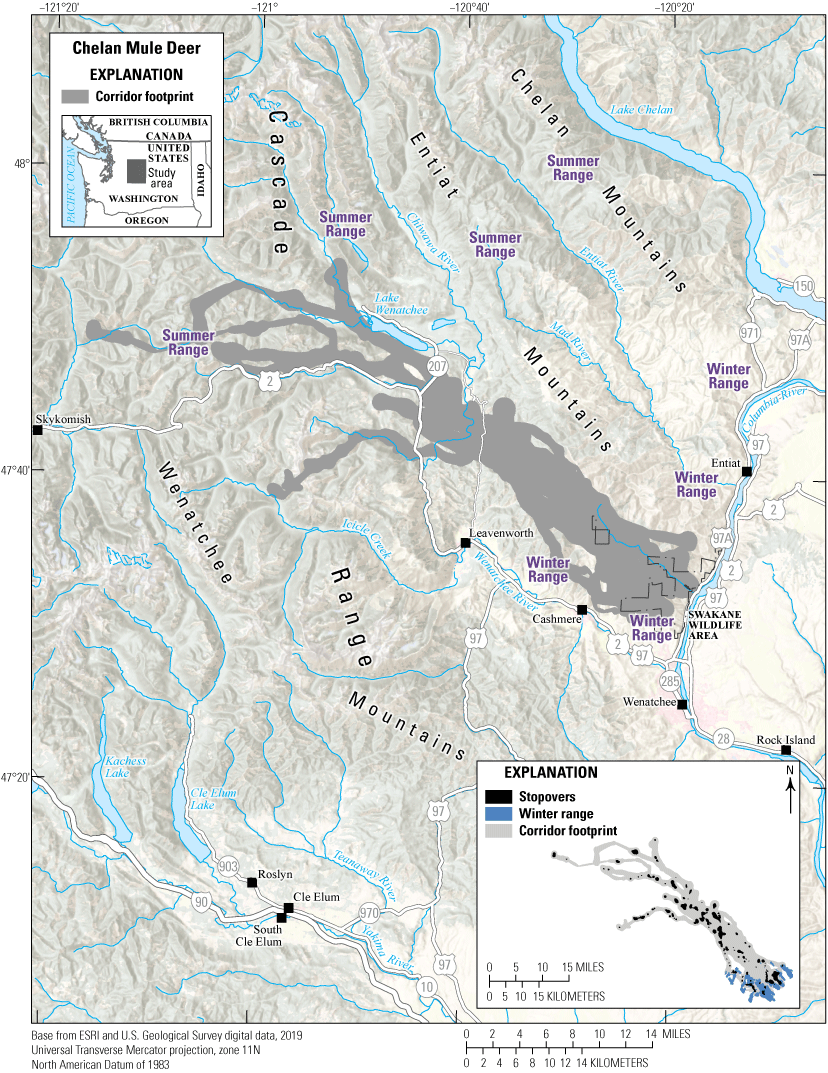
Migration corridor footprints, stopovers, and winter ranges of the Chelan mule deer herd.
Data Analysis
-
Corridor, stopover, and winter range analysis: BBMM (Sawyer and others, 2009)
-
Delineation of migration periods: NSD (Bunnefeld and others, 2011)
-
Models derived from:
-
Migration: 40 sequences from 11 individuals (21 spring sequences, 19 fall sequences)
-
Winter: 35 sequences from 19 individuals
Corridor and Stopover Summary
Migration start and end dates (median):
Average number of days migrating: Migration corridor length: Migration corridor area:Washington | Mule Deer
Wenatchee Mountains Mule Deer
Along the eastern slope of the Cascade Range in Chelan and Kittitas Counties, the Wenatchee Mountains mule deer herd inhabits a matrix of private and public lands. Historically, the Wenatchee Mountains mule deer were separated into two subherds, Chelan and Kittitas; however, recent movement data from GPS-collared individuals associated with SO 3362 (U.S. Department of the Interior, 2018) revealed that the mule deer south of U.S. Highway 2 and north of Interstate 90 represent one population. Their high-use winter range extends along the foothills west and south of Wenatchee, Washington, and throughout the foothills of the Kittitas Valley outside Ellensburg, Washington. Their low-use winter range occurs along the foothills west of the Columbia River just north of Interstate 90. In the spring, migratory individuals travel west into the Wenatchee Mountains to their summer range, which includes regional wilderness areas (fig. 31).
The Wenatchee Mountains mule deer are partially migratory; a high proportion of migratory individuals occupy the northern winter range of the Wenatchee Mountains, and nonmigratory individuals more commonly inhabit the foothills of the Kittitas Valley. The increasing frequency of large-scale wildfires and residential developments continue to degrade and reduce available winter range. Disturbance from human recreation on the winter range continues to be a concern. Semipermeable barriers to spring and fall migration include U.S. Highway 97 and State Route 970, as both experience relatively high volumes of traffic in the region.
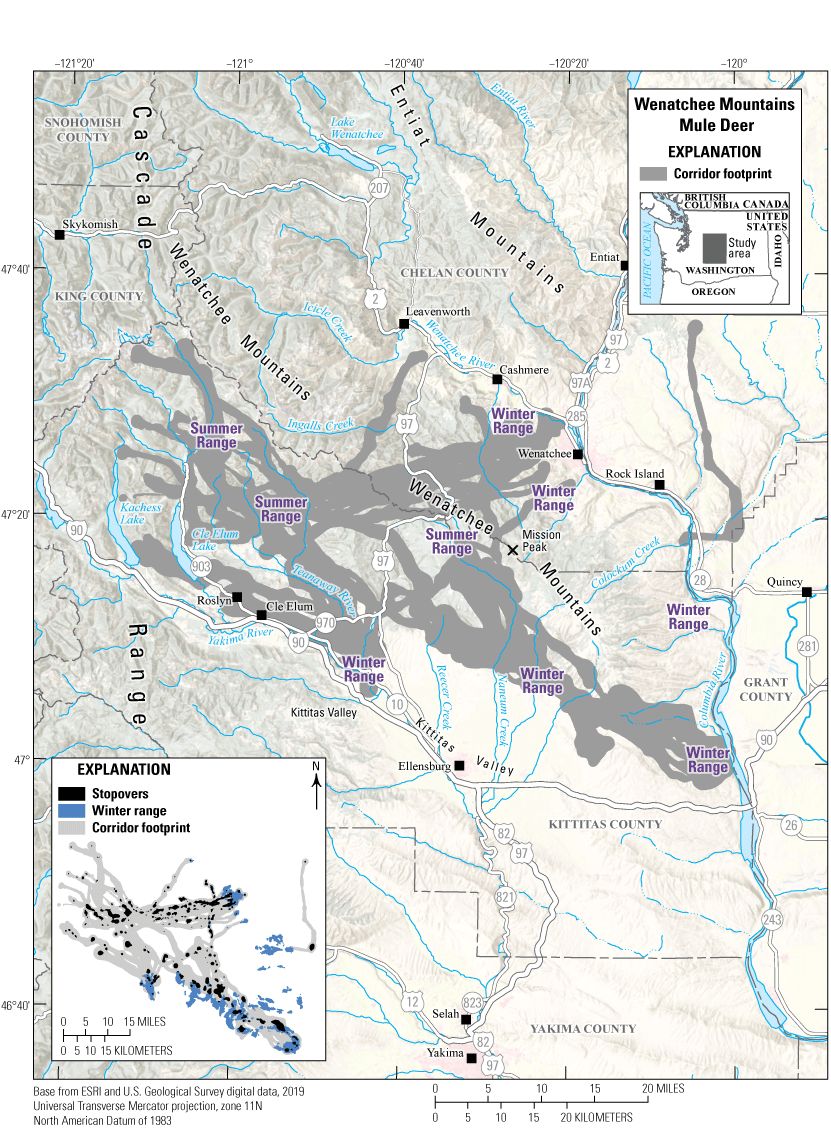
Migration corridors, stopovers, and winter ranges of the Wenatchee Mountains mule deer herd.
Data Analysis
-
Corridor, stopover, and winter range analysis: BBMM (Sawyer and others, 2009)
-
Delineation of migration periods: NSD (Bunnefeld and others, 2011)
-
Models derived from:
-
Migration: 107 sequences from 38 individuals (59 spring sequences, 48 fall sequences)
-
Winter: 146 sequences from 92 individuals
Corridor and Stopover Summary
Migration start and end dates (median):
Average number of days migrating: Migration corridor length: Migration corridor area:Wyoming | Mule Deer
Jackson Mule Deer
Mule deer within the Jackson segment of the Sublette herd (fig. 32) winter mainly in the valley and south-facing slopes of the buttes. These geologic features are characteristic of the Jackson Hole area near Jackson, Wyoming. Winter ranges in the Jackson valley are a mixture of national forest public land as well as private urban and exurban land. The lower elevation, south-facing hillslopes are typified by stands of Juniperus scopulorum (Rocky Mountain juniper) or mixed mountain shrub communities of Artemisia tridentata (mountain big sagebrush), Artemisia tripartite (three-tip sagebrush), Purshia tridentata (antelope bitterbrush), Amelanchier alnifolia (Saskatoon serviceberry), Symphoricarpos albus (common snowberry), chokecherry, and various grasses and forbs. North-facing slopes are characterized by a mixture of Douglas fir and quaking aspen.
Half of the individuals originally marked in this study were migratory, while the other half were residents. Resident animals in this herd segment often rely on ornamental landscaping and other human food sources. During migration, animals tracked with GPS collars (n = 19 females) traveled an average one-way distance of nearly 6 mi (10 km), with some animals migrating more than 17 mi (27 km). This herd segment, which approximates a few hundred, has a variety of summer destinations. Most individuals migrate northwest into Grand Teton National Park and the southern Teton Range. Some individuals migrate west and southwest near Munger Mountain. A few mule deer migrate short distances to the hills near Hoback Junction. Summer ranges in higher elevations transition to stands of lodgepole pine, Pinus flexilis (limber pine), Abies lasiocarpa (subalpine fir), and Picea engelmannii (Engelmann spruce) interspersed with aspen, subalpine meadows, and tall forbs. Willows, Shepherdia canadensis (russet buffaloberry), Elaeagnus commutate (silverberry), Picea pungens (blue spruce), Populus balsamifera (balsam poplar), and Populus angustifolia (narrowleaf cottonwood) dominate the riparian habitats in this area. Roadways bisect much of the winter range of this herd segment, causing some animals to make daily movements across roads during the winter. Teton County contains one of the highest rates of WVC per mile of road in Wyoming, and road mortality significantly affects this population, especially during severe winters.
Since 2017, the Wyoming Department of Transportation has worked on several road improvements, including multiple wildlife underpasses and fencing on U.S. Highway 89, because of rising traffic volumes in the area (Kampschror, 2017). There are also plans for building future wildlife crossing structures on U.S. Highway 22 west of Jackson. Increasing residential, recreational, and urban development in Teton County has encroached on mule deer winter ranges and migration routes. Future development of historically open agricultural lands along migration routes is a concern. Managers are also concerned about rapidly growing pressures from human recreation and annual invasive grasses on public lands in important mule deer winter and summer ranges.
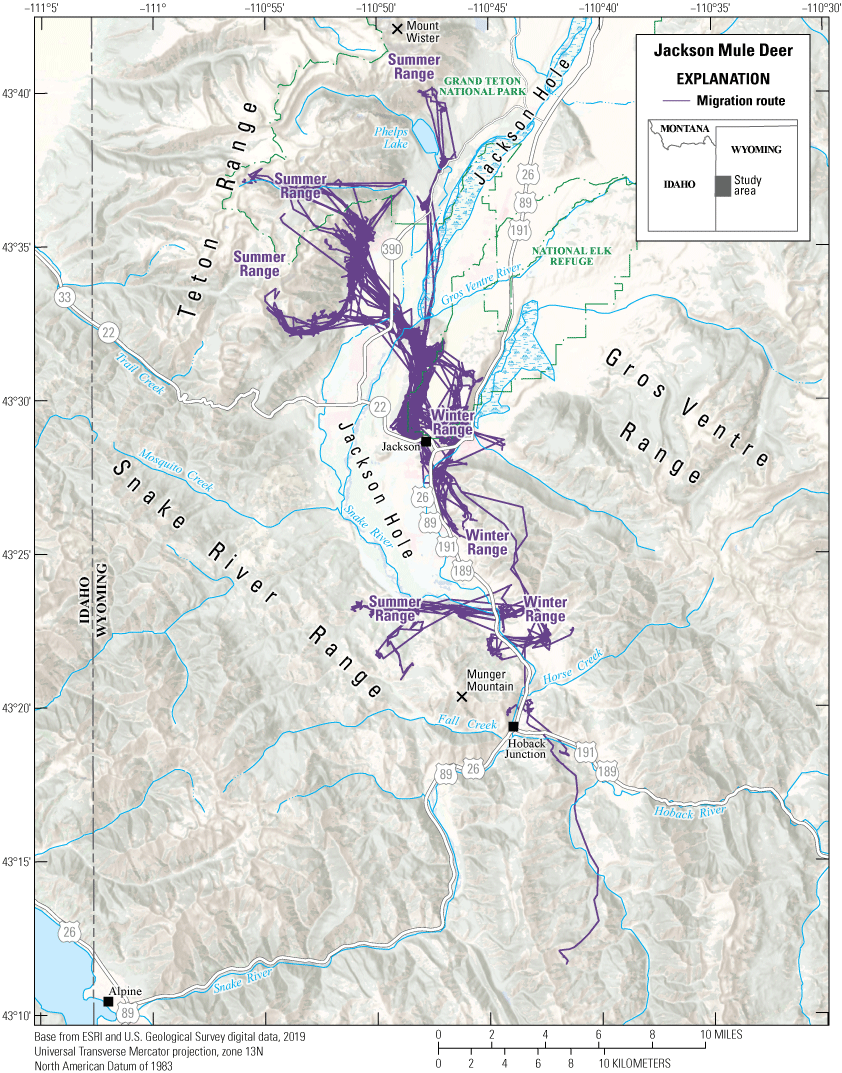
Migration routes of the Jackson mule deer herd.
Data Analysis
-
Delineation of migration periods based on plots of NSD (Bunnefeld and others, 2011) next to maps of individual trajectories by year
-
Models derived from:
-
Migration: 55 sequences from 19 individuals (31 spring sequences, 24 fall sequences)
Corridor and Stopover Summary
Migration start and end dates (median):
Average number of days migrating: Migration corridor length:Other Information
Project contacts:
-
Corinna Riginos (corinna.riginos@tnc.org), Director of Science, The Nature Conservancy Wyoming Field Office
-
Embere Hall (embere.hall@wyo.gov), Science, Research and Analytical Support Section Supervisor, Wyoming Game and Fish Department
-
Morgan Graham (morgan@tetonconservation.org), Spatial Data Management, Analysis, and Mapping. GIS and Wildlife Specialist, Teton Conservation District
-
Kevin Krasnow (kevin.krasnow@tetonscience.org), Graduate Faculty and Research Specialist, Graduate Program of Teton Science Schools
-
Riginos, C., Krasnow, K., Hall, E., Graham, M., Sundaresan, S., Brimeyer, D., Fralick, G., and Wachob, D., 2013, Mule deer (Odocoileus hemionus) movement and habitat use patterns in relation to roadways in northwest Wyoming: Jackson, Wyo., Conservation Research Center, Teton Science Schools, 72 p. [Also available at http://www.corinnariginos.com/resources/MD_Final_Report_RS03210.pdf.]
Wyoming | Mule Deer
South Rock Springs Mule Deer
The South Rock Springs mule deer herd lives year round in the Greater Little Mountain Ecosystem in southwestern Wyoming, an arid landscape where desert badlands give way to aspen and mountain shrub communities at higher elevations. Approximately 4,000 mule deer occupy this landscape, which is one of the least developed in Wyoming. Likely owing to its aridity and lack of strong elevational gradients and high mountains, mule deer migrations in this herd are less pronounced and less structured than elsewhere in Wyoming. Instead of all animals congregating in a common winter range and following a shared narrow corridor to their summer range, mule deer in this herd migrate diversely. Some animals winter near Flaming Gorge Reservoir and then head east into the forested habitat of Little Mountain, while other animals winter farther east and migrate in all directions (fig. 33). Migrations tend to be relatively short for mule deer, averaging 10 mi (17 km). A few animals make longer movements south into Utah. The herd is threatened by competition from a growing elk population and ongoing risk of oil and gas development, which would fragment this otherwise intact landscape.
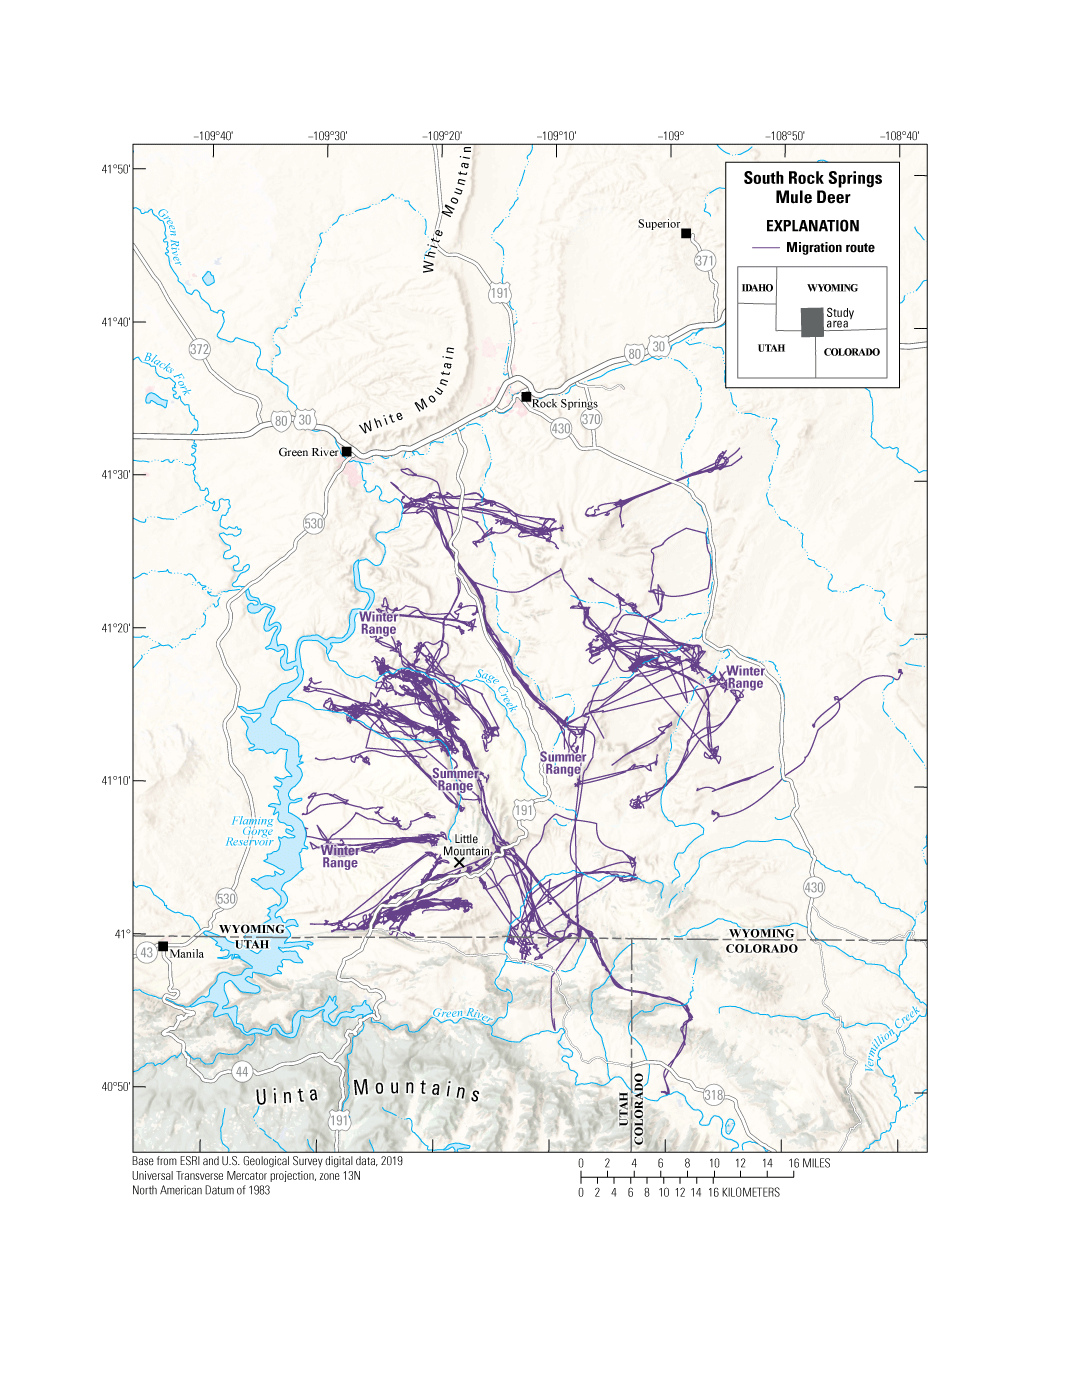
Migration routes of the South Rock Springs mule deer herd.
Data Analysis
-
Delineation of migration periods: NSD (Bunnefeld and others, 2011)
-
Models derived from:
-
Migration: 135 sequences from 62 individuals (86 spring sequences, 49 fall sequences)
-
Winter: 99 sequences from 66 individuals
Corridor and Stopover Summary
Migration start and end dates (median):
Average number of days migrating: Migration corridor length:Other Information
Project contacts:
-
Kevin Monteith (kevin.monteith@uwyo.edu), Associate Professor, University of Wyoming
-
Sean Yancey (sean.yancey@wyo.gov), Regional Wildlife Coordinator, Wyoming Game and Fish Department
-
Huggler, K., 2019, Eye for an eye—Predator-prey dynamics from the lens of both predator and prey: Laramie, Wyo., University of Wyoming, M.S. thesis, p. 1–102.
-
Huggler, K.S., Holbrook, J.D., Burke, P.W., Zornes, M., Thompson, D.J., Clapp, J.G., Lionberger, P., Valdez, M., and Monteith, K.L, 2022, Risky business—How a herbivore navigates spatiotemporal aspects of risk from competitors and predators: Ecological Applications, e2648, 17 p. [Also available at http://doi.org/10.1002/eap.2648.]
Washington | White-Tailed Deer
Selkirk White-Tailed Deer
The Selkirk White-Tailed Deer Management Zone (WDMZ) is home to the largest population of white-tailed deer in Washington and consists of seven GMUs (105, 108, 111, 113, 117, 121, and 124) located in northeastern Washington. Aside from the southern portion of GMU 124, which is dominated by the metropolitan area of Spokane, Washington, most of these GMUs have similar rural characteristics. Private landowners manage most of the Selkirk WDMZ (77 percent) and use it primarily for commercial timber harvest. The FS manages 16 percent of the land, and the U.S. Fish and Wildlife Service, Department of Natural Resources, and BLM manage the remaining 7 percent. White-tailed deer used in this analysis were captured on their winter range in GMUs 117 and 121 (fig. 34), where the habitat consists of conifer forest (65 percent of the total land cover within the area) and shrub land. Grassland, pasture, and cultivated crops make up the next highest land cover types (altogether comprising nearly 21 percent of the Selkirk WDMZ). Agriculture in the valley supports high densities of deer adjacent to U.S. Highway 395, which bisects the Selkirk WDMZ from north to south. This white-tailed deer population experiences some of the highest rates of deer-vehicle collisions in the state (Myers and others 2008; G. Kalisz, Washington Department of Transportation, written commun.). Currently, there are no crossing mitigations in place along U.S. Highway 395 or State Route 20 to curtail collisions with wildlife. Other wildlife-human management challenges for this herd include mitigating crop damage complaints, maximizing hunting opportunity, and encroaching human development on the deer’s winter range.
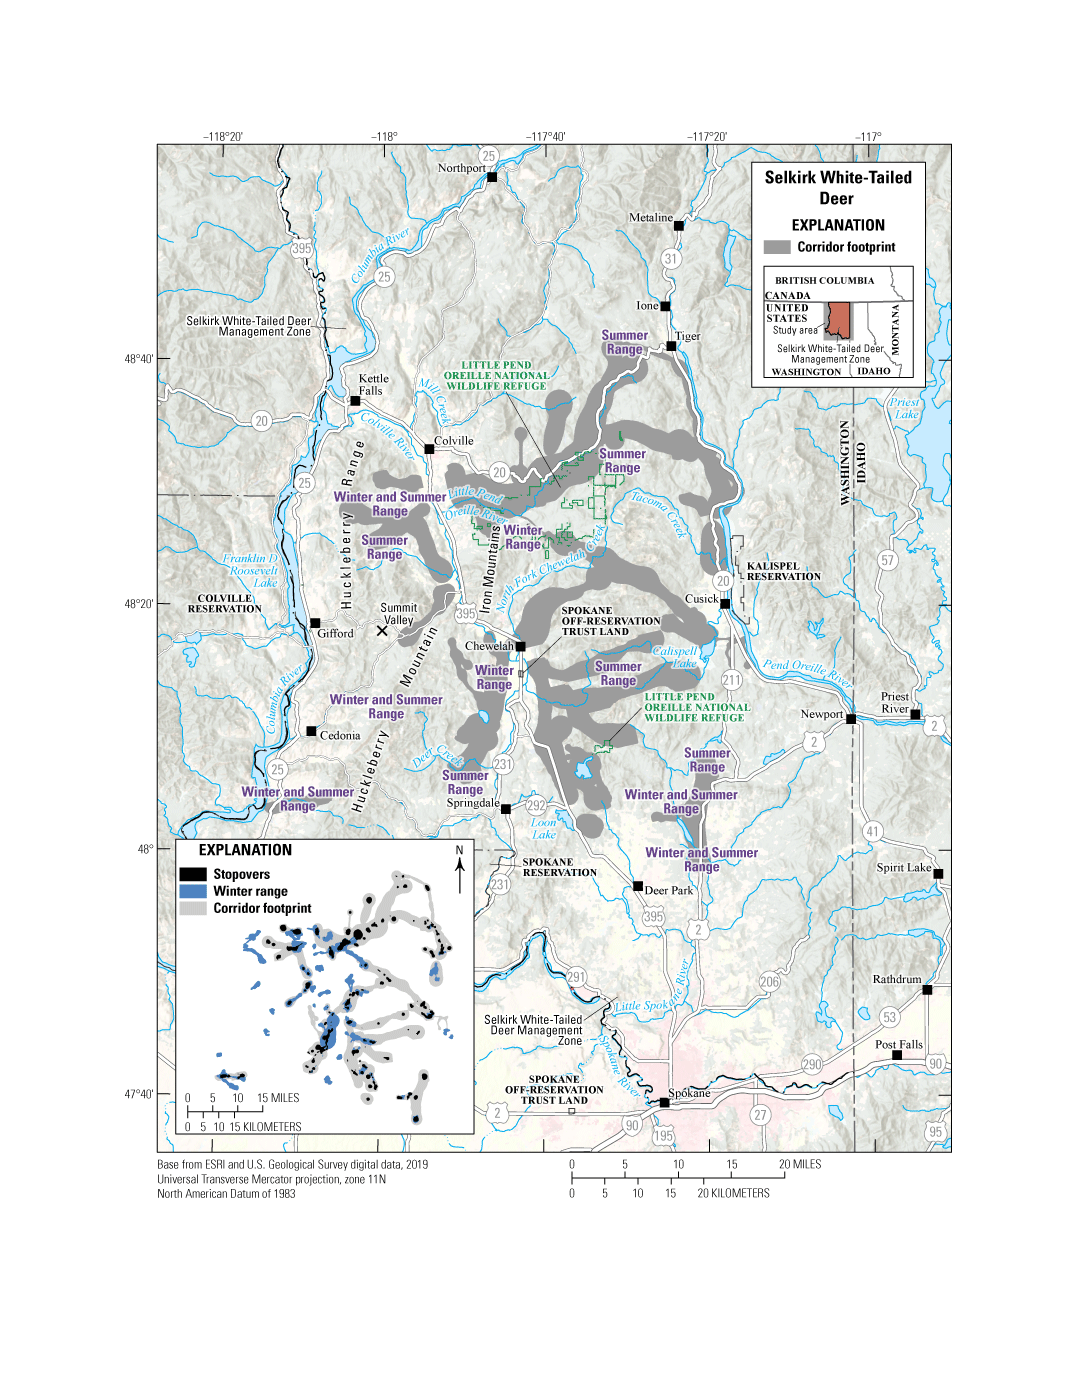
Migration corridor footprint, stopovers, and winter ranges of the Selkirk white-tailed deer herd.
Data Analysis
-
Corridor, stopover, and winter range analysis: BBMM (Sawyer and others, 2009)
-
Delineation of migration periods: NSD (Bunnefeld and others, 2011)
-
Models derived from:
-
Migration: 121 sequences from 43 individuals (72 spring sequences, 49 fall sequences)
-
Winter: 149 sequences from 94 individuals
Corridor and Stopover Summary
Migration start and end dates (median):
Average number of days migrating: Migration corridor length: Migration corridor area:Other Information
Project contacts:
-
Melia DeVivo (Melia.Devivo@dfw.wa.gov), Ungulate Research Scientist, Washington Department of Fish and Wildlife
-
Annemarie Prince (Annemarie.Prince@dfw.wa.gov), Wildlife Biologist, Washington Department of Fish and Wildlife
-
Benjamin Turnock (Benjamin.Turnock@dfw.wa.gov), Wildlife Biologist, Washington Department of Fish and Wildlife
-
Michel Laforge, Postdoctoral Researcher, University of Wyoming
-
Blake Lowrey, Research Scientist, University of Wyoming Cooperative Fish and Wildlife Research Unit
-
Washington Department of Fish and Wildlife, 2010, Washington state deer management plan—White-tailed deer: Olympia, Wash., Wildlife Program, Washington Department of Fish and Wildlife, 119 p. [Also available at https://wdfw.wa.gov/sites/default/files/publications/00497/wdfw00497.pdf.]
-
Washington Department of Fish and Wildlife, 2021, 2021 Game status and trend report: Olympia, Wash., Wildlife Program, Washington Department of Fish and Wildlife, 407 p. [Also available at https://wdfw.wa.gov/sites/default/files/publications/02298/wdfw02298.pdf.]
Arizona | Pronghorn
Big Lake Pronghorn
The Big Lake pronghorn herd resides in the White Mountains of eastern Arizona within GMU 1 (fig. 35). The herd begins spring migration mid-March, crossing the Little Colorado River approximately 4 mi (6 km) north of River Reservoir, to their high-elevation summer range. The summer range consists primarily of high-elevation grasslands and large alpine meadows near Big Lake. Some individuals continue several miles farther south to summer near Middle Mountain. Fall migration occurs in early to mid-October, when the herd moves north to low-elevation grassland habitats west of Eagar, Arizona. The primary threat to this migration corridor is State Route 260, which experiences high traffic volume and requires crossing for pronghorn to access seasonal ranges.
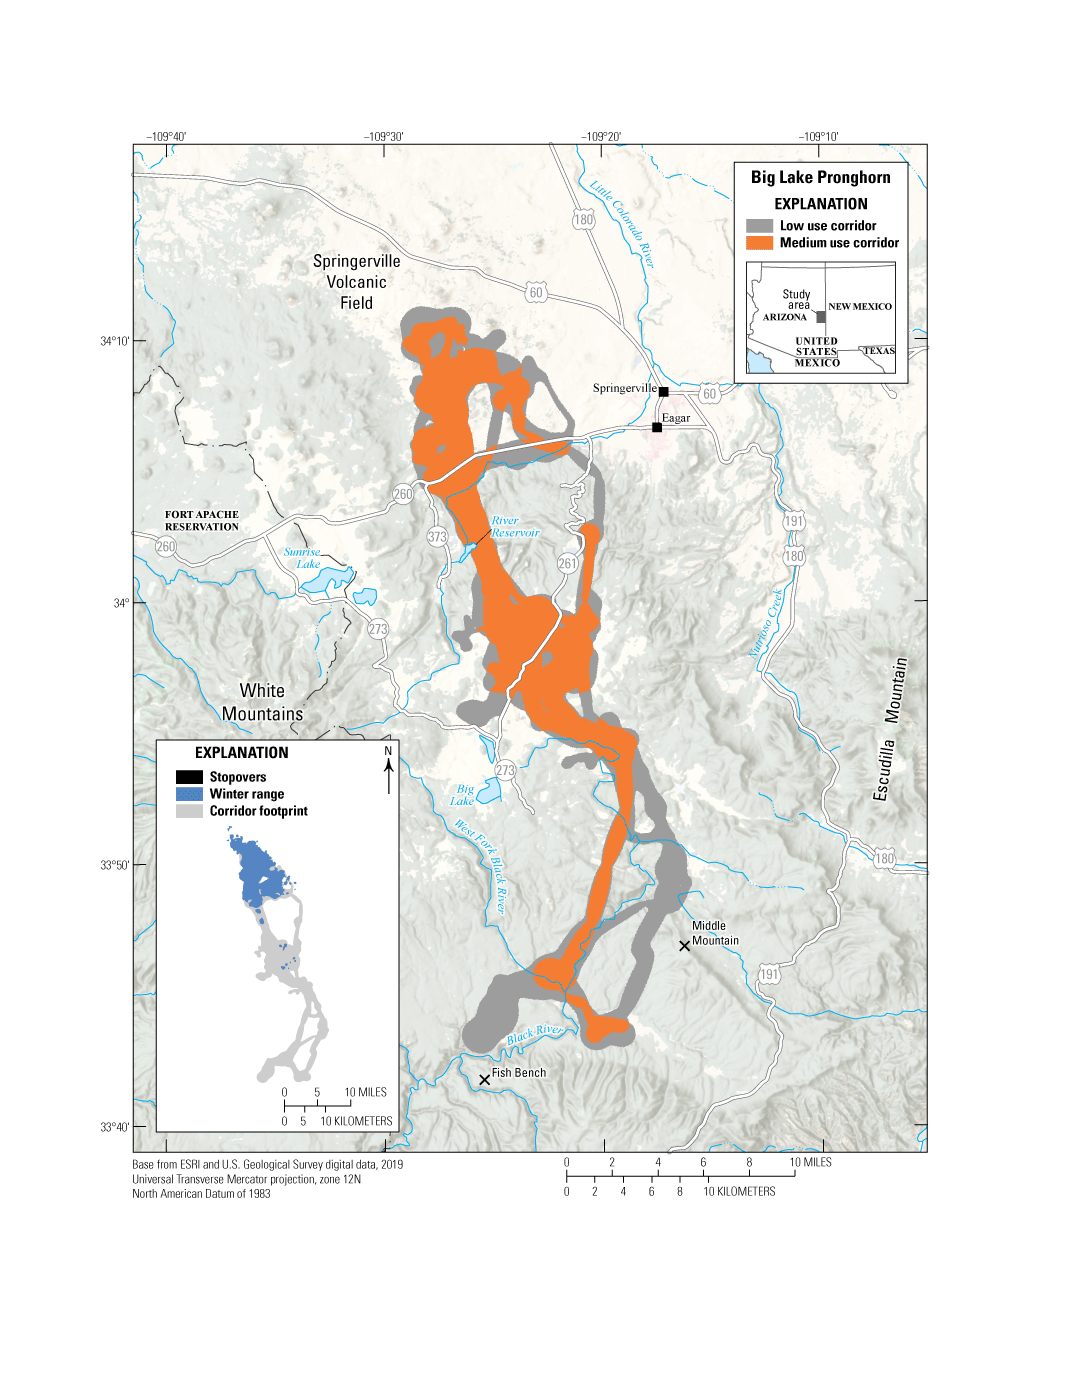
Migration corridors and winter range of the Big Lake pronghorn herd.
Data Analysis
-
Corridor and winter range analysis: BBMM (Sawyer and others, 2009); corridor and winter range analysis used Fixed Motion Variance (see appendix 1 for further description)
-
Delineation of migration periods: NSD (Bunnefeld and others, 2011)
-
Models derived from:
-
Migration: 22 sequences from 8 individuals (9 spring sequences, 13 fall sequences)
-
Winter: 14 sequences from 8 individuals
Corridor and Stopover Summary
Migration start and end dates (median):
Average number of days migrating: Migration corridor length: Migration corridor area:Idaho | Pronghorn
Shotgun Valley Pronghorn
The Shotgun Valley pronghorn population totals approximately 300 animals. Summer range distributions are largely east and north of Dubois, Idaho, ranging from the Camas Creek watershed to Shotgun Valley (fig. 36). These pronghorn winter in and around Dubois and Hamer, Idaho, often becoming dependent on haystacks as a food source once snow accumulations reach moderate levels. In winters with average snow accumulations, Shotgun Valley pronghorn often use railroad tracks as travel corridors and sleeping or loafing locations. Several collisions between pronghorn and trains have occurred in the past, with multiple collisions killing up to 100 pronghorn each (Bodie and others, 1979; Idaho Department of Fish and Game, unpub. data). Interstate 15 has a woven-wire right-of-way fence that restricts this herd to suboptimal winter habitat east of the interstate. Historically, these animals would have continued their fall migrations to the west and wintered in the desert areas near Mud Lake, Idaho. Shotgun Valley pronghorn face a number of challenges during their seasonal movements including numerous fences that decrease landscape permeability, the loss of native range, and seasonal range restrictions.
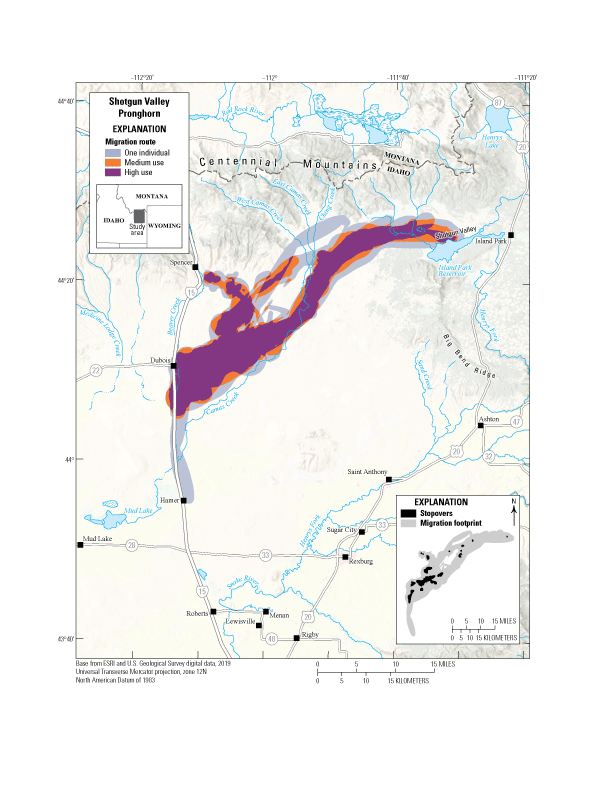
Migration routes and stopovers of the Shotgun Valley pronghorn herd.
Data Analysis
-
Migration and stopover analysis: BBMM (Sawyer and others, 2009)
-
Delineation of migration periods: NSD (Bunnefeld and others, 2011)
-
Models derived from:
-
Migration: 26 sequences from 15 individuals (15 spring sequences, 11 fall sequences)
Migration and Stopover Summary
Migration start and end date (median):
Average number of days migrating: Migration length: Migration area:Other Information
Project contacts:
-
Shane Roberts (shane.roberts@idfg.idaho.gov), Wildlife Research Supervisor, Idaho Department of Fish and Game
-
Mark Hurley (mark.hurley@idfg.idaho.gov), Principal Wildlife Research Biologist, Idaho Department of Fish and Game
-
Curtis Hendricks (curtis.hendricks@idfg.idaho.gov), Regional Wildlife Manager, Idaho Department of Fish and Game
-
Jacob Gray (jacob.gray@idfg.idaho.gov), Environmental Staff Biologist, Idaho Department of Fish and Game
-
Matt Pieron (matt.pieron@idfg.idaho.gov), Mule Deer Initiative Coordinator, Idaho Department of Fish and Game
-
Scott Bergen (scott.bergen@idfg.idaho.gov), Senior Wildlife Research Biologist, Idaho Department of Fish and Game
-
Jodi Berg, Senior Research Scientist, Wyoming Cooperative Fish and Wildlife Research Unit, University of Wyoming
-
Robert Ritson (robert.ritson@idfg.idaho.gov), Associate Research Scientist, Wyoming Cooperative Fish and Wildlife Research Unit, University of Wyoming
-
Hurley, M.A., and Roberts, S., 2020, F19AF00856 statewide wildlife research final performance report: Boise, Idaho, Idaho Department of Fish and Game, 62 p. [Also available at https://collaboration.idfg.idaho.gov/WildlifeTechnicalReports/F19AF00856%20Statewide%20Wildlife%20Research%20Final%20Report%20FY20.pdf.]
-
Meints, D., Ward, R., Knetter, J., Miyasaki, H., Oelrich, K., Mosby, C., Ellstrom, M., Roche, E., Elmer, M., Crea, S., Smith, D., Hribik, D., Hickey, C., Berkley, R., McDonald, M., Lockyer, Z., Hendricks, C., Painter, G., and Newman, D., 2020, F19AF00858 statewide surveys and inventory final performance report: Boise, Idaho, Idaho Department of Fish and Game, 20 p. [Also available at https://collaboration.idfg.idaho.gov/WildlifeTechnicalReports/F19AF00858%20Statewide%20Surveys%20%20Inventory%20Final%20Report%20FY20.pdf.]
New Mexico | Pronghorn
North Central Pronghorn
The North Central pronghorn herd is the only known consistently migratory pronghorn herd in New Mexico and is one of the few pronghorn herds in the west that migrate to higher elevations in the summer (from 7,400 ft [2,256 m] to 10,800 ft [3,292 m]; fig. 37). Their winter range includes primarily sagebrush steppe and stretches across the Rio Grande del Norte National Monument from the Rio Grande to the base of the San Juan Mountains. The pronghorn follow two primary migration corridors: a northern corridor that follows the Rio San Antonio southwest of the Pinabetal Mesa and a southern corridor that follows the arroyos southwest of San Antonio Mountain to Little Tusas Creek. As their migration continues west and overlaps with the San Antonio elk herd, the pronghorn travel through conifer, deciduous, and mixed forests interspersed with shrublands. High-elevation summer range for North Central pronghorn consists of montane meadows, particularly along the Rio Brazos.
Some of the herd crosses U.S. Highway 285 during migration, probably facilitated by the lay-down fence removed for the winter months and does not impede animal movement. Migration routes to higher elevations tend to occur in areas with sparse, woody plant cover; increased canopy cover and woody plant encroachment could affect pronghorn migrations in the future. Fence modifications are ongoing on BLM lands to facilitate pronghorn movements and use of the landscape.
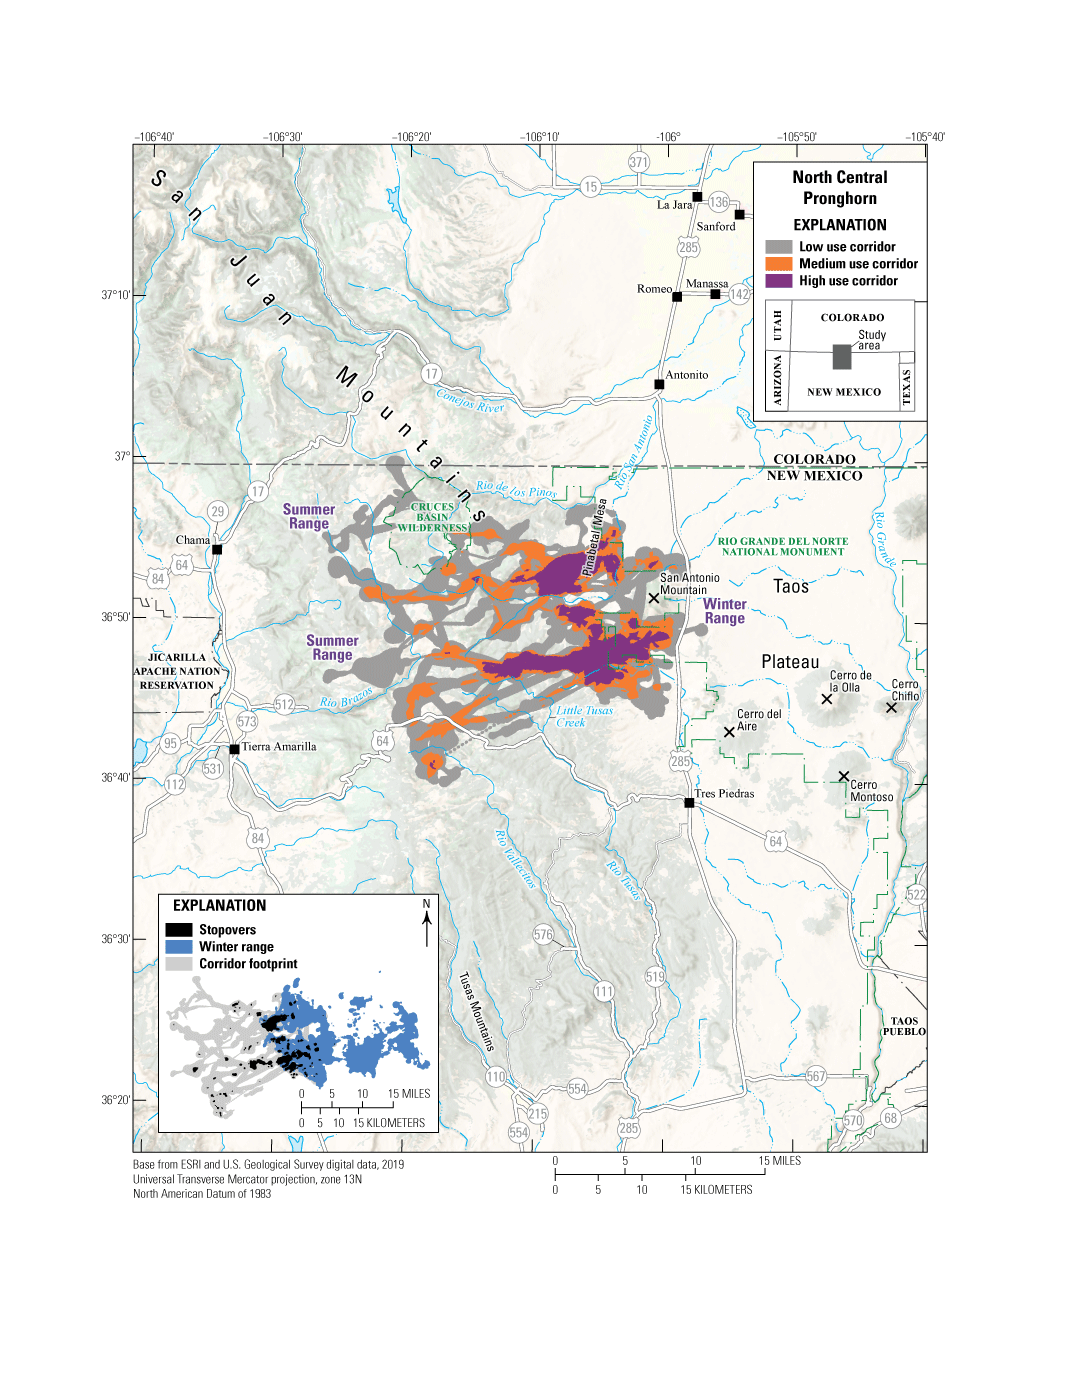
Migration corridors, stopovers, and winter ranges of the North Central pronghorn herd.
Data Analysis
-
Corridor, stopover, and winter range analysis: BBMM (Sawyer and others, 2009); corridor analysis used Fixed Motion Variance (see appendix 1 for further description)
-
Delineation of migration periods: NSD (Bunnefeld and others, 2011)
-
Models derived from:
-
Migration: 60 sequences from 24 individuals (27 spring sequences, 33 fall sequences)
-
Winter: 38 sequences from 23 individuals
Corridor and Stopover Summary
Migration start and end dates (median):
Average number of days migrating: Migration corridor length: Migration corridor area:Wyoming | Pronghorn
Medicine Bow Pronghorn
The Medicine Bow pronghorn population is one of the largest herds in the United States with an estimated population of 38,400 animals. The herd summers in the sagebrush steppe and grasslands of Shirley Basin, north of Medicine Bow, Wyoming (fig. 38). Most pronghorn migrate either west to the southern edge of the Seminoe Reservoir or north to Bates Hole, an area south of Casper, Wyoming. During harsh winters, some pronghorn migrate 65–75 miles (105–121 km) as far west as Rawlins, Wyoming. The Shirley Basin is a mostly intact landscape that is dominated by private lands, with only limited public lands along some foothill habitats. During the early 2000s, several large wind energy facilities were developed; some are in high-use migration corridors and in areas designated as crucial pronghorn winter range. The effects of wind energy development on pronghorn are not well understood, but recent research in Shirley Basin revealed wind energy development causes pronghorn to avoid some preferred habitats. U.S. Highways 30 and 287 and Interstate 80 seemingly bound the movement of these pronghorn to the south. Other challenges Medicine Bow pronghorn face are crossing U.S. Highway 487 and miles of fencing, which can often be a barrier to movement.
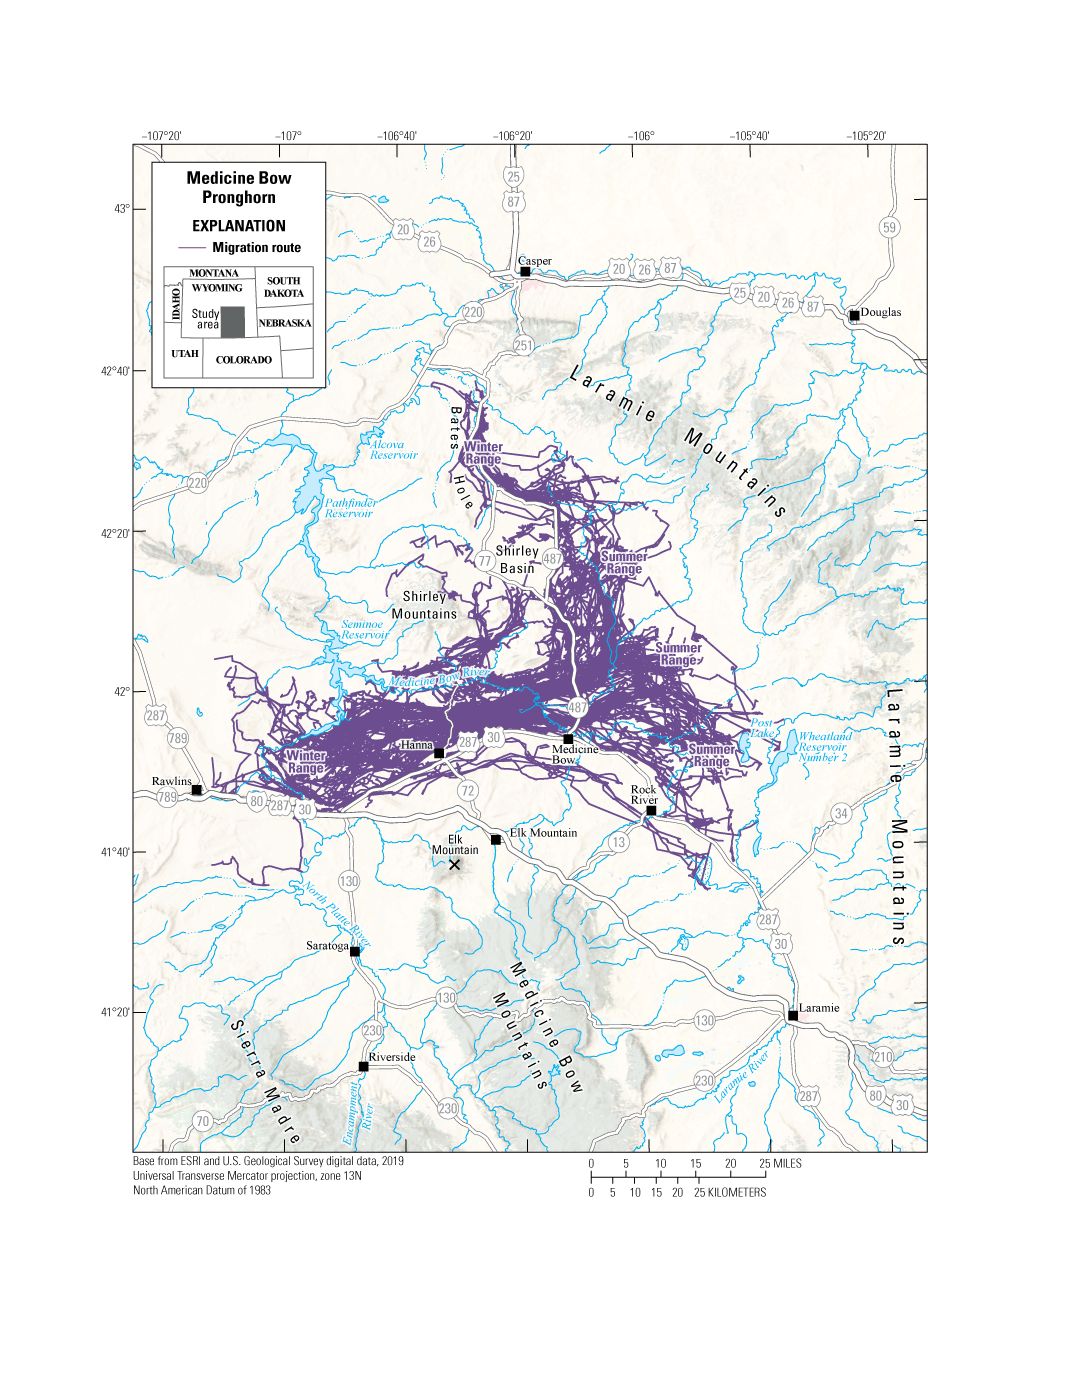
Migration routes of the Medicine Bow Pronghorn.
Data Analysis
-
Delineation of migration periods: NSD (Bunnefeld and others, 2011)
-
Models derived from:
-
Migration: 411 sequences from 123 individuals (138 spring sequences, 156 fall sequences, 66 early winter sequences, 51 late winter sequences)
Corridor and Stopover Summary
Migration start and end dates (median):
Average number of days migrating: Migration corridor length:Other Information
Project contacts:
-
Matthew Kauffman (mkauffm1@uwyo.edu), U.S. Geological Survey, Wyoming Cooperative Fish and Wildlife Research Unit, Department of Zoology and Physiology, University of Wyoming
-
Martin Hicks (martin.hicks@wyo.gov), Wildlife Coordinator, Laramie Region, Wyoming Game and Fish Department
-
Embere Hall (embere.hall@wyo.gov), Science, Research and Analytical Support Section Supervisor, Wyoming Game and Fish Department
-
Cody Wallace, Graduate Research Assistant, Wyoming Cooperative Fish and Wildlife Research Unit, Department of Zoology and Physiology, University of Wyoming
-
Milligan, M.C., Johnston, A.N., Beck, J.L., Smith, K.T., Taylor, K.L., Hall, E., Knox, L., Cufaude, T., Wallace, C., Chong, G., and Kauffman, M.J., 2021, Variable effects of wind‐energy development on seasonal habitat selection of pronghorn: Ecosphere, v. 12, no. 12. [Also available at https://doi.org/10.1002/ecs2.3850.]
-
Smith, K.T., Taylor, K.L., Albeke, S.E. and Beck, J.L., 2020, Pronghorn winter resource selection before and after wind energy development in south-central Wyoming: Rangeland Ecology & Management, v. 73, no. 2, p. 227–233. [Also available at https://doi.org/10.1016/j.rama.2019.12.004.]
California | Elk
Marble Mountain Elk
Little information exists regarding demographic rates and abundance of elk in the Marble Mountains in California. In the early 1990s and 2000s, elk were reintroduced from Oregon into the Marble Mountain, California area (CDFW, 2018). Since then, elk have been reintroduced throughout much of the area, but GPS collar data and information on movement are limited. Elk were collared from 2006 to 2013 to examine home-range use. Ongoing research that began in 2021 is examining how fire affects elk occupancy in the area. Data collection for this work was completed in 2021 and data interpretation and analysis continues. Based on resulting GPS location data, elk were separated into three distinct subherds (north: Ukonom, central: Wooley Creek, and south: South Fork) because of nonoverlapping GPS data points within these areas (fig. 39). The Marble Mountain elk do not migrate between traditional summer and winter seasonal ranges. Instead, the herd contains short-distance, elevation-based migrants displaying a nomadic migratory tendency to move up or down elevational gradients. Some elk used higher elevation areas throughout the summer, though this pattern was not ubiquitous. Therefore, annual home ranges were modeled using year-round GPS data to demarcate high-use areas in lieu of modeling the specific winter ranges commonly seen in other ungulate analyses in California. More GPS collars are being deployed within this elk population in collaboration with the Karuk Tribe, but these data are not included here.
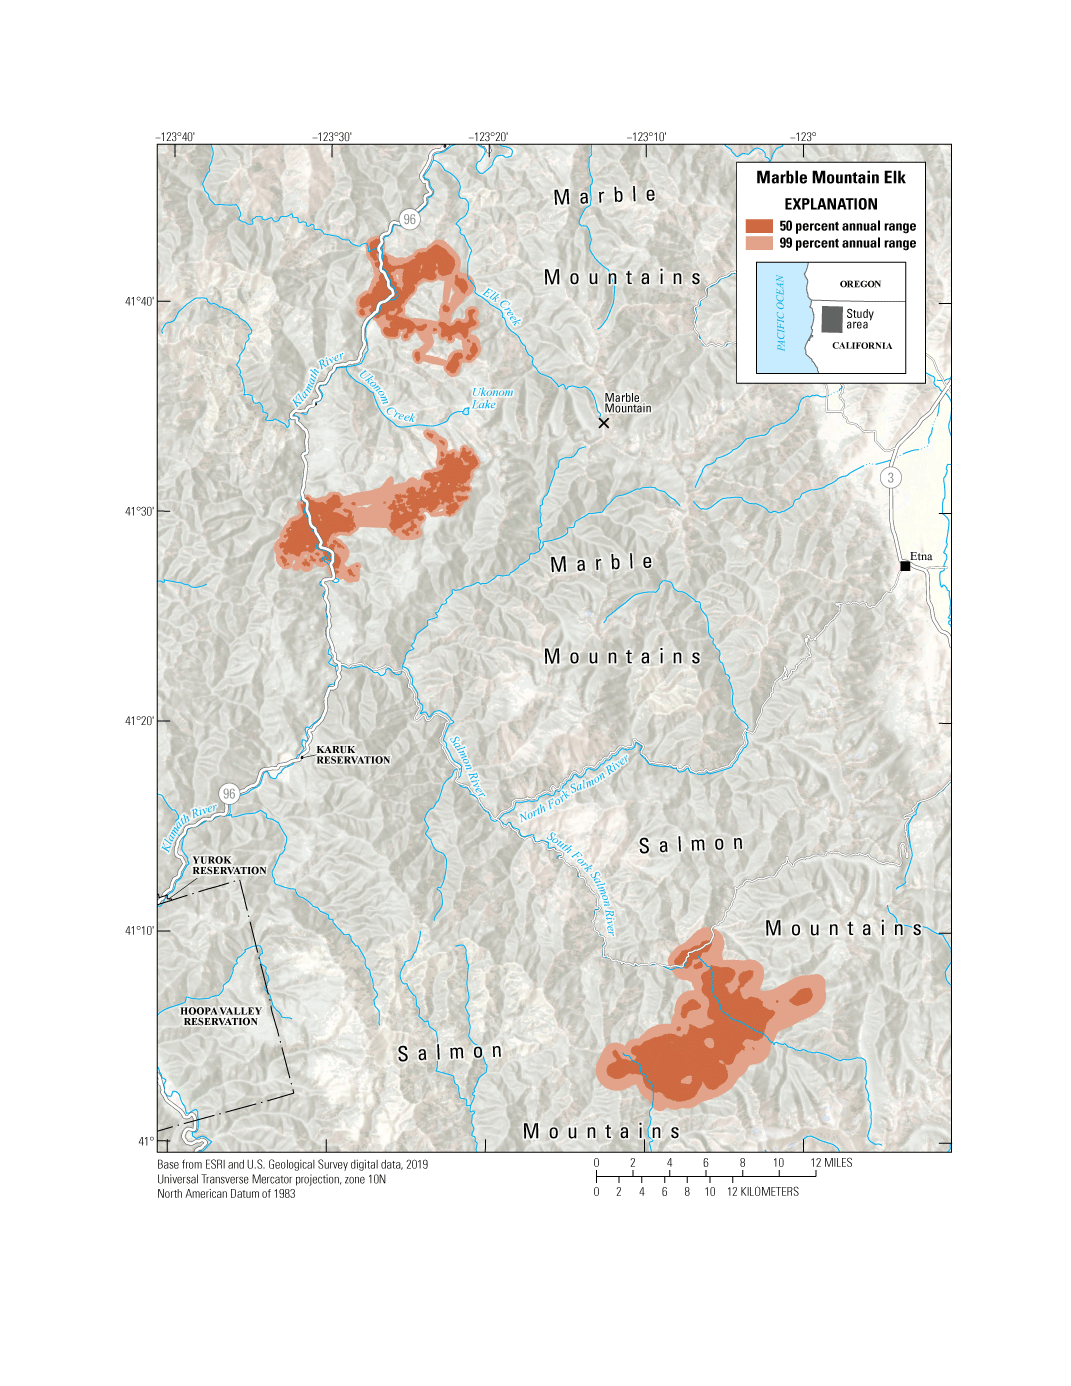
Annual ranges of the Marble Mountain elk herd.
Data Analysis
-
Annual range analysis: BBMM (Sawyer and others, 2009)
-
Models derived from:
-
Annual Range: 12 sequences from 11 individuals
Other Information
Project contacts:
-
Julie Garcia (Julie.Garcia@wildlife.ca.gov), Deer Biologist, California Department of Fish and Wildlife
-
Erin Zulliger (Erin.Zulliger@wildlife.ca.gov), Elk Biologist, California Department of Fish and Wildlife
-
Axel Hunnicutt (Michael.Hunnicutt@wildlife.ca.gov), Wildlife Biologist, California Department of Fish and Wildlife
Idaho | Elk
Black Prince-Slate Creek Elk
Black Prince-Slate Creek elk winter north of the Saint Joe River, close to Erlmo, Idaho (fig. 40). The habitat is primarily mixed-conifer forest with agriculture in the valley. Much of their winter-range habitat lies on private timber company lands on south-facing slopes that were recently logged (Ellstrom and others, 2020). The Black Prince-Slate Creek elk migrate to FS lands in the spring and summer. They travel north−northeast and summer on the south side of the Saint Joe Divide, the divide between the Coeur d’Alene River and Saint Joe River drainages. On average, these elk migrate more than 9 mi (15 km) between their summer and winter ranges.
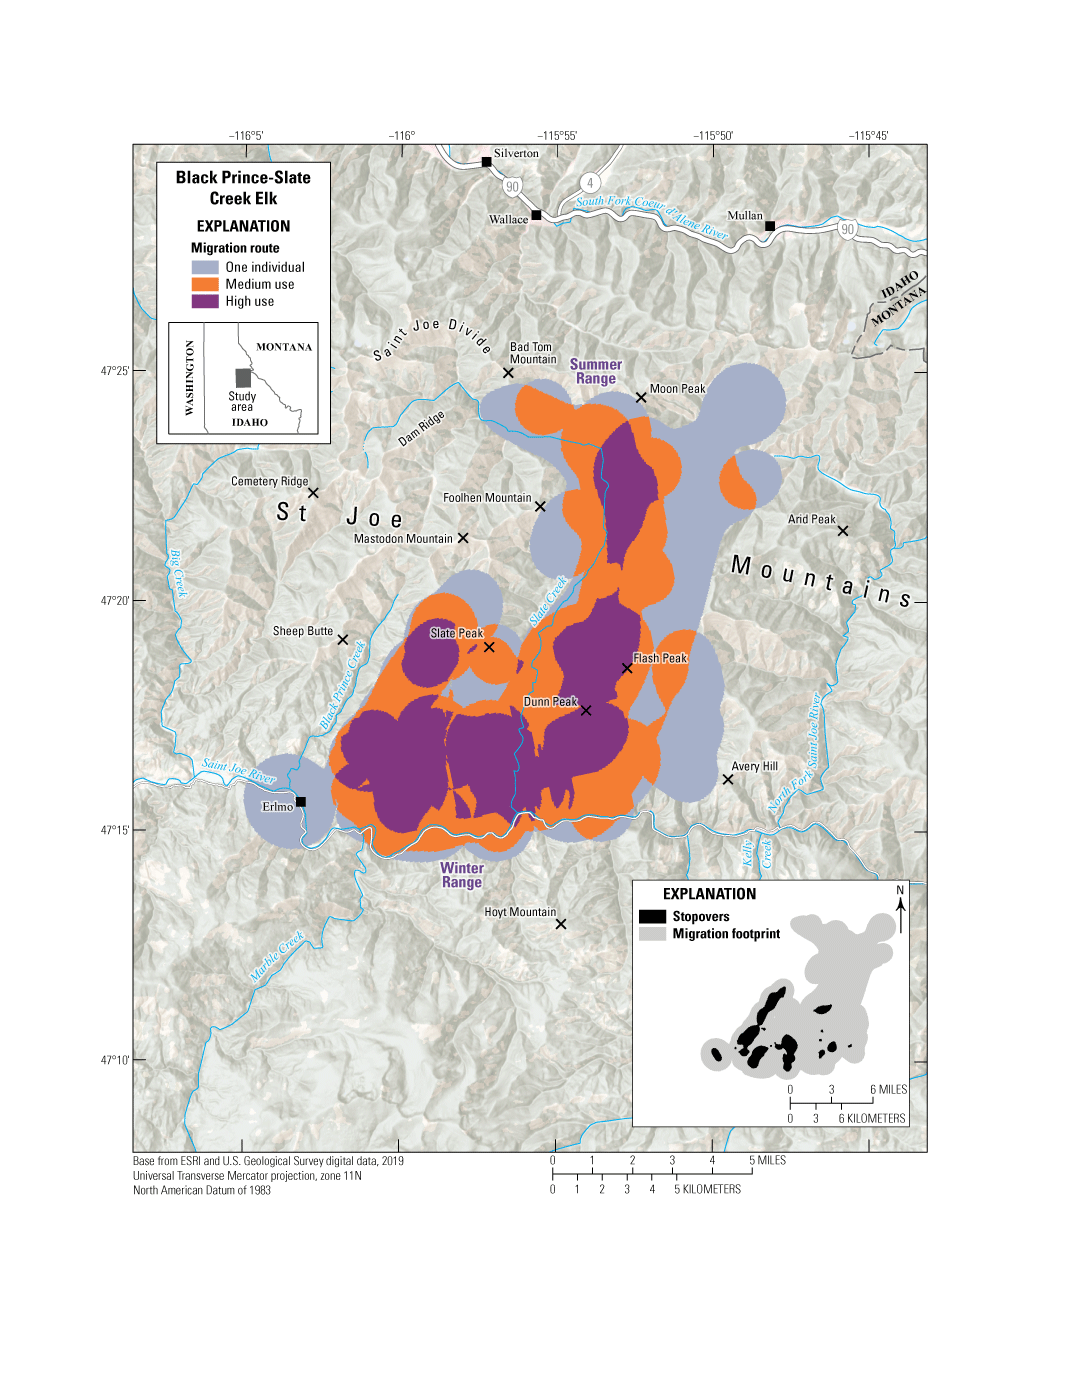
Migration routes and stopovers of the Black Prince-Slate Creek elk herd.
Data Analysis
-
Migration and stopover analysis: of 34 individual seasonal migrations, 17 used Fixed Motion Variance (1,000 m [3,281 ft]; see appendix 1 for further description) with a 14-hour time lag; 17 used Fixed Motion Variance (1,000 m [3,281 ft]) with a 27-hour time lag.
-
Delineation of migration periods: NSD (Bunnefeld and others, 2011)
-
Models derived from:
-
Migration: 34 sequences from 17 individuals (22 spring sequences, 12 fall sequences)
Migration and Stopover Summary
Migration start and end dates (median):
Average number of days migrating: Migration length: Migration area:Other Information
Project contacts:
-
Shane Roberts (shane.roberts@idfg.idaho.gov), Wildlife Research Supervisor, Idaho Department of Fish and Game
-
Mark Hurley (mark.hurley@idfg.idaho.gov), Principal Wildlife Research Biologist, Idaho Department of Fish and Game
-
Laura Wolf (laura.wolf@idfg.idaho.gov), Regional Wildlife Biologist, Idaho Department of Fish and Game
-
Barb Moore (barb.moore@idfg.idaho.gov), Regional Wildlife Biologist, Idaho Department of Fish and Game
-
Scott Bergen (scott.bergen@idfg.idaho.gov), Senior Wildlife Research Biologist, Idaho Department of Fish and Game
-
Jodi Berg, Senior Research Scientist, Wyoming Cooperative Fish and Wildlife Research Unit, University of Wyoming
-
Robert Ritson (robert.ritson@idfg.idaho.gov), Associate Research Scientist, Wyoming Cooperative Fish and Wildlife Research Unit, University of Wyoming
-
Hurley, M.A., and Roberts, S., 2020, F19AF00856 statewide wildlife research final performance report: Boise, Idaho, Idaho Department of Fish and Game, 62 p. [Also available at https://collaboration.idfg.idaho.gov/WildlifeTechnicalReports/F19AF00856%20Statewide%20Wildlife%20Research%20Final%20Report%20FY20.pdf.]
-
Meints, D., Ward, R., Knetter, J., Miyasaki, H., Oelrich, K., Mosby, C., Ellstrom, M., Roche, E., Elmer, M., Crea, S., Smith, D., Hribik, D., Hickey, C., Berkley, R., McDonald, M., Lockyer, Z., Hendricks, C., Painter, G., and Newman, D., 2020, F19AF00858 statewide surveys and inventory final performance report: Boise, Idaho, Idaho Department of Fish and Game, 20 p. [Also available at https://collaboration.idfg.idaho.gov/WildlifeTechnicalReports/F19AF00858%20Statewide%20Surveys%20%20Inventory%20Final%20Report%20FY20.pdf.]
Idaho | Elk
North Fork of St. Joe River Elk
North Fork of St. Joe River elk winter on the brushy, south-facing slopes near Avery, approximately 35 mi (56 km) east of Saint Maries, Idaho, between Slate Creek and the North Fork Saint Joe River (fig. 41). They migrate north−northeast and summer in mixed-conifer forests near the border of Montana and sometimes migrate as far as Interstate 90 in Montana. This elk population has the longest known migration in the Idaho panhandle, migrating an average of 16 mi (26 km) between the winter and summer ranges. The North Fork of St. Joe River elk population, part of GMUs 6 and 7, declined by more than half in 2009–2020 (Ellstrom and others, 2020). Interstate 90 may constrict migration distances, but seasonal routes are probably not affected as the migrations occur almost solely on public FS lands.
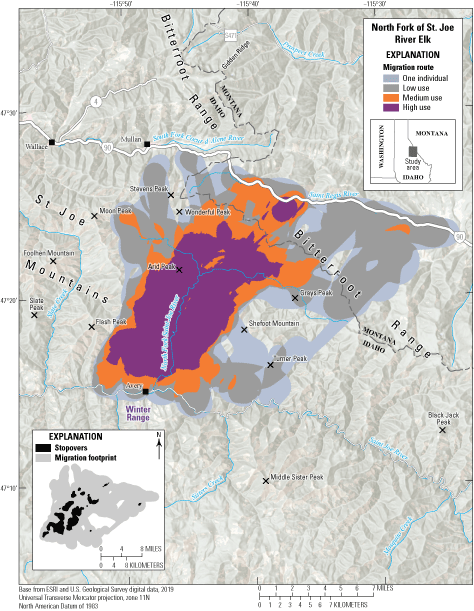
Migration routes and stopovers of the North Fork of St. Joe River elk herd.
Animal Capture and Data Collection
-
Sample size: 35 adult female elk
-
Relocation frequency: Approximately 12.5–23.5 hours
-
Project duration: March 2015–October 2019
-
Data Analysis
-
Migration and stopover analysis: of 104 individual seasonal migrations, 33 used Fixed Motion Variance (1,000 m [3,281 ft]; see appendix 1 for further description) with a 14-hour time lag; 71 used Fixed Motion Variance (1,000 m [3,281 ft]) with a 27-hour time lag.
-
Delineation of migration periods: NSD (Bunnefeld and others, 2011)
-
Models derived from:
-
Migration: 104 sequences from 35 individuals (61 spring sequences, 43 fall sequences)
Migration and Stopover Summary
Migration start and end date (median):
Average number of days migrating: Migration length: Migration area:Other Information
Project contacts:
-
Shane Roberts (shane.roberts@idfg.idaho.gov), Wildlife Research Supervisor, Idaho Department of Fish and Game
-
Mark Hurley (mark.hurley@idfg.idaho.gov), Principal Wildlife Research Biologist, Idaho Department of Fish and Game
-
Laura Wolf (laura.wolf@idfg.idaho.gov), Regional Wildlife Biologist, Idaho Department of Fish and Game
-
Barb Moore (barb.moore@idfg.idaho.gov), Regional Wildlife Biologist, Idaho Department of Fish and Game
-
Scott Bergen (scott.bergen@idfg.idaho.gov), Senior Wildlife Research Biologist, Idaho Department of Fish and Game
-
Jodi Berg, Senior Research Scientist, Wyoming Cooperative Fish and Wildlife Research Unit, University of Wyoming
-
Robert Ritson (robert.ritson@idfg.idaho.gov), Associate Research Scientist, Wyoming Cooperative Fish and Wildlife Research Unit, University of Wyoming
-
Hurley, M.A., and Roberts, S., 2020, F19AF00856 statewide wildlife research final performance report: Boise, Idaho, Idaho Department of Fish and Game, 62 p. [Also available at https://collaboration.idfg.idaho.gov/WildlifeTechnicalReports/F19AF00856%20Statewide%20Wildlife%20Research%20Final%20Report%20FY20.pdf.]
-
Meints, D., Ward, R., Knetter, J., Miyasaki, H., Oelrich, K., Mosby, C., Ellstrom, M., Roche, E., Elmer, M., Crea, S., Smith, D., Hribik, D., Hickey, C., Berkley, R., McDonald, M., Lockyer, Z., Hendricks, C., Painter, G., and Newman, D., 2020, F19AF00858 statewide surveys and inventory final performance report: Boise, Idaho, Idaho Department of Fish and Game, 20 p. [Also available at https://collaboration.idfg.idaho.gov/WildlifeTechnicalReports/F19AF00858%20Statewide%20Surveys%20%20Inventory%20Final%20Report%20FY20.pdf.]
Idaho | Elk
Rochat Creek-Ahrs Creek Elk
Rochat Creek-Ahrs Creek elk winter north of Saint Joe River, approximately 7 mi (11 km) east of Saint Maries, Idaho (fig. 42). The habitat is primarily mixed-conifer forest with agriculture in the valley. Much of the herd’s winter-range habitat lies on private timber company lands on south-facing slopes that were recently logged (Ellstrom and others, 2020). Most elk in this population migrate north and summer on the south side of the Saint Joe Divide. A few individuals continue north to the South Fork Coeur d’Alene River drainage, while others migrate south of the Saint Joe River. On average, these elk migrate almost 8 mi (13 km) between their summer and winter ranges. Rochat Creek-Ahrs Creek elk summer on a mix of BLM, FS, and private timber company lands. Land use (logged compared to unlogged) likely affects seasonal migration routes and seasonal ranges.
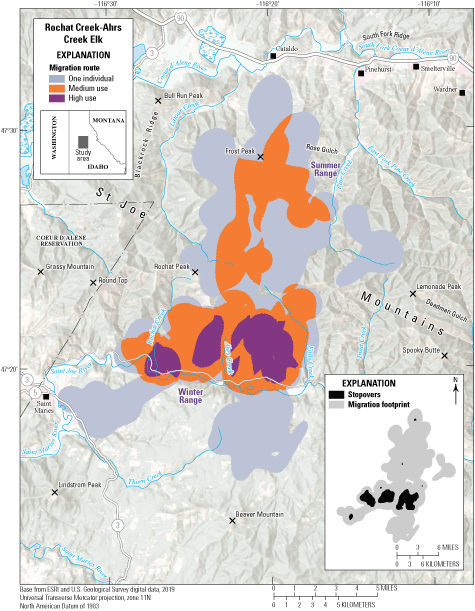
Migration routes and stopovers of the Rochat Creek-Ahrs Creek elk herd.
Animal Capture and Data Collection
-
Sample size: 16 adult female elk
-
Relocation frequency: Approximately 12.5–23.5 hours
-
Project duration: June 2015–December 2019
-
Data Analysis
-
Migration and stopover analysis: of 39 individual seasonal migrations, 24 used Fixed Motion Variance (1,000 m [3,281 ft]; see appendix 1 for further description) with a 14-hour time lag; 15 used Fixed Motion Variance (1,000 m [3,281]) with a 27-hour time lag.
-
Delineation of migration periods: NSD (Bunnefeld and others, 2011)
-
Models derived from:
-
Migration: 39 sequences from 16 individuals (23 spring sequences, 16 fall sequences)
Migration and Stopover Summary
Migration start and end dates (median):
Average number of days migrating: Migration length: Migration area:Other Information
Project contacts:
-
Shane Roberts (shane.roberts@idfg.idaho.gov), Wildlife Research Supervisor, Idaho Department of Fish and Game
-
Mark Hurley (mark.hurley@idfg.idaho.gov), Principal Wildlife Research Biologist, Idaho Department of Fish and Game
-
Laura Wolf (laura.wolf@idfg.idaho.gov), Regional Wildlife Biologist, Idaho Department of Fish and Game
-
Barb Moore (barb.moore@idfg.idaho.gov), Regional Wildlife Biologist, Idaho Department of Fish and Game
-
Scott Bergen (scott.bergen@idfg.idaho.gov), Senior Wildlife Research Biologist, Idaho Department of Fish and Game
-
Jodi Berg, Senior Research Scientist, Wyoming Cooperative Fish and Wildlife Research Unit, University of Wyoming
-
Robert Ritson (robert.ritson@idfg.idaho.gov), Associate Research Scientist, Wyoming Cooperative Fish and Wildlife Research Unit, University of Wyoming
-
Hurley, M.A., and Roberts, S., 2020, F19AF00856 statewide wildlife research final performance report: Boise, Idaho, Idaho Department of Fish and Game, 62 p. [Also available at https://collaboration.idfg.idaho.gov/WildlifeTechnicalReports/F19AF00856%20Statewide%20Wildlife%20Research%20Final%20Report%20FY20.pdf.]
-
Meints, D., Ward, R., Knetter, J., Miyasaki, H., Oelrich, K., Mosby, C., Ellstrom, M., Roche, E., Elmer, M., Crea, S., Smith, D., Hribik, D., Hickey, C., Berkley, R., McDonald, M., Lockyer, Z., Hendricks, C., Painter, G., and Newman, D., 2020, F19AF00858 statewide surveys and inventory final performance report: Boise, Idaho, Idaho Department of Fish and Game, 20 p. [Also available at https://collaboration.idfg.idaho.gov/WildlifeTechnicalReports/F19AF00858%20Statewide%20Surveys%20%20Inventory%20Final%20Report%20FY20.pdf.]
Idaho | Elk
Sand Creek Elk
Approximately 4,500 elk from the Island Park population winter in the gentle, rolling terrain surrounding Sand Creek (this area is regionally known as the Sand Creek Desert) (fig. 43). In spring, the Sand Creek elk herd migrates to their summer range in GMUs 60, 61, and 62A. Winter restrictions on human entry across much of the area provide elk with undisturbed access to high-quality sage-steppe habitats. Sagebrush and bitterbrush with herbaceous understory are interspersed with stands of juniper, chokecherry, and other shrub species. Douglas fir and lodgepole pine communities are common in migratory habitats along Big Bend Ridge as elevation increases north of Sand Creek. Two main challenges these elk face during migration include an extensive network of fencing and traffic on U.S. Highway 20.
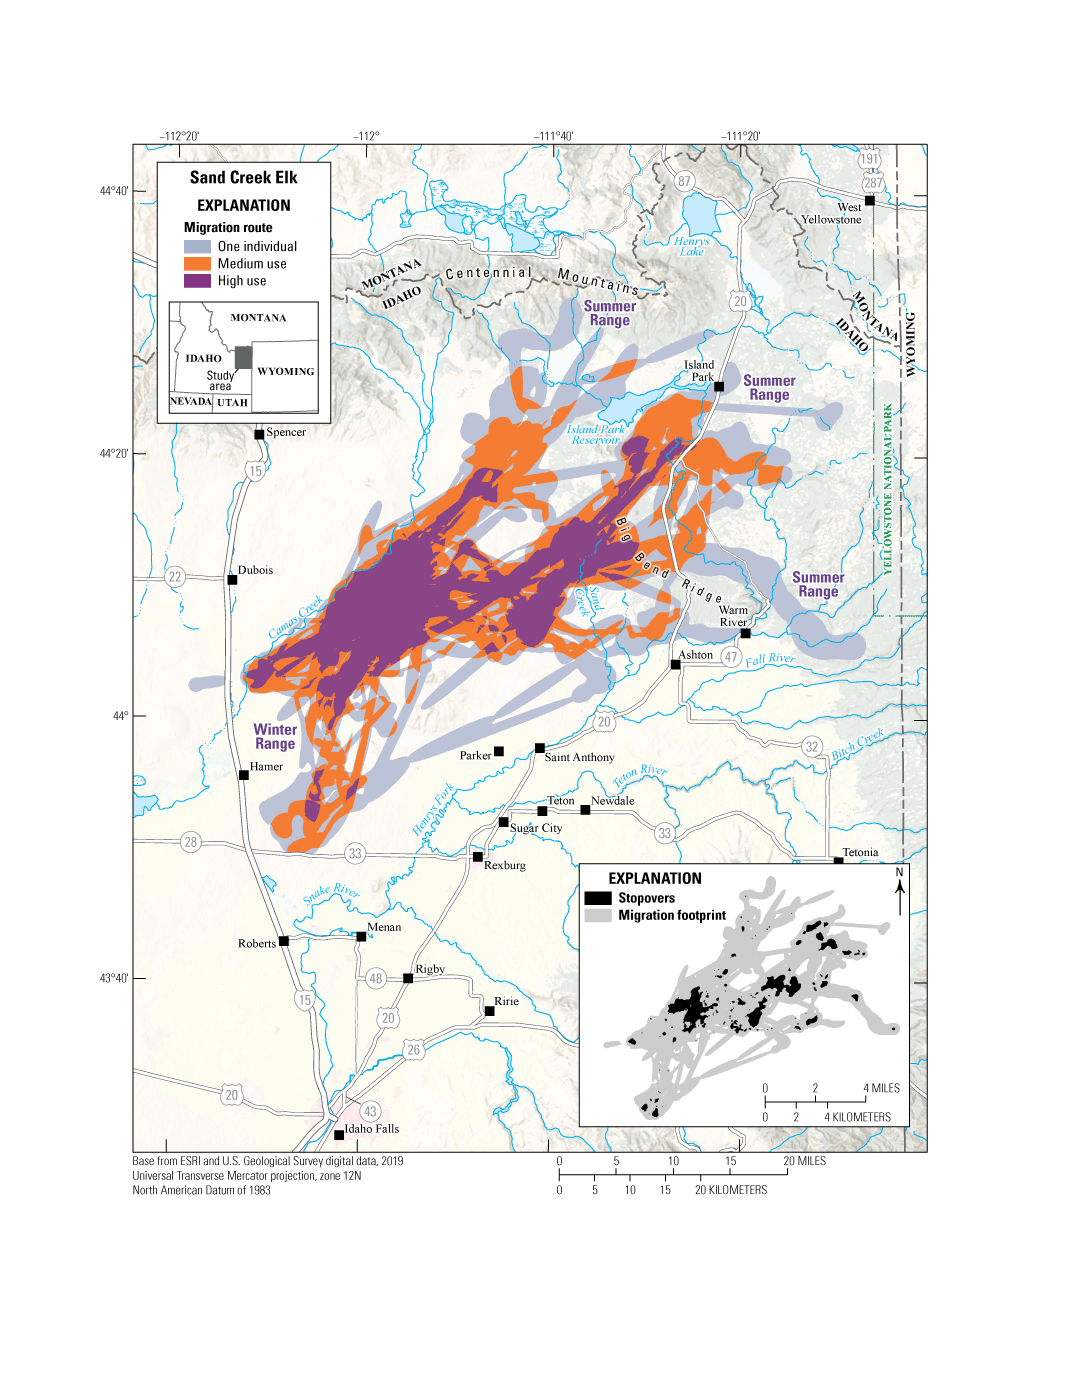
Migration routes and stopovers of the Sand Creek elk herd.
Data Analysis
-
Migration and stopover analysis: of 45 individual seasonal migrations, 1 used BBMM (Sawyer and others, 2009) with an 8-hour time lag; 23 used Fixed Motion Variance (1,000 m [3,281 ft]; see appendix 1 for further description) with a 14-hour time lag; 21 used Fixed Motion Variance (1,000 m [3,281 ft]) with a 27-hour time lag.
-
Delineation of migration periods: NSD (Bunnefeld and others, 2011)
-
Models derived from:
-
Migration: 45 sequences from 18 individuals (28 spring sequences, 17 fall sequences)
Migration and Stopover Summary
Migration start and end dates (median):
Average number of days migrating: Migration length: Migration area:Other Information
Project contacts:
-
Shane Roberts (shane.roberts@idfg.idaho.gov), Wildlife Research Supervisor, Idaho Department of Fish and Game
-
Mark Hurley (mark.hurley@idfg.idaho.gov), Principal Wildlife Research Biologist, Idaho Department of Fish and Game
-
Curtis Hendricks (curtis.hendricks@idfg.idaho.gov), Regional Wildlife Manager, Idaho Department of Fish and Game
-
Jacob Gray (jacob.gray@idfg.idaho.gov), Environmental Staff Biologist, Idaho Department of Fish and Game
-
Matt Pieron (matt.pieron@idfg.idaho.gov), Mule Deer Initiative Coordinator, Idaho Department of Fish and Game
-
Scott Bergen (scott.bergen@idfg.idaho.gov), Senior Wildlife Research Biologist, Idaho Department of Fish and Game
-
Jodi Berg, Senior Research Scientist, Wyoming Cooperative Fish and Wildlife Research Unit, University of Wyoming
-
Robert Ritson (robert.ritson@idfg.idaho.gov), Associate Research Scientist, Wyoming Cooperative Fish and Wildlife Research Unit, University of Wyoming
-
Hurley, M.A., and Roberts, S., 2020, F19AF00856 statewide wildlife research final performance report: Boise, Idaho, Idaho Department of Fish and Game, 62 p. [Also available at https://collaboration.idfg.idaho.gov/WildlifeTechnicalReports/F19AF00856%20Statewide%20Wildlife%20Research%20Final%20Report%20FY20.pdf.]
-
Meints, D., Ward, R., Knetter, J., Miyasaki, H., Oelrich, K., Mosby, C., Ellstrom, M., Roche, E., Elmer, M., Crea, S., Smith, D., Hribik, D., Hickey, C., Berkley, R., McDonald, M., Lockyer, Z., Hendricks, C., Painter, G., and Newman, D., 2020, F19AF00858 statewide surveys and inventory final performance report: Boise, Idaho, Idaho Department of Fish and Game, 20 p. [Also available at https://collaboration.idfg.idaho.gov/WildlifeTechnicalReports/F19AF00858%20Statewide%20Surveys%20%20Inventory%20Final%20Report%20FY20.pdf.]
Idaho | Elk
South of St. Joe River Elk
South of St. Joe River elk winter south of the Saint Joe River between Mica Creek and Marble Creek (fig. 44). Most elk in this population migrate south to southwest, but a few individuals migrate north of the Saint Joe River. On average, these elk migrate approximately 9 mi (14 km) between their summer and winter ranges. The habitat is primarily mixed-conifer forest with agriculture in the valley. South of Saint Joe River elk winter and summer primarily on managed forests (private timberlands and Idaho Department of Land property), but they also use FS lands. Land use (logged compared to unlogged) probably affects seasonal migration routes and seasonal ranges as there are large, clearcut areas within their migration routes.
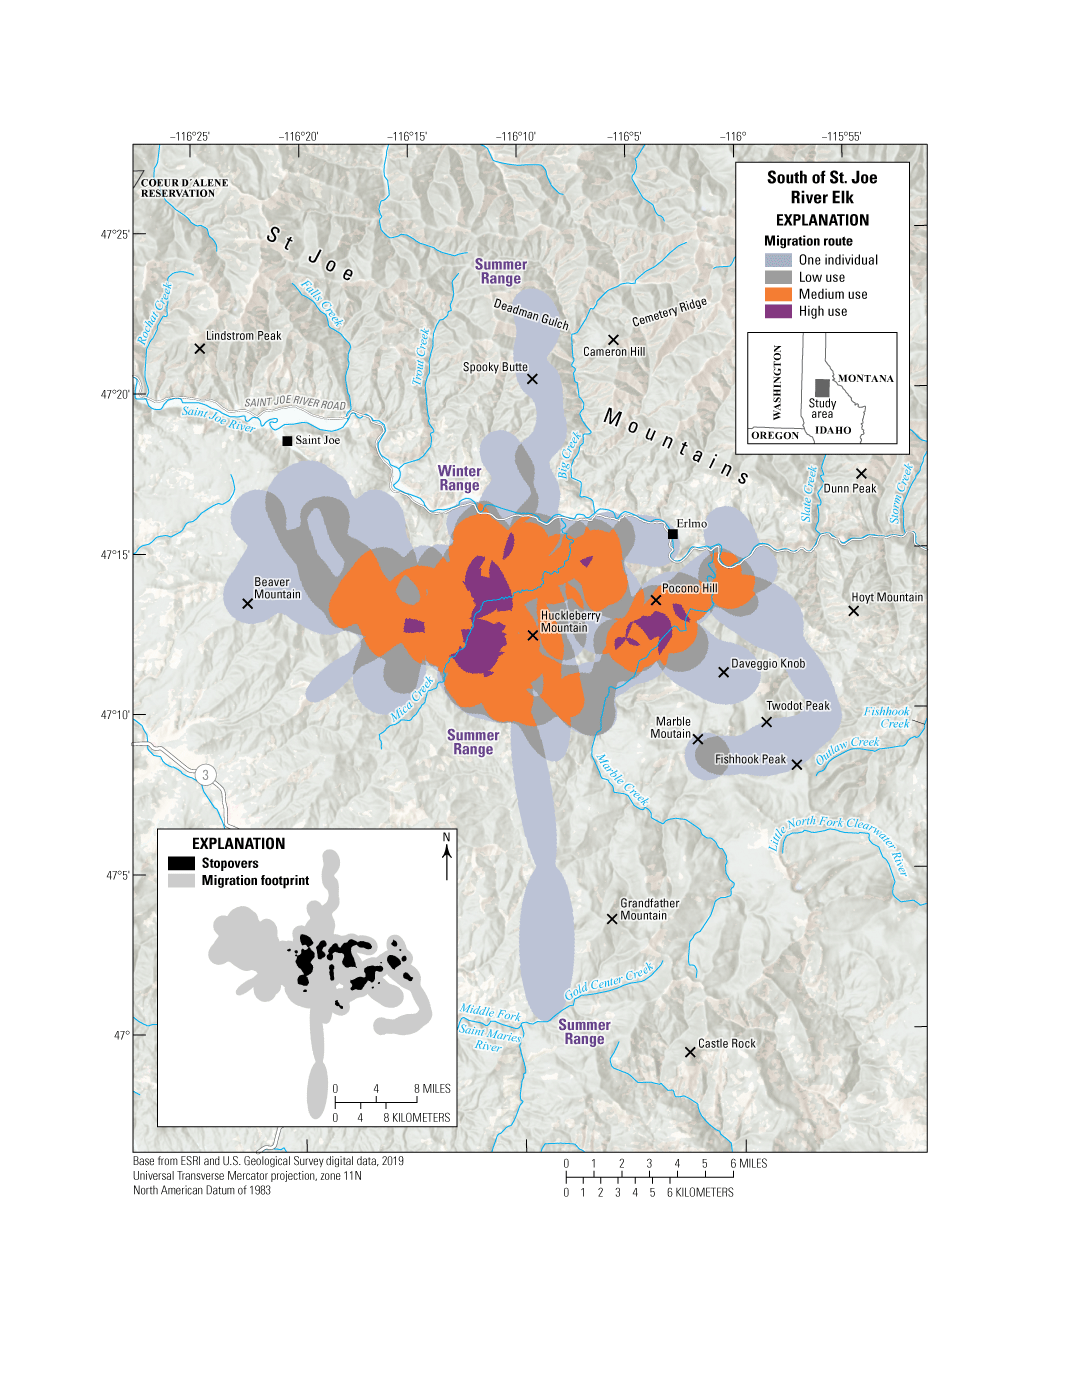
Migration routes and stopovers of the South of Saint Joe River elk herd.
Data Analysis
-
Migration and stopover analysis: of 44 individual seasonal migrations, 26 used Fixed Motion Variance (1,000 m [3,281 ft]; see appendix 1 for further description) with a 14-hour time lag; 18 used Fixed Motion Variance (1,000 m [3,281 ft]) with a 27-hour time lag.
-
Delineation of migration periods: NSD (Bunnefeld and others, 2011)
-
Models derived from:
-
Migration: 44 sequences from 26 individuals (28 spring sequences, 16 fall sequences)
Migration and Stopover Summary
Migration start and end dates (median):
Average number of days migrating: Migration length: Migration area:Other Information
Project contacts:
-
Shane Roberts (shane.roberts@idfg.idaho.gov), Wildlife Research Supervisor, Idaho Department of Fish and Game
-
Mark Hurley (mark.hurley@idfg.idaho.gov), Principal Wildlife Research Biologist, Idaho Department of Fish and Game
-
Laura Wolf (laura.wolf@idfg.idaho.gov), Regional Wildlife Biologist, Idaho Department of Fish and Game
-
Barb Moore (barb.moore@idfg.idaho.gov), Regional Wildlife Biologist, Idaho Department of Fish and Game
-
Scott Bergen (scott.bergen@idfg.idaho.gov), Senior Wildlife Research Biologist, Idaho Department of Fish and Game
-
Jodi Berg, Senior Research Scientist, Wyoming Cooperative Fish and Wildlife Research Unit, University of Wyoming
-
Robert Ritson (robert.ritson@idfg.idaho.gov), Associate Research Scientist, Wyoming Cooperative Fish and Wildlife Research Unit, University of Wyoming
-
Hurley, M.A., and Roberts, S., 2020, F19AF00856 statewide wildlife research final performance report: Boise, Idaho, Idaho Department of Fish and Game, 62 p. [Also available at https://collaboration.idfg.idaho.gov/WildlifeTechnicalReports/F19AF00856%20Statewide%20Wildlife%20Research%20Final%20Report%20FY20.pdf.]
-
Meints, D., Ward, R., Knetter, J., Miyasaki, H., Oelrich, K., Mosby, C., Ellstrom, M., Roche, E., Elmer, M., Crea, S., Smith, D., Hribik, D., Hickey, C., Berkley, R., McDonald, M., Lockyer, Z., Hendricks, C., Painter, G., and Newman, D., 2020, F19AF00858 statewide surveys and inventory final performance report: Boise, Idaho, Idaho Department of Fish and Game, 20 p. [Also available at https://collaboration.idfg.idaho.gov/WildlifeTechnicalReports/F19AF00858%20Statewide%20Surveys%20%20Inventory%20Final%20Report%20FY20.pdf.]
Idaho | Elk
Teton River Elk
The Teton River elk herd includes approximately 500 individuals and is managed as part of the larger Island Park population (fig. 45). Historically, these elk wintered in aspen and shrub communities associated with the Teton Canyon and migrated east to summer in forested habitats in the eastern portion of GMU 62 in Idaho and into Wyoming. This herd has shifted primarily to summer habitats associated with agriculture in GMU 62, with fewer individuals migrating to Wyoming. This shift has resulted in increased conflict with agricultural producers. Winter distributions have also shifted in response to habitat loss and human disturbance, with most individuals now wintering in the Hog Hollow area along the Teton River. In February 2019, approximately 300 of these elk moved west, crossed U.S. Highway 20, and wintered along Henrys Fork, Snake River, and Sand Creek near Sugar City, Idaho. Elk repeated this pattern in 2020 and 2021, raising concerns of increased WVC and increased conflict with livestock operations and associated fencing infrastructure.
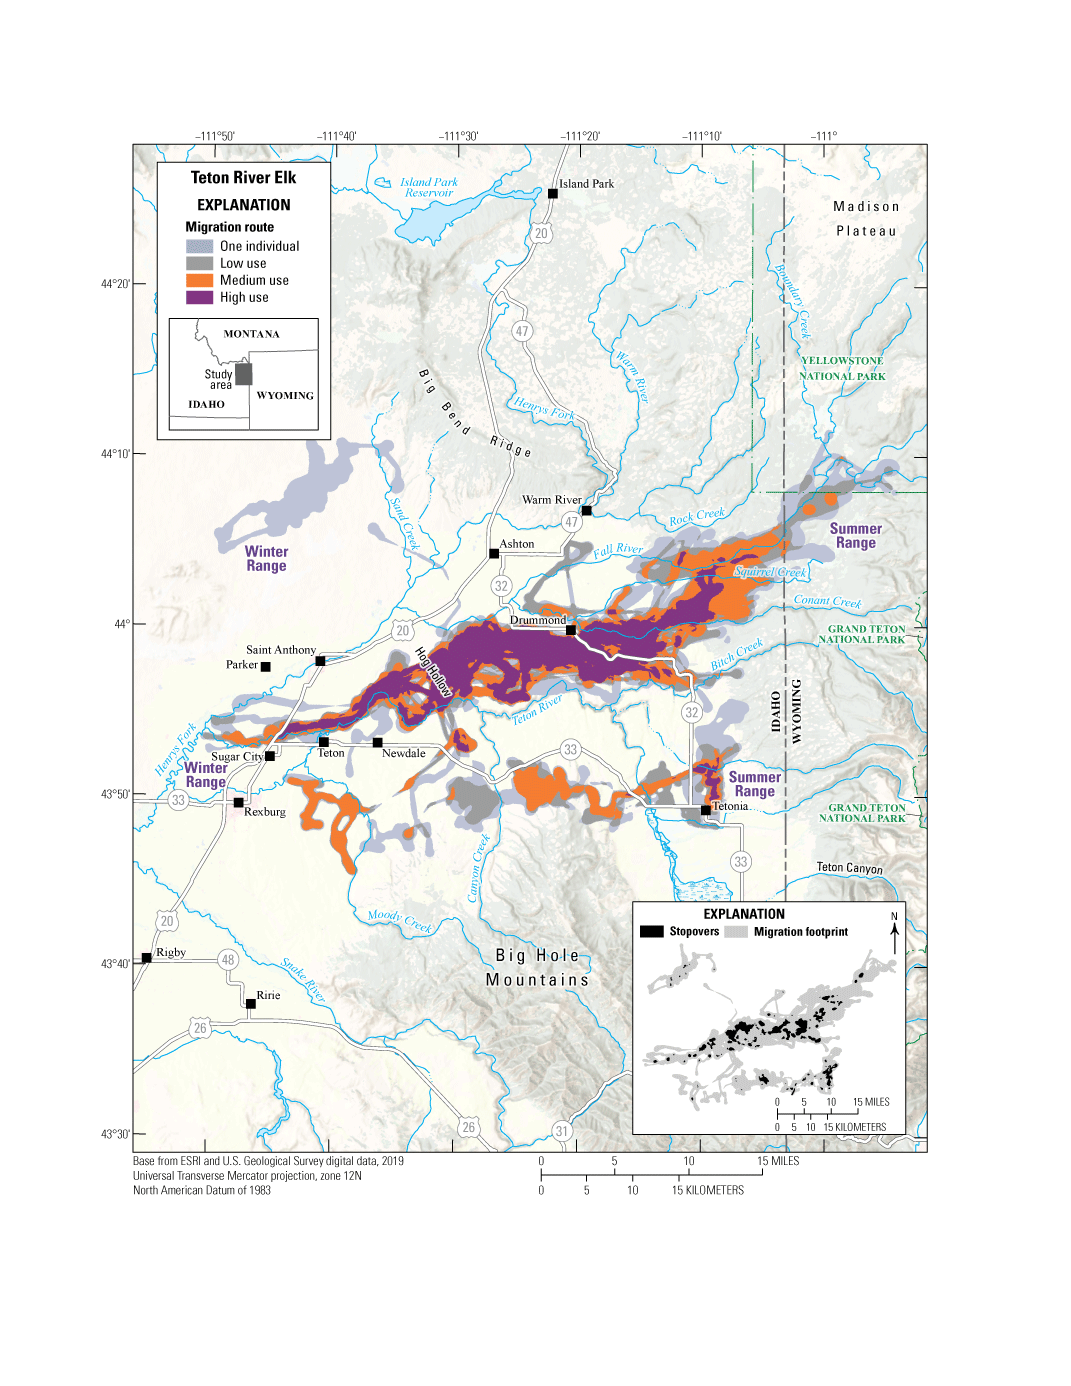
Migration routes and stopovers of the Teton River elk herd.
Animal Capture and Data Collection
-
Sample size: 23 adult female elk
-
Relocation frequency: 4−23.5 hours
-
Project duration: March 2018–February 2020
-
Data Analysis
-
Migration and stopover analysis: of 75 individual seasonal migrations, 46 used BBMM (Sawyer and others, 2009) with an 8-hour time lag; 15 used Fixed Motion Variance (1,000 m [3,281 ft]; see appendix 1 for further description) with a 14-hour time lag; 14 used Fixed Motion Variance (1,000 m [3,281 ft]) with a 27-hour time lag.
-
Delineation of migration periods: NSD (Bunnefeld and others, 2011)
-
Models derived from:
-
Migration: 75 sequences from 23 individuals (39 spring sequences, 36 fall sequences)
Migration and Stopover Summary
Migration start and end dates (median):
Average number of days migrating: Migration length: Migration area:Other Information
Project contacts:
-
Shane Roberts (shane.roberts@idfg.idaho.gov), Wildlife Research Supervisor, Idaho Department of Fish and Game
-
Mark Hurley (mark.hurley@idfg.idaho.gov), Principal Wildlife Research Biologist, Idaho Department of Fish and Game
-
Curtis Hendricks (curtis.hendricks@idfg.idaho.gov), Regional Wildlife Manager, Idaho Department of Fish and Game
-
Jacob Gray (jacob.gray@idfg.idaho.gov), Environmental Staff Biologist, Idaho Department of Fish and Game
-
Matt Pieron (matt.pieron@idfg.idaho.gov), Mule Deer Initiative Coordinator, Idaho Department of Fish and Game
-
Scott Bergen (scott.bergen@idfg.idaho.gov), Senior Wildlife Research Biologist, Idaho Department of Fish and Game
-
Jodi Berg, Senior Research Scientist, Wyoming Cooperative Fish and Wildlife Research Unit, University of Wyoming
-
Robert Ritson (robert.ritson@idfg.idaho.gov), Associate Research Scientist, Wyoming Cooperative Fish and Wildlife Research Unit, University of Wyoming
-
Hurley, M.A., and Roberts, S., 2020, F19AF00856 statewide wildlife research final performance report: Boise, Idaho, Idaho Department of Fish and Game, 62 p. [Also available at https://collaboration.idfg.idaho.gov/WildlifeTechnicalReports/F19AF00856%20Statewide%20Wildlife%20Research%20Final%20Report%20FY20.pdf.]
-
Meints, D., Ward, R., Knetter, J., Miyasaki, H., Oelrich, K., Mosby, C., Ellstrom, M., Roche, E., Elmer, M., Crea, S., Smith, D., Hribik, D., Hickey, C., Berkley, R., McDonald, M., Lockyer, Z., Hendricks, C., Painter, G., and Newman, D., 2020, F19AF00858 statewide surveys and inventory final performance report: Boise, Idaho, Idaho Department of Fish and Game, 20 p. [Also available at https://collaboration.idfg.idaho.gov/WildlifeTechnicalReports/F19AF00858%20Statewide%20Surveys%20%20Inventory%20Final%20Report%20FY20.pdf.]
Idaho | Elk
Trout Creek-Big Creek Elk
Trout Creek-Big Creek elk winter north of the Saint Joe River, east of Saint Joe, Idaho (fig. 46). The habitat is primarily mixed-conifer forest with agriculture in the valley. Much of their winter-range habitat is private timber company lands on south-facing slopes that were recently logged (Ellstrom and others, 2020). Most elk in this population migrate north and summer on the south side of the St. Joe Mountains. A few individuals continue north to the South Fork of the Coeur d’Alene River drainage, while others migrate south of the Saint Joe River. On average, these elk migrate almost 9 mi (14 km) between their summer and winter ranges. Trout Creek-Big Creek elk summer on a mix of private timber company and FS lands. Land use (logged compared to unlogged) probably affects seasonal migration routes and seasonal ranges.
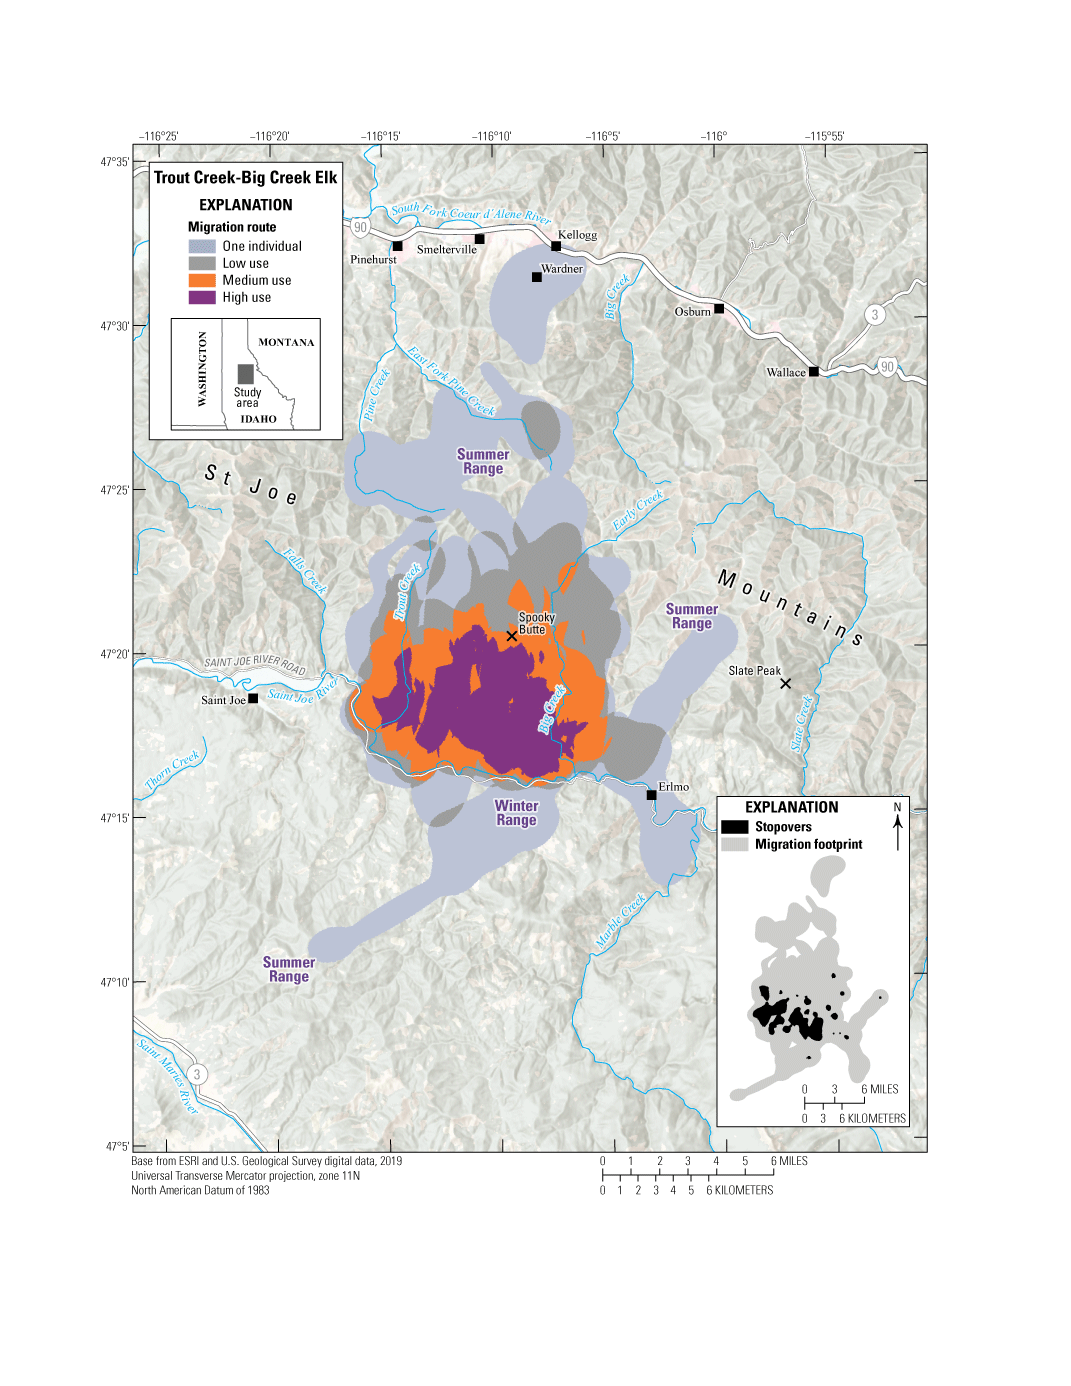
Migration routes and stopovers of the Trout Creek-Big Creek elk herd.
Data Analysis
-
Migration and stopover analysis: Of 68 individual seasonal migrations, 46 used Fixed Motion Variance (1,000 m [3,281 ft]; see appendix 1 for further description) with a 14-hour time lag; 22 used Fixed Motion Variance (1,000 m [3,281 ft]) with a 27-hour time lag.
-
Delineation of migration periods: NSD (Bunnefeld and others, 2011)
-
Models derived from:
-
Migration: 68 sequences from 31 individuals (44 spring sequences, 24 fall sequences)
Migration and Stopover Summary
Migration start and end dates (median):
Average number of days migrating: Migration length: Migration area:Other Information
Project contacts:
-
Shane Roberts (shane.roberts@idfg.idaho.gov), Wildlife Research Supervisor, Idaho Department of Fish and Game
-
Mark Hurley (mark.hurley@idfg.idaho.gov), Principal Wildlife Research Biologist, Idaho Department of Fish and Game
-
Laura Wolf (laura.wolf@idfg.idaho.gov), Regional Wildlife Biologist, Idaho Department of Fish and Game
-
Barb Moore (barb.moore@idfg.idaho.gov), Regional Wildlife Biologist, Idaho Department of Fish and Game
-
Scott Bergen (scott.bergen@idfg.idaho.gov), Senior Wildlife Research Biologist, Idaho Department of Fish and Game
-
Jodi Berg, Senior Research Scientist, Wyoming Cooperative Fish and Wildlife Research Unit, University of Wyoming
-
Robert Ritson (robert.ritson@idfg.idaho.gov), Associate Research Scientist, Wyoming Cooperative Fish and Wildlife Research Unit, University of Wyoming
-
Hurley, M.A., and Roberts, S., 2020, F19AF00856 statewide wildlife research final performance report: Boise, Idaho, Idaho Department of Fish and Game, 62 p. [Also available at https://collaboration.idfg.idaho.gov/WildlifeTechnicalReports/F19AF00856%20Statewide%20Wildlife%20Research%20Final%20Report%20FY20.pdf.]
-
Meints, D., Ward, R., Knetter, J., Miyasaki, H., Oelrich, K., Mosby, C., Ellstrom, M., Roche, E., Elmer, M., Crea, S., Smith, D., Hribik, D., Hickey, C., Berkley, R., McDonald, M., Lockyer, Z., Hendricks, C., Painter, G., and Newman, D., 2020, F19AF00858 statewide surveys and inventory final performance report: Boise, Idaho, Idaho Department of Fish and Game, 20 p. [Also available at https://collaboration.idfg.idaho.gov/WildlifeTechnicalReports/F19AF00858%20Statewide%20Surveys%20%20Inventory%20Final%20Report%20FY20.pdf.]
New Mexico | Elk
San Antonio Elk
The San Antonio elk herd migrates from the Rio Grande del Norte National Monument to the southern San Juan Mountains of north-central New Mexico and south-central Colorado (7,000–11,500 ft [2,134–3,505 m] elevation; fig. 47). Managed by the BLM, the Rio Grande del Norte National Monument contains the Taos Plateau and a portion of the Rio Grande. Data collected from the herd in 2020–2021 by GPS collars indicate that elk winter near San Antonio Mountain or east of U.S. Highway 285 on the Taos Plateau, with some elk wintering as far east as the Rio Grande. Other elk herds also winter on the Taos Plateau, including herds from the eastern side of the Rio Grande Gorge that are not featured in this report. Critical winter range consists primarily of sagebrush steppe, with pinyon-juniper dominating the volcanic cones of Cerro de la Olla, Cerro del Aire, Cerro Montoso, and Cerro Chiflo scattered across the monument land. The area north of the volcanic cones is rich in Ceratoides lanata (winterfat), providing nutrition high in protein during the harsh winters. Key terrestrial habitats across the herd’s ranges include intermountain basins, big sagebrush shrubland, Rocky Mountain alpine montane wet meadow, and Rocky Mountain montane mixed-conifer forest and woodland.
Within the Taos Plateau, 61,330 acres (24, 819 ha) have been identified as migration corridors, 218,962 acres (88, 611 ha) as winter range, and 100,191 acres (40,546 ha) as summer range for big-game species. Migrations typically begin in early spring, with elk taking extended stopovers in the eastern foothills and slopes of the San Juan Mountains, primarily along the Rio San Antonio. By late spring, many of the elk continue their migration towards the western slopes of the San Juan Mountains or north into Colorado. Some elk travel to lower elevation foothills along the western slopes of the San Juan Mountains before retracing some of their movements to settle on their high-elevation summer range. Summer range habitats are typically mid- to high-elevation mixed-conifer and aspen forests with interspersed montane meadows. The crossing of U.S. Highway 285 may create an obstacle to elk migrations, as 29 of 40 WVC in 2009–2018 involved elk.
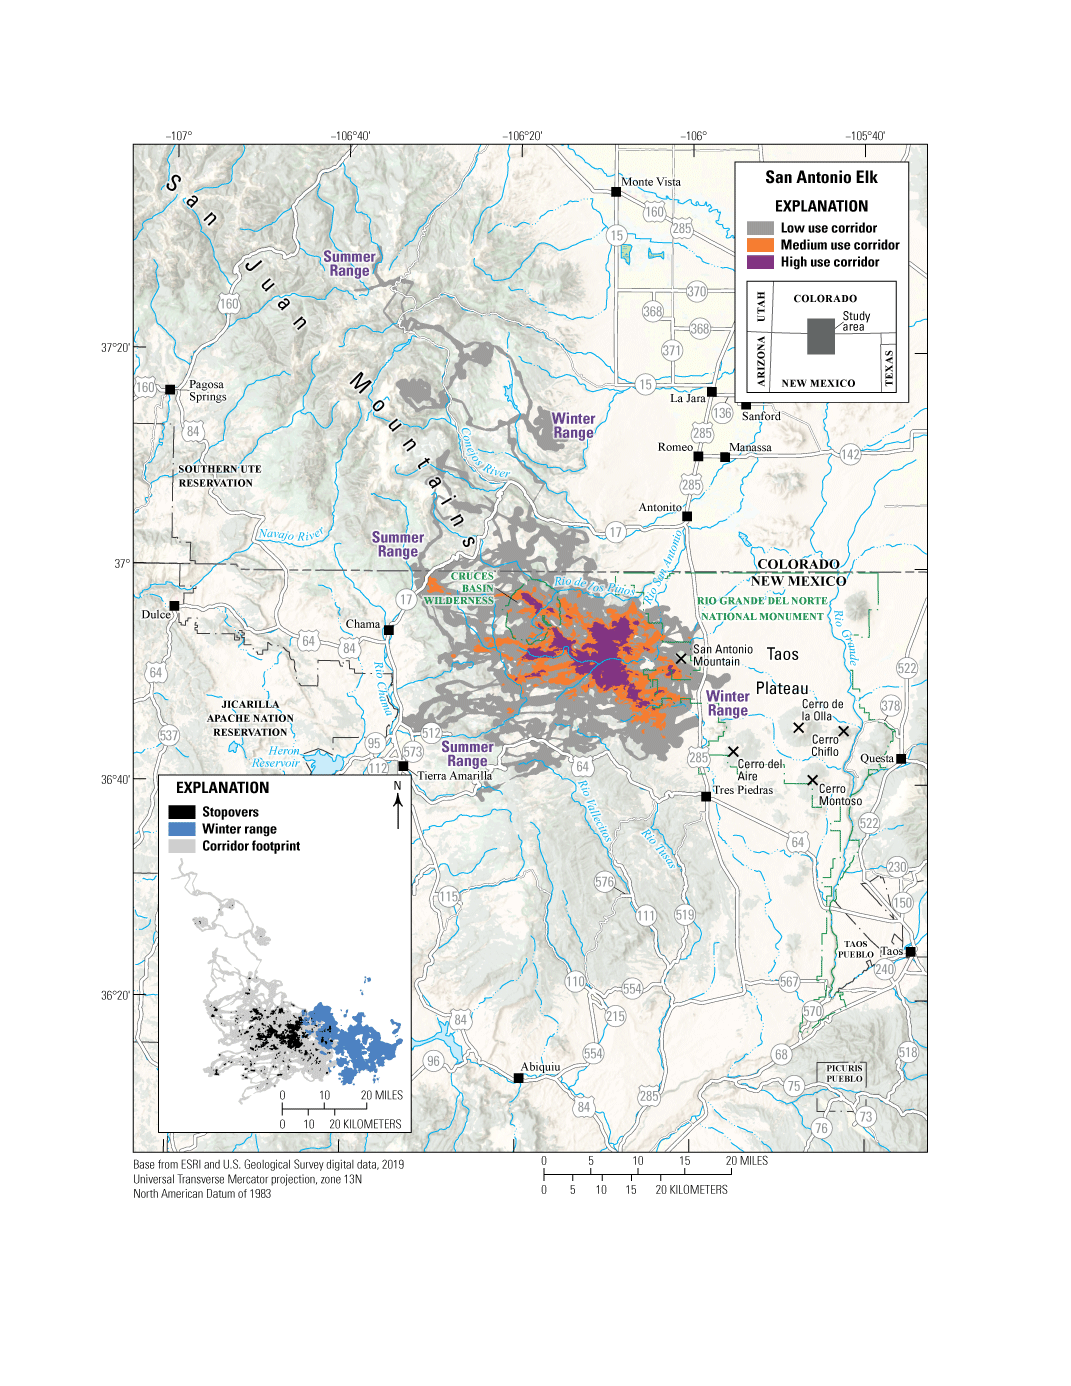
Migration corridors, stopovers, and winter ranges of the San Antonio elk herd.
Data Analysis
-
Corridor, stopover, and winter range analysis: BBMM (Sawyer and others, 2009)
-
Delineation of migration periods: NSD (Bunnefeld and others, 2011)
-
Models derived from:
-
Migration: 71 sequences from 31 individuals (39 spring sequences, 32 fall sequences)
-
Winter: 19 sequences from 18 individuals
Corridor and Stopover Summary
Migration start and end dates (median):
Average number of days migrating: Migration corridor length: Migration corridor area:Washington | Elk
Pend Oreille Elk
The Pend Oreille elk subherd is part of the larger Selkirk elk herd located in northeast Washington on nine GMUs: 101, 105, 108, 111, 113, 117, 121, 124, and 204. Elk used in this analysis were collared in GMUs 117 and 121 on winter ranges located east and west of Huckleberry Mountain, along the Colville River valley that splits the two GMUs, and west of the Pend Oreille River (fig. 48). In this area, private landowners manage 77 percent of the land (primarily for timber); the FS manages 16 percent; and the U.S. Fish and Wildlife Service, Washington State Department of Natural Resources, and BLM manage the remaining 7 percent. Montane conifer forests dominate the mid-to-higher elevations of the region, while agriculture predominates in the valley.
The Pend Oreille elk subherd is partially migratory, with three main migratory routes. A segment of the population traverses the northern portions of Huckleberry Mountain along Summit Valley, others migrate north of Chewelah Mountain following the South Fork Chewelah and Winchester Creeks, and another group migrates around Bald Mountain following the Buck Creek drainage. Elk move freely between GMUs 117 and 121, which is bisected by U.S. Highway 395 where some of the highest incidences of WVC are reported (G. Kalisz, Washington Department of Transportation, written commun.). Based on collared elk data, harvest and vehicle collisions are the primary and secondary causes of mortality, respectively, for adult females in this population. A large portion of the adult female harvest occurs on private property and in response to agricultural damage complaints.
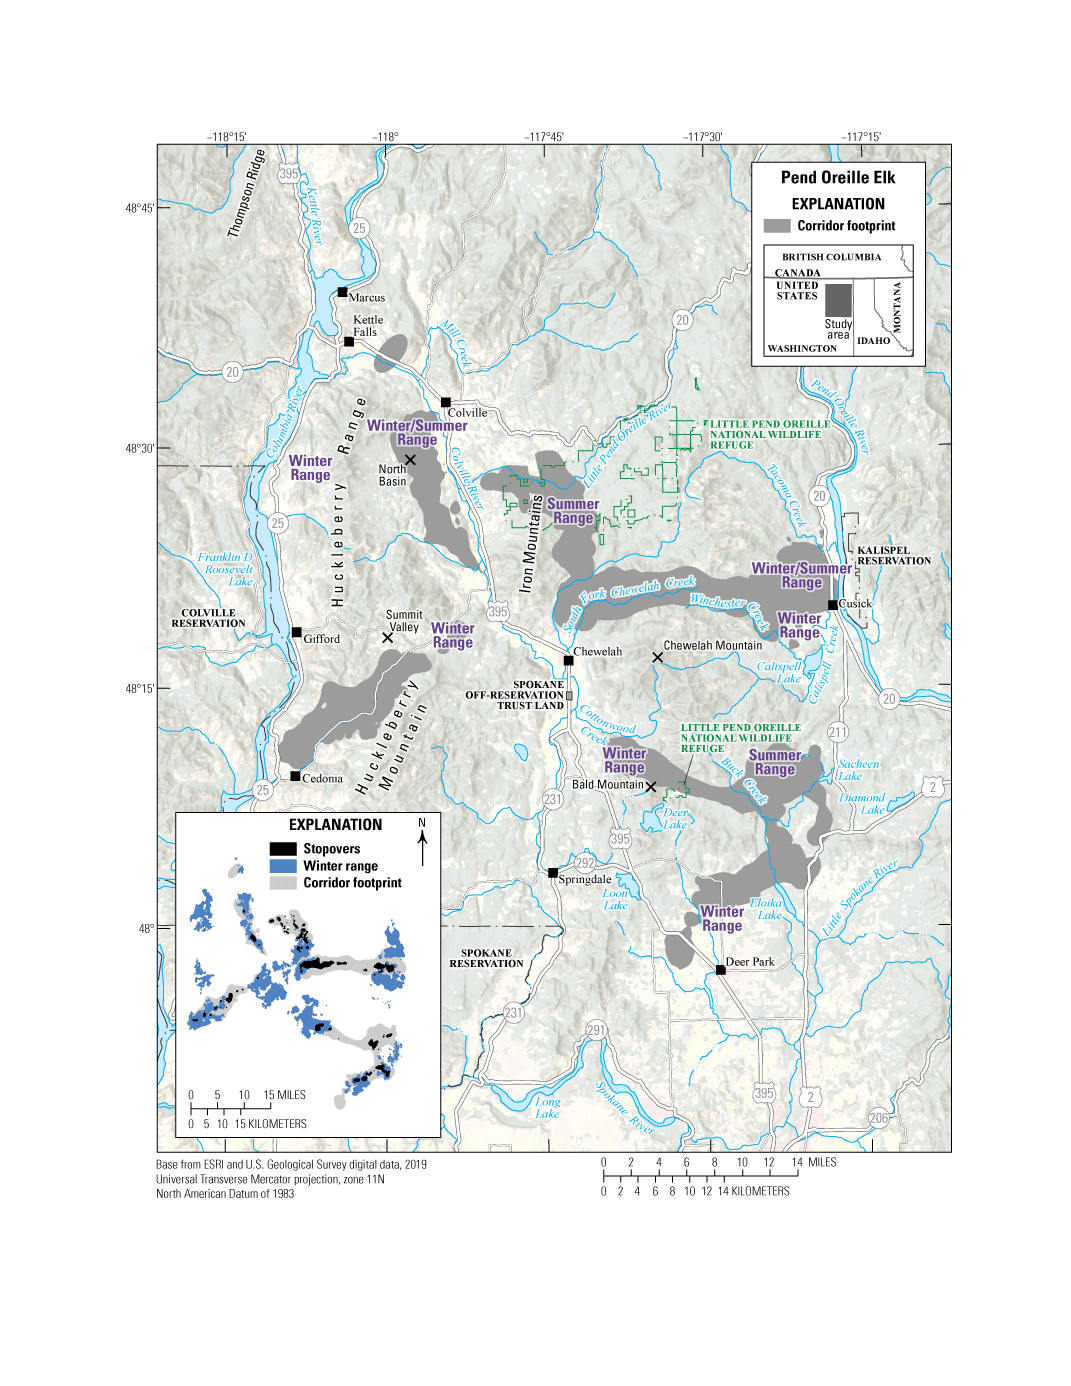
Migration corridor footprints, stopovers, and winter ranges of the Pend Oreille elk herd.
Animal Capture and Data Collection
-
Sample size: 63 adult female elk
-
Relocation frequency: 4 hours
-
Project duration: 2017–2021
-
Data Analysis
-
Corridor, stopover, and winter range analysis: BBMM (Sawyer and others, 2009)
-
Delineation of migration periods: NSD (Bunnefeld and others, 2011)
-
Models derived from:
-
Migration: 85 sequences from 17 individuals (47 spring sequences, 38 fall sequences)
-
Winter: 149 sequences from 56 individuals
Corridor and Stopover Summary
Migration start and end dates (median):
Average number of days migrating: Migration corridor length: Migration corridor area:Other Information
Project contacts:
-
Melia DeVivo (Melia.Devivo@dfw.wa.gov), Ungulate Research Scientist, Washington Department of Fish and Wildlife
-
Annemarie Prince (Annemarie.Prince@dfw.wa.gov), Wildlife Biologist, Washington Department of Fish and Wildlife
-
Benjamin Turnock (Benjamin.Turnock@dfw.wa.gov), Wildlife Biologist, Washington Department of Fish and Wildlife
-
Michel Laforge, Postdoctoral Researcher, University of Wyoming
-
Blake Lowrey, Research Scientist, University of Wyoming Cooperative Fish and Wildlife Research Unit
-
Washington Department of Fish and Wildlife, 2014, Selkirk elk herd plan: Olympia, Wa., Wildlife Program, Washington Department of Fish and Wildlife, 59 p. [Also available at https://wdfw.wa.gov/sites/default/files/publications/01350/wdfw01350.pdf.]
-
Washington Department of Fish and Wildlife, 2021, 2021 game status and trend report: Olympia, Wa., Wildlife Program, Washington Department of Fish and Wildlife, 407 p. [Also available at https://wdfw.wa.gov/sites/default/files/publications/02298/wdfw02298.pdf.]
Wyoming | Elk
Sierra Madre Elk
With substantial forest habitat in the Sierra Madre, the Sierra Madre elk population is one of the most productive elk herds in the state. Harvest from this herd typically accounts for approximately 10 percent of the total elk harvest in the state. The herd occupies typical year-round habitat for elk in Wyoming. They winter largely in expansive sagebrush growing in the foothills and at low elevations in the valley of the Little Snake River and its various drainages (fig. 49). In spring, most animals migrate to higher elevation forested habitat within the Sierra Madre. Like many elk herds, their seasonal migrations tend to be diffuse without a clear delineation of narrowly defined corridors; the average migration length is approximately 16 mi (25 km). Some animals migrate farther distances south across the border with Colorado, with a maximum length of 39 mi (62 km). The herd is estimated to be approximately 7,000 animals, although reliable population estimates are not available. The mountain pine beetle-epidemic has disturbed the herd’s summer habitat to a substantial degree, and has had a mixed effect on elk habitat. A recent study showed only a limited increase in forage in beetle-killed areas, although continued understory growth is expected (Lamont and others, 2019). Perhaps more importantly, elk and hunters alike tend to avoid the heavy downfall conditions created by dead and fallen snags (Lamont and others, 2020).
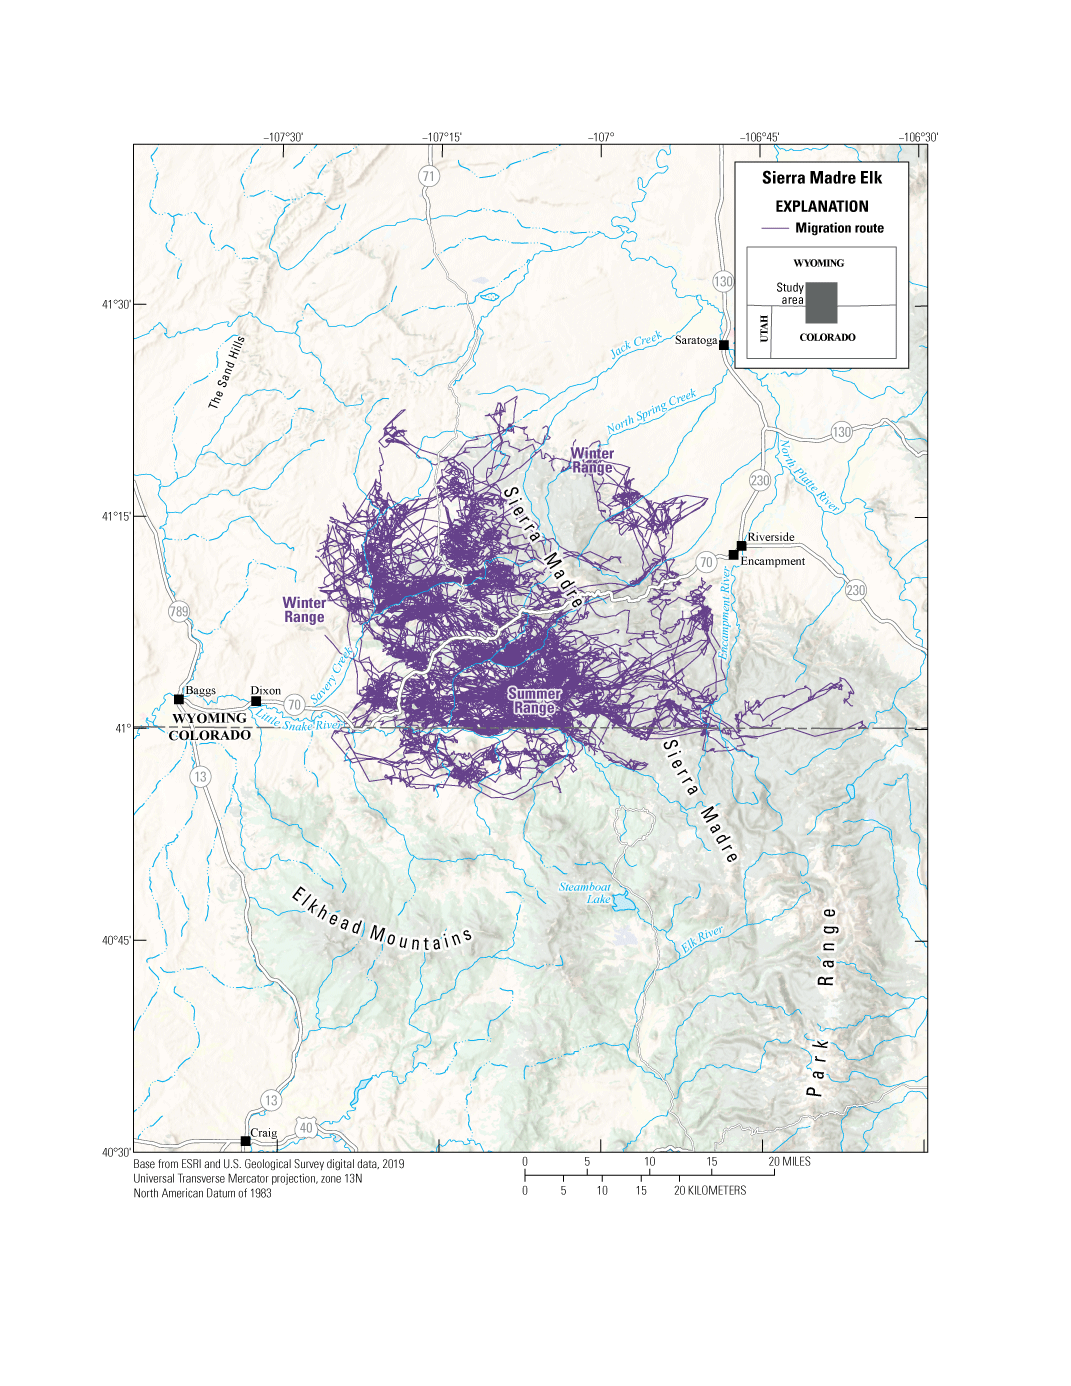
Migration routes of the Sierra Madre elk herd.
Data Analysis
-
Delineation of migration periods: NSD (Bunnefeld and others, 2011)
-
Models derived from:
-
Migration: 166 sequences from 50 individuals (86 spring sequences, 80 fall sequences)
-
Winter: 54 sequences from 31 individuals
Corridor and Stopover Summary
Migration start and end dates (median):
Average number of days migrating: Migration corridor length:Other Information
Project contacts:
-
Matthew Kauffman (mkauffm1@uwyo.edu), U.S. Geological Survey, Wyoming Cooperative Fish and Wildlife Research Unit
-
Lamont, B.G., Monteith, K.L., Merkle, J.A., Mong, T.W., Albeke, S.E., Hayes, M.M., and Kauffman, M.J., 2019, Multi‐scale habitat selection of elk in response to beetle‐killed forest: The Journal of Wildlife Management, v. 83, no. 3, p. 679–693. [Also available at https://doi.org/10.1002/jwmg.21631.]
-
Lamont, B.G., Kauffman, M.J., Merkle, J.A., Mong, T.W., Hayes, M.M., and Monteith, K.L., 2020, Bark beetle-affected forests provide elk only a marginal refuge from hunters: The Journal of Wildlife Management, v. 84, no. 3, p. 413–424. [Also available at https://doi.org/10.1002/jwmg.21814.]
Wyoming | Elk
South Rock Springs Elk
This small herd of elk is steadily establishing itself in the Greater Little Mountain Ecosystem in southwestern Wyoming. Elk in this system occupy some of the most arid seasonal ranges in the state, which contrasts with the more forested habitat that elk typically occupy in Wyoming. The herd is small but growing, with 920 animals counted during surveys in 2020. The habitat is a mix of broad valleys dominated by sagebrush habitat, with aspen, mountain shrubs, and pinyon-juniper at higher elevations. Elk in this system are not strongly migratory; like the mule deer that occupy this same landscape, the elk migrations tend to be relatively short with an average distance of 11 mi (18 km). However, there is a clear pattern to their seasonal movements, with winter ranges in the lower elevation habitat just east of Flaming Gorge Reservoir and summer ranges in the higher, more mountainous country to the east (fig. 50). In general, the herd is growing and appears to have few threats; however, the region more broadly is at risk of oil and gas development that would bring considerable human effects to an otherwise intact landscape.
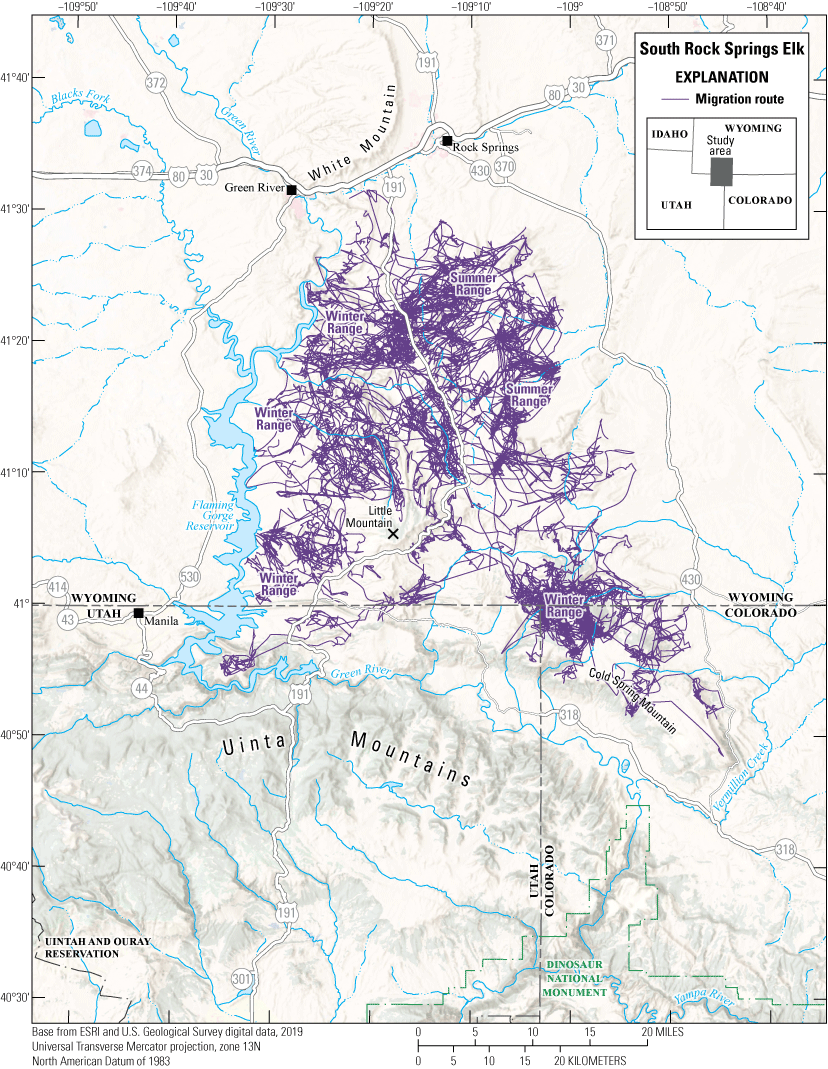
Migration routes of the South Rock Springs elk herd.
Animal Capture and Data Collection
-
Sample size: 49 adult female elk
-
Relocation frequency: Approximately 1 hour
-
Project duration: 2015−2019
-
Data Analysis
-
Delineation of migration periods: NSD (Bunnefeld and others, 2011)
-
Models derived from:
-
Migration: 142 sequences from 41 individuals (73 spring sequences, 69 fall sequences)
-
Winter: 125 sequences from 47 individuals
Corridor and Stopover Summary
Migration start and end dates (median):
Average number of days migrating: Migration corridor length:Other Information
Project contacts:
-
Kevin Monteith (kevin.monteith@uwyo.edu), Associate Professor, University of Wyoming
-
Sean Yancey (sean.yancey@wyo.gov), Regional Wildlife Coordinator, Wyoming Game and Fish Department
-
Huggler, K., 2019, Eye for an eye—Predator-prey dynamics from the lens of both predator and prey: Laramie, Wyo., University of Wyoming, M.S. thesis, p. 1–102.
-
Huggler, K.S., Holbrook, J.D., Burke, P.W., Zornes, M., Thompson, D.J., Clapp, J.G., Lionberger, P., Valdez, M., and Monteith, K.L, 2022, Risky business—How a herbivore navigates spatiotemporal aspects of risk from competitors and predators: Ecological Applications, e2648, 17 p. [Also available at http://doi.org/10.1002/eap.2648.]
References Cited
Aikens, E.O., Kauffman, M.J., Merkle, J.A., Dwinnell, S.P.H., Fralick, G.L., and Monteith, K.L., 2017, The greenscape shapes surfing of resource waves in a large migratory herbivore: Ecology Letters, v. 20, no. 6, p. 741–750. [Also available at https://doi.org/10.1111/ele.12772.] https://doi.org/10.1111/ele.12772
Aikens, E.O., Wyckoff, T.B., Sawyer, H., and Kauffman, M.J., 2022, Industrial energy development decouples ungulate migration from the green wave: Nature Ecology & Evolution, v. 6, p. 1733–1741. [Also available at https://doi.org/10.1038/s41559-022-01887-9.] https://doi.org/10.1038/s41559-022-01887-9
Arizona Department of Transportation, 2021, Average annual daily traffic report 2021: Arizona Department of Transportation web page, accessed July 21, 2022, at https://azdot.gov/sites/default/files/media/2022/07/2021-AADT-Interstate.pdf.
Bernales, H., Hersey, K., and Jones, C., 2020, Utah big game annual report 2020: Salt Lake City, Utah, Utah Division of Wildlife Resources, 224 p. [Also available at https://wildlife.utah.gov/pdf/annual_reports/big_game/20_bg_report.pdf.]
Bodie, W.L., Jensen, C., Hanna, P., Dunbar, M., Jensen, D., Johnson, P., Sherwood, B., DeShon, F., Norrie, K.D., Oldenburg, L.E., Thiessen, J.L., Williams, R.M., and Greenley, J.C., 1979, Project W-170-R-3—Job progress report: Boise, Idaho, Idaho Department of Fish and Game, 56 p. [Also available at https://collaboration.idfg.idaho.gov/WildlifeTechnicalReports/Pronghorn%20PR79.pdf.]
Bunnefeld, N., Borger, L., van Moorter, B., Rolandsen, C.M., Dettki, H., Solberg, E.J., and Ericsson, G., 2011, A model‐driven approach to quantify migration patterns—Individual, regional and yearly differences: Journal of Animal Ecology, v. 80, no. 2, p. 466–476. [Also available at https://doi.org/10.1111/j.1365-2656.2010.01776.x.] https://doi.org/10.1111/j.1365-2656.2010.01776.x
Cagnacci, F., Focardi, S., Heurich, M., Stache, A., Hewison, A.M., Morellet, N., Kjellander, P., Linnell, J.D., Mysterud, A., Neteler, M., Delucchi, L., Ossi, F., and Urbano, F., 2011, Partial migration in roe deer—Migratory and resident tactics are end points of a behavioural gradient determined by ecological factors: Oikos, v. 120, no. 12, p. 1790–1802. [Also available at https://doi.org/10.1111/j.1600-0706.2011.19441.x.] https://doi.org/10.1111/j.1600-0706.2011.19441.x
California Department of Fish and Wildlife, [CDFW], 2022, California’s deer population estimates: California Department of Fish and Wildlife web page, accessed July 21, 2022, at https://wildlife.ca.gov/Conservation/Mammals/Deer/Population#32712445-population-by-hunt-zone.
Chapman, B.B., Brönmark, C., Nilsson, J., and Hansson, L., 2011, The ecology and evolution of partial migration: Oikos, v. 120, no. 12, p. 1764–1775. [Also available at https://doi.org/10.1111/j.1600-0706.2011.20131.x.] https://doi.org/10.1111/j.1600-0706.2011.20131.x
Coe, P.K., Nielson, R.M., Jackson, D.H., Cupples, J.B., Seidel, N.E., Johnson, B.K., Gregory, S.C., Bjornstrom, G.A., Larkins, A.N., and Speten, D.A., 2015, Identifying migration corridors of mule deer threatened by highway development: Wildlife Society Bulletin, v. 39, no. 2, p. 256–267. [Also available at https://doi.org/10.1002/wsb.544.] https://doi.org/10.1002/wsb.544
Cristescu, B., Elbroch, L.M., Forrester, T.D., Allen, M.L., Spitz, D.B., Wilmers, C.C., and Wittmer, H.U., 2022, Standardizing protocols for determining the cause of mortality in wildlife studies: Ecology and Evolution, v. 12, no. 6. [Also available at https://doi.org/10.1002/ece3.9034.] https://doi.org/10.1002/ece3.9034
Davies, K.W., and Boyd, C.S., 2019, Ecological effects of free-roaming horses in North American rangelands: Bioscience, v. 69, no. 7, p. 558–565. [Also available at https://doi.org/10.1093/biosci/biz060.] https://doi.org/10.1093/biosci/biz060
Duffield, J., and Holliman, J., 1988, The net economic value of elk hunting in Montana: Helena, Mont., Montana Department of Fish, Wildlife, and Parks, 92 p. [Also available at https://archive.org/details/B55D9C76-4A8A-4A30-8711-38EDB312FA55/page/n91/mode/2up.]
Ellstrom, M., Hickey, C., Walrath, R., Berkley, R., McDonald, M., Lockyer, Z., Hendricks, C., Newman, D., Roche, E., and Smith, D., 2020, Statewide report fall 2019 season—Elk: Boise, Idaho, Idaho Department of Fish and Game, 193 p. [Also available at https://collaboration.idfg.idaho.gov/WildlifeTechnicalReports/Elk%20Statewide%20FY2020.pdf.]
Frank, D.A., and Evans, R.D., 1997, Effects of native grazers on grassland N cycling in Yellowstone National Park: Ecology, v. 78, no. 7, p. 2238–2248. [Also available at https://doi.org/10.1890/0012-9658(1997)078[2238:EONGOG]2.0.CO;2.]
Fryxell, J.M., and Sinclair, A.R.E., 1988, Causes and consequences of migration by large herbivores: Trends in Ecology & Evolution, v. 3, no. 9, p. 237–241. [Also available at https://doi.org/10.1016/0169-5347(88)90166-8.] https://doi.org/10.1016/0169-5347(88)90166-8
Gigliotti, L.C., Xu, W., Zuckerman, G.R., Atwood, M.P., Cole, E.K., Courtemanch, A., Dewey, S., Gude, J.A., Hnilicka, P., Hurley, M., and Kaufmann, M., 2022, Wildlife migrations highlight importance of both private lands and protected areas in the Greater Yellowstone Ecosystem: Biological Conservation, v. 275, p. 1–9. [Also available at https://doi.org/10.016/j.biocon.2022.109752.] https://doi.org/10.1016/j.biocon.2022.109752
Hill, S.C., and Figura, P.J., 2020, Migration and seasonal ranges of the Eastern Tehama deer herd in northern California: California Fish and Wildlife Journal, v. 106, p. 170–185. [Also available at https://doi.org/10.51492/cfwj.106.11.]
Hobbs, N.T., 1996, Modification of ecosystems by ungulates: The Journal of Wildlife Management, v. 60, no. 4, p. 695–713. [Also available at https://doi.org/10.2307/3802368.] https://doi.org/10.2307/3802368
Horne, J., Garton, E.O., Krone, S.M., and Lewis, J.S., 2007, Analyzing animal movements using Brownian bridges: Ecology, v. 88, no. 9, p. 2354–2363. [Also available at https://doi.org/10.1890/06-0957.1.] https://doi.org/10.1890/06-0957.1
Huggler, K.S., Holbrook, J.D., Burke, P.W., Zornes, M., Thompson, D.J., Clapp, J.G., Lionberger, P., Valdez, M., and Monteith, K.L, 2022, Risky business—How a herbivore navigates spatiotemporal aspects of risk from competitors and predators: Ecological Society of America, Ecological Applications, e2648, 17 p. [Also available at https://doi.org/10.1002/eap.2648.]
Hurley, M.A., and Roberts, S., 2020, F19AF00856 statewide wildlife research final performance report: Boise, Idaho, Idaho Department of Fish and Game, 62 p. [Also available at https://collaboration.idfg.idaho.gov/WildlifeTechnicalReports/F19AF00856%20Statewide%20Wildlife%20Research%20Final%20Report%20FY20.pdf.]
Idaho Transportation Department [2022], Rocky Point wildlife crossing: Idaho Transportation Department Projects web page, accessed July 19, 2022, at https://itdprojects.org/projects/rocky-point-wildlife-crossing/.
Jakes, A.F., Jones, P.F., Paige, L.C., Seidler, R.G., and Huijser, M.P., 2018, A fence runs through it—A call for greater attention to the influence of fences on wildlife and ecosystems: Biological Conservation, v. 227, p. 310–318. [Also available at https://doi.org/10.1016/j.biocon.2018.09.026.] https://doi.org/10.1016/j.biocon.2018.09.026
Kauffman, M.J., Aikens, E.O., Esmaeili, S., Kaczensky, P., Middleton, A., Monteith, K.L., Morrison, T.A., Mueller, T., Sawyer, H., and Goheen, J.R., 2021a, Causes, consequences, and conservation of ungulate migration: Annual Review of Ecology, Evolution, and Systematics, v. 52, p. 453–478. [Also available at https://doi.org/10.1146/annurev-ecolsys-012021-011516.] https://doi.org/10.1146/annurev-ecolsys-012021-011516
Kauffman, M.F., Cagnacci, F., Chamaillé-Jammes, S., Hebblewhite, M., Hopcraft, J.G.C., Merkle, J.A., Mueller, T., Mysterud, A., Peters, W., Roettger, C., Steingisser, A., Meacham, J.E., Abera, K., Adamczewski, J., Aikens, E.O., Bartlam-Brooks, H., Bennitt, E., Berger, J., Boyd, C., Côté, S.D., Debeffe, L., Dekrout, A.S., Dejid, N., Donadio, E., Dziba, L., Fagan, W.F., Fischer, C., Focardi, S., Fryxell, J.M., Fynn, R.W.S., Geremia, C., González, B.A., Gunn, A., Gurarie, E., Heurich, M., Hilty, J., Hurley, M., Johnson, A., Joly, K., Kaczensky, P., Kendall, C.J., Kochkarev, P., Kolpaschikov, L., Kowalczyk, R., van Langevelde, F., Li, B.V., Lobora, A.L., Loison, A., Madiri, T.H., Mallon, D., Marchand, P., Medellin, R.A., Meisingset, E., Merrill, E., Middleton, A.D., Monteith, K.L., Morjan, M., Morrison, T.A., Mumme, S., Naidoo, R., Novaro, A., Ogutu, J.O., Olson, K.A., Oteng-Yeboah, A., Ovejero, R.J.A., Owen-Smith, N., Paasivaara, A., Packer, C., Panchenko, D., Pedrotti, L., Plumptre, A.J., Rolandsen, C.M., Said, S., Salemgareyev, A., Savchenko, A., Savchenko, P., Sawyer, H., Selebatso, M., Skroch, M., Solberg, E., Stabach, J.A., Strand, O., Suitor, M.J., Tachiki, Y., Trainor, A., Tshipa, A., Virani, M.Z., Vynne, C., Ward, S., Wittemyer, G., Xu, W., and Zuther, S., 2021b, Mapping out a future for ungulate migrations: Science, v. 372, no. 6542, p. 566–569. [Also available at https://doi.org/10.1126/science.abf0998.] https://doi.org/10.1126/science.abf0998
Kauffman, M.J., Copeland, H.E., Berg, J., Bergen, S., Cole, E., Cuzzocreo, M., Dewey, S., Fattebert, J., Gagnon, J., Gelzer, E., Geremia, C., Graves, T., Hersey, K., Hurley, M., Kaiser, J., Meacham, J., Merkle, J., Middleton, A., Nuñez, T., Oates, B., Olson, D., Olson, L., Sawyer, H., Schroeder, C., Sprague, S., Steingisser, A., and Thonhoff, M., 2020a, Ungulate migrations of the western United States—Volume 1: U.S. Geological Survey Scientific Investigations Report 2020–5101, 119 p. [Also available at https://doi.org/10.3133/sir20205101.] https://doi.org/10.3133/sir20205101
Kauffman, M.J., Copeland, H., Berg, J., Bergen, S., Cole, E., Cuzzocreo, M., Dewey, S., Fattebert, J., Gagnon, J., Gelzer, E., Graves, T., Hersey, K., Kaiser, R., Meacham, J., Merkle, J., Middleton, A., Nuñez, T., Oates, B., Olson, D., Olson, L., Sawyer, H., Schroeder, C., Sprague, S., Steingisser, A., and Thonhoff, M., 2020b, Ungulate migrations of the western United States—Volume 1: U.S. Geological Survey data release, https://doi.org/10.5066/P9O2YM6I.
Kauffman, M.J., Lowrey, B., Beck, J., Berg, J., Bergen, S., Berger, S., Cain, J., Dewey, S., Diamond, J., Duvuvuei, O., Fattebert, J., Gagnon, J., Garcia, J., Greenspan, E., Hall, E., Harper, G., Harter, S., Hersey, K., Hnilicka, P., Hurley, M., Knox, L., Lawson, A., Maichak, E., Meacham, J., Merkle, J., Middleton, A., Olson, D., Olson, L., Reddell, C., Robb, B., Rozman, G., Sawyer, H., Schroeder, C., Scurlock, B., Short, J., Sprague, S., Steingisser, A., and Tatman, N., 2022a, Ungulate migrations of the western United States—Volume 2: U.S. Geological Survey Scientific Investigations Report 2022–5008, 160 p. [Also available at https://doi.org/10.3133/sir20225008.] https://doi.org/10.3133/sir20225008
Kauffman, M.J., Lowrey, B., Beck, J., Berg, J., Bergen, S., Berger, S., Cain, J., Dewey, S., Diamond, J., Duvuvuei, O., Fattebert, J., Gagnon, J., Garcia, J., Greenspan, E., Hall, E., Harper, G., Harter, S., Hersey, K., Hnilicka, P., Hurley, M., Knox, L., Lawson, A., Maichak, E., Meacham, J., Merkle, J., Middleton, A., Olson, D., Olson, L., Reddell, C., Robb, B., Rozman, G., Sawyer, H., Schroeder, C., Scurlock, B., Short, J., Sprague, S., Steingisser, A., and Tatman, N., 2022b, Ungulate migrations of the western United States—Volume 2: U.S. Geological Survey data release, https://doi.org/10.5066/P9TKA3L8.
Kauffman, M.J., Lowrey, B., Berg, J., Bergen, S., Brimeyer, D., Burke, P., Cufaude, T., Cain, J.W., Cole, J., Courtemanch, A., Cowardin, M., Cunningham, J., DeVivo, M., Diamond, J., Duvuvuei, O., Fattebert, J., Ennis, J., Finley, D., Fort, J., Fralick, G., Freeman, E., Gagnon, J., Garcia, J., Gelzer, E., Graham, M., Gray, J., Greenspan, E., Hall, E., Hendricks, C., Holland, A., Holms, B., Huggler, K., Hurley, M., Jeffreys, E., Johnson, A., Knox, L.,Krasnow, K., Lockyer, Z., Manninen, H., McDonald, M., McKee, J.L., Meacham, J., Merkle, J., Moore, B., Mong, T.W., Nielsen, C., Oates, B., Olson, K., Olson, D., Olson, L., Pieron, M., Powell, J., Prince, A., Profitt, K., Reddell, C., Riginos, C., Ritson, R., Robatcek, S., Roberts, S., Sawyer, H., Schroeder, C., Shapiro, J., Simpson, N., Sprague, S., Steingisser, A., Tatman, N., Turnock, B., Wallace, C., and Wolf, L., 2022c, Ungulate migrations of the western United States—Volume 3: U.S. Geological Survey data release, https://doi.org/10.5066/P9LSKEZQ.
Kampschror, B., 2017, Wyoming breaks ground on underpasses for Jackson Hole wildlife: Greater Yellowstone Coalition Blog, June 12, 2017, accessed July 18, 2022, at https://greateryellowstone.org/blog/2017/7/7/wyoming-breaks-ground-on-underpasses-for-jackson-hole-wildlife.
Kintsch, J., Basting, P., McClure, M., and Clarke, J.O., 2019, Western slope wildlife prioritization study: Denver, Colo., Colorado Department of Transportation web page, accesses August 9, 2022, at https://www.codot.gov/programs/research/pdfs/2019/WSWPS/wswps_final_report_april_2019-revised-5-3-2019-copy.pdf.]
Lambert, M.S., Sawyer, H., and Merkle, J., 2022, Response to natural gas development differ by season for two migratory ungulates: Ecological Applications, e2652. [Also available at https://doi.org/10.1002/eap.2652.]
Lamont, B.G., Kauffman, M.J., Merkle, J.A., Mong, T.W., Hayes, M.M., and Monteith, K.L., 2020, Bark beetle-affected forests provide elk only a marginal refuge from hunters: The Journal of Wildlife Management, v. 84, no. 3, p. 413–424. [Also available at https://doi.org/10.1002/jwmg.21814.] https://doi.org/10.1002/jwmg.21814
Lamont, B.G., Monteith, K.L., Merkle, J.A., Mong, T.W., Albeke, S.E., Hayes, M.M., and Kauffman, M.J., 2019, Multi‐scale habitat selection of elk in response to beetle‐killed forest: The Journal of Wildlife Management, v. 83, no. 3, p. 679–693. [Also available at https://doi.org/10.1002/jwmg.21631.] https://doi.org/10.1002/jwmg.21631
Lowrey, B., McWhirter, D.E., Proffitt, K.M., Monteith, K.L., Courtemanch, A.B., White, P.J., Paterson, J.T., Dewey, S.R., and Garrott, R.A., 2020, Individual variation creates diverse migratory portfolios in native populations of a mountain ungulate: Ecological Applications, v. 30, no. 5. [Also available at https://doi.org/10.1002/eap.2106.] https://doi.org/10.1002/eap.2106
McInturff, A., Xu, W., Wilkinson, C.E., Dejid, N., and Brashares, J.S., 2020, Fence ecology—Frameworks for understanding the ecological effects of fences: Bioscience, v. 70, no. 11, p. 971–985. [Also available at https://doi.org/10.1093/biosci/biaa103.] https://doi.org/10.1093/biosci/biaa103
Meints, D., Ward, R., Knetter, J., Miyasaki, H., Oelrich, K., Mosby, C., Ellstrom, M., Roche, E., Elmer, M., Crea, S., Smith, D., Hribik, D., Hickey, C., Berkley, R., McDonald, M., Lockyer, Z., Hendricks, C., Painter, G., and Newman, D., 2020, F19AF00858 statewide surveys and inventory final performance report: Boise, Idaho, Idaho Department of Fish and Game, 20 p. [Also available at https://collaboration.idfg.idaho.gov/WildlifeTechnicalReports/F19AF00858%20Statewide%20Surveys%20%20Inventory%20Final%20Report%20FY20.pdf.]
Merkle, J.A., Monteith, K.L., Aikens, E.O., Hayes, M.M., Hersey, K.R., Middleton, A.D., Oates, B.A., Sawyer, H., Scurlock, B.M., and Kauffman, M.J., 2016, Large herbivores surf waves of green-up during spring: Proceedings of the Royal Society B, Biological Sciences, v. 283, no. 1833. [Also available at https://doi.org/10.1098/rspb.2016.0456.] https://doi.org/10.1098/rspb.2016.0456
Merkle, J.A., Gage, J., Sawyer, H., Lowrey, B., and Kaufmann, M.J., 2022, Migration Mapper—identifying movement corridors and seasonal ranges for large mammal conservation: Methods in Ecology and Evolution, v. 13, p. 2397–2403. [https://doi.org/10.1111/2041-210X.13976.].
Middleton, A.D., Merkle, J.A., McWhirter, D.E., Cook, J.G., Cook, R.C., White, P.J., and Kauffman, M.J., 2018, Green-wave surfing increases fat gain in a migratory ungulate: Oikos, v. 127, no. 7, p. 1060–1068. [Also available at https://doi.org/10.1111/oik.05227.] https://doi.org/10.1111/oik.05227
Middleton, A.D., Sawyer, H., Merkle, J.A., Kauffman, M.J., Cole, E.K., Dewey, S.R., Gude, J.A., Gustine, D.D., McWhirter, D.E., Proffitt, K.M., and White, P.J., 2020, Conserving transboundary wildlife migrations—Recent insights from the Greater Yellowstone Ecosystem: Frontiers in Ecology and the Environment, v. 18, no. 2, p. 83–91. [Also available at https://doi.org/10.1002/fee.2145.] https://doi.org/10.1002/fee.2145
Milligan, M.C., Johnston, A.N., Beck, J.L., Smith, K.T., Taylor, K.L., Hall, E., Knox, L., Cufaude, T., Wallace, C., Chong, G., and Kauffman, M.J, 2021, Variable effects of wind-energy development on seasonal habitat selection of pronghorn: Ecosphere, v. 12, no. 12. [Also available at https://doi.org/10.1002/ecs2.3850.] https://doi.org/10.1002/ecs2.3850
Myers, W.L., Chang, W.Y., Germaine, S.S., VanderHaegen, W.M., and Owens, T.E., 2008, An analysis of deer and elk-vehicle collision sites along state highways in Washington State: Olympia, Wash., Washington Department of Fish and Wildlife, 41 p. [Also available at https://wdfw.wa.gov/sites/default/files/publications/01551/wdfw01551.pdf.]
Nandintsetseg, D., Bracis, C., Olson, K.A., Böhning‐Gaese, K., Calabrese, J.M., Chimeddorj, B., Fagan, W.F., Fleming, C.H., Heiner, M., Kaczensky, P., Leimgruber, P., Munkhnast, D., Stratmann, T., and Mueller, T., 2019, Challenges in the conservation of wide-ranging nomadic species: Journal of Applied Ecology, v. 56, no. 8, p. 1916–1926. [Also available at https://doi.org/10.1111/1365-2664.13380.]
National Park Service, 2021, Canyon de Chelly National Monument: U.S. Department of the Interior, National Park Service web page. [Also available at https://www.nps.gov/cach/index.htm.]
Nevada Department of Wildlife, 2021, 2020-2021 Big game status: Reno, Nev., Nevada Department of Wildlife, 117 p. [Also available at https://www.ndow.org/wp-content/uploads/2022/01/2020-21-BIG-GAME-STATUS-BOOK-COMPLETE.pdf.]
Rayl, N.D., Proffitt, K.M., Almberg, E.S., Jones, J.D., Merkle, J.A., Gude, J.A., and Cross, P.C., 2019, Modeling elk-to-livestock transmission risk to predict hotspots of brucellosis spillover: The Journal of Wildlife Management, v. 83, no. 4, p. 817–829. [Also available at https://doi.org/10.1002/jwmg.21645.] https://doi.org/10.1002/jwmg.21645
Redsteer, M.H., Kelley, K.B., Francis, H., and Block, D., 2013, Increasing vulnerability of the Navajo people to drought and climate change in the southwestern United States—Accounts from Tribal elders, in Special report on indigenous people, marginalized populations and climate change: Cambridge, Cambridge University Press, p. 171–187.
Riginos, C., Krasnow, K., Hall, E., Graham, M., Sundaresan, S., Brimeyer, D., Fralick, G., and Wachob, D., 2013, Mule deer (Odocoileus hemionus) movement and habitat use patterns in relation to roadways in northwest Wyoming: Jackson, Wyo., Conservation Research Center, Teton Science Schools, 72 p. [Also available at http://www.corinnariginos.com/resources/MD_Final_Report_RS03210.pdf.]
Riginos, C., Fairbank, E., Hansen, E., Kolek, J., and Huijser, M.P., 2022, Reduced speed limit is ineffective for mitigating the effects of roads on ungulates: Conservation Science and Practice, v. 4, no. 3. [Also available at https://doi.org/10.1111/csp2.618.] https://doi.org/10.1111/csp2.618
Robb, B.S., Merkle, J.A., Sawyer, H., Beck, J.L., and Kauffman, M.J., 2022, Nowhere to run—Semi-permeable barriers affect pronghorn space use: The Journal of Wildlife Management, v. 86, no. 4. [Also available at https://doi.org/10.1002/jwmg.22212.] https://doi.org/10.1002/jwmg.22212
Ryan, H.J., 2015, Keeping it together—Large landscape conservation in the Upper Green River, Wyoming: Sage Grouse Initiative, January 28, 2015, accessed July 18, 2022, at https://www.sagegrouseinitiative.com/keeping-together-large-landscape-conservation-upper-green-river/.
Sawyer, H., Hayes, M., Rudd, B., and Kauffman, M., 2014, The Red Desert to Hoback—Mule deer migration assessment: Laramie, Wyo., University of Wyoming, Wyoming Migration Initiative, 52 p. [Also available at https://migrationinitiative.org/sites/migration.wygisc.org/themes/responsive_blog/images/RDH_Migration_Assessment_Final.pdf.]
Sawyer, H., Kauffman, M.J., Middleton, A.D., Morrison, T.A., Nielson, R.M., and Wyckoff, T.B., 2013, A framework for understanding semi-permeable barrier effects on migratory ungulates: Journal of Applied Ecology, v. 50, no. 1, p. 68–78. [Also available at https://doi.org/10.1111/1365-2664.12013.] https://doi.org/10.1111/1365-2664.12013
Sawyer, H., Kauffman, M.J., Nielson, R.M., and Horne, J.S., 2009, Identifying and prioritizing ungulate migration routes for landscape-level conservation: Ecological Applications, v. 19, no. 8, p. 2016–2025. [Also available at https://doi.org/10.1890/08-2034.1.] https://doi.org/10.1890/08-2034.1
Sawyer, H., Korfanta, N., Kauffman, M., Telander, A., Robb, B., and Mattson, T., 2022, Tradeoffs with utility-scale solar development and ungulates on western rangelands: Frontiers in Ecology and the Environment. [Also available at https://doi.org/10.1002/fee.2498.] https://doi.org/10.1002/fee.2498
Sawyer, H., Lambert, M.S., and Merkle, J.A., 2020, Migratory disturbance thresholds with mule deer and energy development: The Journal of Wildlife Management, v. 84, no. 5, p. 930–937. [Also available at https://doi.org/10.1002/jwmg.21847.] https://doi.org/10.1002/jwmg.21847
Sawyer, H., Middleton, A.D., Hayes, M.M., Kauffman, M.J., and Monteith, K.L., 2016, The extra mile—Ungulate migration distance alters the use of seasonal range and exposure to anthropogenic risk: Ecosphere, v. 7, no. 10. [Also available at https://doi.org/10.1002/ecs2.1534.]
Simpson, N.O., Stewart, K.M., Schroeder, C., Cox, C., Huebner, K., and Wasley, T., 2016, Overpasses and underpasses—Effectiveness of crossing structures for migratory ungulates: The Journal of Wildlife Management, v. 80, no. 8, p. 1370–1378. [Also available at https://doi.org/10.1002/jwmg.21132.]
Smith, K.T., Taylor, K.L., Albeke, S.E. and Beck, J.L., 2020, Pronghorn winter resource selection before and after wind energy development in south-central Wyoming: Rangeland Ecology & Management, v. 73, no. 2, p. 227–233. [Also available at https://doi.org/10.1016/j.rama.2019.12.004.]
State of Colorado, 2019, Executive order D 2019 011—Conserving Colorado’s big game winter range and migration corridors: Denver, Colo., State of Colorado web page, accessed July 21, 2022, at https://drive.google.com/file/d/1HokP2Vsh749PpJtazPgldLgEjbYjypro/view.]
State of Oregon, 2019, Wildlife corridors act: Salem, Oreg., House Bill 2834. [Also available at https://olis.oregonlegislature.gov/liz/2019R1/Downloads/MeasureDocument/HB2834/A-Engrossed#:~:text=Requires%20department%20to%20%5Bincorporate%20wildlife,road%20project%20environmental%20impact%20statement.%5D.]
State of Utah, 2014, Eagle Mountain master transportation plan: Eagle Mountain, Utah. [Also available at https://www.utah.gov/pmn/files/224247.pdf.]
U.S. Department of Agriculture, 2005, Uintah County—Utah resource assessment: U.S. Department of Agriculture, Natural Resources Conservation Service, 19 p. [Also available at https://www.nrcs.usda.gov/Internet/FSE_DOCUMENTS/nrcs141p2_032377.pdf.]
U.S. Department of the Interior, 2018, Improving habitat quality in western big game winter range and migration corridors: U.S. Department of the Interior, Secretarial Order 3362, accessed January 9, 2014, at https://www.doi.gov/sites/doi.gov/files/uploads/so_3362_migration.pdf.
Utah Division of Wildlife Resources, 2020 Deer herd unit management plan—Deer herd unit #14—San Juan: Salt Lake City, Utah, Utah Division of Wildlife Resources, 13 p. [Also available at https://wildlife.utah.gov/pdf/bg/plans/deer_14_2020.pdf.]
Utah Division of Wildlife Resources, 2017, Deer herd unit management plan—Deer herd unit #4—Morgan-South Rich: Salt Lake City, Utah, Utah Division of Wildlife Resources, 7 p. [Also available at https://wildlife.utah.gov/pdf/bg/plans/deer_04_2020.pdf.]
Utah Division of Wildlife Resources, 2020, Deer herd unit management plan—Deer herd unit #10—Book Cliffs: Salt Lake City, Utah, Utah Division of Wildlife Resources, 6 p. [Also available at https://wildlife.utah.gov/pdf/bg/plans/deer_10_2020.pdf.]
Wallace, Z.P., Nielson, R.M., Stahlecker, D.W., DiDonato, G.T., Ruehmann, M.B., and Cole, J., 2021, An abundance estimate of free-roaming horses on the Navajo Nation: Rangeland Ecology & Management, v. 74, p. 100–109. [Also available at https://doi.org/10.1016/j.rama.2020.10.003.] https://doi.org/10.1016/j.rama.2020.10.003
Washington Department of Fish and Wildlife, 2010, Washington state deer management plan—White-tailed deer: Olympia, Wash., Wildlife Program, Washington Department of Fish and Wildlife, 119 p. [Also available at https://wdfw.wa.gov/sites/default/files/publications/00497/wdfw00497.pdf.]
Washington Department of Fish and Wildlife, 2014, Selkirk elk herd plan: Olympia, Wash., Wildlife Program, Washington Department of Fish and Wildlife, 59 p. [Also available at https://wdfw.wa.gov/sites/default/files/publications/01350/wdfw01350.pdf.]
Washington Department of Fish and Wildlife, 2021, 2021 Game status and trend report: Olympia, Wash., Wildlife Program, Washington Department of Fish and Wildlife, 407 p. [Also available at https://wdfw.wa.gov/sites/default/files/publications/02298/wdfw02298.pdf.]
Wittmer, H.U., Cristescu, B., Spitz, D.B., Nisi, A., and Wilmers, C.C., 2021, Final report—Siskiyou Deer-Mountain Lion Study (2015–2020): California Department of Fish and Wildlife, 71 p. [Also available at https://doi.org/10.13140/RG.2.2.31758.28480.]
Wyckoff, T.B., Sawyer, H., Albeke, S.E., Garman, S.L., and Kauffman, M.J., 2018, Evaluating the influence of energy and residential development on the migratory behavior of mule deer: Ecosphere, v. 9, no. 2. [Also available at https://doi.org/10.1002/ecs2.2113.] https://doi.org/10.1002/ecs2.2113
Wyoming Game and Fish Department, 2016, Ungulate migration corridor strategy: Cheyenne, Wyo., Wyoming Game and Fish Department, 5 p. [Also available at https://wgfd.wyo.gov/WGFD/media/content/PDF/Habitat/Habitat%20Information/Ungulate-Migration-Corridor-Strategy_Final_012819.pdf.]
Appendix 1. Methods
Corridors and Stopovers
Extracting and Mapping Migration Sequences
To identify spring and fall migration start and end dates for each individual ungulate in a given year, we visually inspected the net squared displacement (NSD) curve (Bunnefeld and others, 2011; Bastille-Rousseau and others, 2016) alongside digital maps of the animal’s movement trajectory within the Migration Mapper application (Merkle and others, 2022). The NSD represents the square of the straight-line distance between any global positioning system (GPS) location of an animal’s movement trajectory and a point within the animal’s winter or summer range. Users defined this point separately for each herd based on the start of a biological year, which ranged between January 1 and March 31. Additionally, for pronghorn in Idaho, which had variable winter range periods and movements across the state, we used June 1 (in other words, peak fawning) as the anchor location when measuring NSD and identifying migration start and end dates.
When an animal stays within a defined home range, the NSD varies relatively little during the course of a year. However, when an animal migrates away from its winter range, the NSD of each successive location increases until the animal settles in its summer range (fig. 1.1). The days with clear breakpoints in the NSD curves represent the start and end dates for migration and were used to define the sequences for spring and fall migration. Migration routes were mapped by joining successive GPS locations with a straight line within each migration sequence.
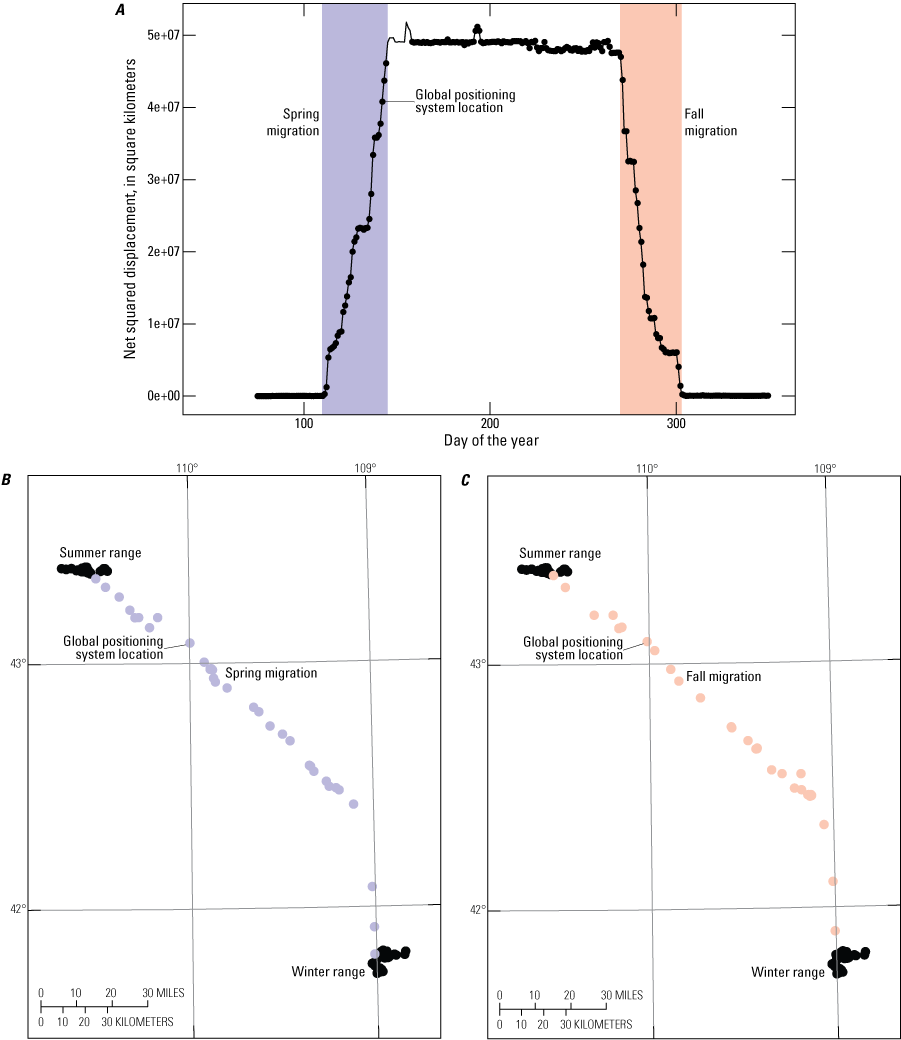
Example of Net Squared Displacement (NSD) analysis to identify migration sequences. A, breakpoints in the NSD curve provide the start and end dates for the spring migration (blue polygon) when an animal migrates from the winter range to the summer range; the fall migration (red polygon) is shown when an animal leaves its summer range to return to the winter range. B, the corresponding GPS locations are highlighted on the map insets for the spring migration in blue. C, the GPS locations showing fall migration are highlighted in red. For ease of readability, only one GPS location per day is shown. (km2, square kilometers)
Calculating Probability of Use with Brownian Bridge Movement Models
Once migration sequences were extracted for each individual in a given year, we used a Brownian bridge movement model (BBMM) (Horne and others, 2007) to estimate a Utilization Distribution (UD) that represents the probability of use during migration. The UD produced from the BBMM provides a probability surface, or heat map, of the area used in each migration sequence. Additionally, the outer bounds of the UD provide estimated widths of the movement path around the straight line between an animal’s two successive locations. Together, the heat map and boundary of the UD can be used to identify migration corridors (Sawyer and others, 2009) and the stopover sites where animals spend extended time foraging along their migration route (Sawyer and Kauffman, 2011).
To generate the heat map for each migration sequence, we used the BBMM to estimate a UD with a grid resolution of 50 m (164 ft). When GPS collars missed fixes and breaks in the sequential data exceeded an 8-hour time lag, we did not build a bridge between the two fixes encompassing the break. A key parameter of the BBMM is the Brownian Motion Variance (BMV), which provides an index of the mobility, or speed of movement, of the animal under observation (Horne and others, 2007). An empirical estimate of the BMV was obtained for each migration sequence following the methods of Horne and others (2007). We did not include migration sequences with a BMV greater than or equal to 8,000 square meters (m2; 2 acres) because large BMV values poorly represented the observed migration trajectory.
Variations of the BBMM Method—Sparse Data and Fixed Motion Variance
When location data are sparse (in other words, when there is a long time interval between GPS fixes), the BBMM performs poorly because of the increased uncertainty in the movement path between two successive GPS fixes. Such uncertainty tends to overestimate the corridor width and area (Horne and others, 2007; Benhamou, 2011). To facilitate corridor analyses of migration sequences collected with low fix rates, we sometimes used the alternative Fixed Motion Variance approach, in which we set the BMV at specific levels when estimating the UDs for each migration sequence (Kauffman and others, 2020; Julien Fattebert, Ecotec Environment, unpub. data, 2022). For herds with sparse sampling data, we set the BMV between 600 and 1,600 for elk and pronghorn and between 400 and 1,200 for mule deer (Julien Fattebert, Ecotec Environment, unpub. data, 2022).
In most cases, traditional BBMM methods were used to estimate corridors and stopovers. However, when there were significant amounts of missing data in the migration sequences, corridors were calculated using Fixed Motion Variance techniques if they improved delineation as observed through a visual comparison of maps from the two methods. When fix rates were highly variable among individuals in a herd, both BBMM and Fixed Motion Variance methods were used to construct individual UDs. In general, by bridging gaps in the probability surface created by missing GPS fixes, Fixed Motion Variance provided a modeled corridor that more closely matched data with frequent relocations (for example, a 2-hour fix rate). In most of these cases, a 14-hour time lag was allowed; a 27-hour time lag was allowed only when it provided more complete migration corridors compared to using a 14-hour time lag.
Calculating Population-Level Corridors and Stopovers
We applied a three-step process to calculate population-level corridors and to identify stopovers; the process generally followed the methods developed by Sawyer and others (2009). First, we averaged the UDs for a given individual’s spring and fall migration sequences across all years to produce a single, individual-level migration UD. We rescaled this mean UD to sum to 1. Second, we defined a migration footprint for each individual as the 99-percent isopleth of its UD. We then stacked all the individual footprints for a given population, which provided a raster representing the number of animals that used each grid cell during migration. Next, we defined different levels of corridor use based on the proportion of the collared migrants in the population for a given grid cell. For most herds, we then defined low-use corridors as areas traversed by at least one individual during migration. Medium-use corridors were defined as those used by 10–20 percent of the collared animals, and high-use corridors were used by more than 20 percent of the collared individuals within the population. These corridors were converted from a grid-based format to a polygon format, while removing isolated-use polygons of less than 20,000 m2 (in other words, less than approximately 5 acres). Finally, to calculate stopover use, we averaged all the individual-level UDs to produce a single population-level UD, rescaled to sum to 1. Stopovers were defined as the areas representing the highest 10 percent of use from the mean population-level UD. As with the corridors, we then converted stopovers from a grid-based format to a polygon format and removed isolated polygons of less than 5 acres (20,000 m2).
Variations of the Method to Calculate Population-Level Corridors
Most maps in this report display low-, medium-, and high-use corridors or routes. However, some individual states adapted methods to best suit their management purposes. For example, Idaho used four classifications: One individual identified the areas used by a single collared migrant, low use was defined as two individuals ranging up to 10 percent of the collared migrants, medium use was defined as 10–20 percent of the collared migrants, and high use was defined as greater than 20 percent of the collared migrants. In California, for specific herds with low sample sizes, only low-use corridors were produced to ensure that no mapped corridors falsely represented high-use areas based on only a few individuals moving through an area.
The final and most simplistic method for delineating migratory corridors was the line buffer approach, which was used for the Crow Mesa mule deer in New Mexico. For this herd, we simply buffered the migration lines by a specified distance (for example, 250 m [820 ft]) and then used the general methods above to determine low-, medium-, and high-use areas. The line buffer method may be preferred because it: (1) ensures individual routes are the same width and do not vary extensively, (2) ensures population-level routes have full connectivity between seasonal ranges (in other words, no broken segments or large blobs are produced), (3) easily accommodates variable GPS fix rates, and (4) requires little computing power.
Estimating a Population’s Winter Range
To estimate a population’s winter range, we generally followed the same methods used to calculate migration stopover sites, with some exceptions. First, instead of migration sequences, we isolated winter sequences of GPS fixes. For each year, we calculated a standard date for the start and end of winter, and, based on the preference of individual states, we applied one of three options to calculate winter range dates: (1) for each year, we calculated the start of winter as the 95th percent quantile of the end dates of all fall migrations and the end of winter as the 5th percent quantile of the start dates of all spring migrations, (2) we defined winter as the dates between the end of fall migration and the start of spring migration for each individual, or (3) we defined a fixed date range using local expert knowledge for a given herd (for example, December 15 to March 15). We discarded winter sequences that spanned fewer than 30 days. Following the methods for migration stopovers, we calculated a population-level UD of winter use and identified the core winter range using the 50-percent isopleth. The only exceptions to this method were the Canyon de Chelly and Ram Pasture mule deer herds in New Mexico, where the winter range was defined using the 30-percent isopleth.
Estimating a Population’s Annual Range
To estimate a population’s annual range, we generally followed the same methods used to calculate migration stopover sites or winter range, with some exceptions. First, we isolated annual movement sequences for each individual. These were defined as movements longer than 275 days within a calendar year, beginning at the time of collar deployment. Start dates were similar because GPS collars were deployed in batches around the same dates. End dates varied, depending on individual mortalities. Following the methods for migration corridors, we calculated a population-level UD of annual use and identified the core annual range using isopleth values selected based on local expert knowledge for a given herd.
Herd Summary Statistics
In addition to the map for each herd, a number of summary statistics described the project and associated data. Within the Animal Capture and Data Collection section corresponding with each herd in the main report, sample size was defined as the number of collared individuals, inclusive of each migration period in days. Additionally, we defined the migration length as the maximum distance between any two points in a spring or fall migration sequence. These methods helped to avoid overestimating migration distances, which can be inflated when calculated as the sum of all step lengths in a sequence because of including distances traveled when foraging at a stopover. This Herd Summary Statistics section also included the areas of migration corridors and stopovers.
References Cited
Bastille-Rousseau, G., Potts, J.R., Yackulic, C.B., Frair, J.L., Ellington, E.H., and Blake, S., 2016, Flexible characterization of animal movement pattern using net squared displacement and a latent state model: Movement Ecology, v. 4, 12 p. [Also available at https://doi.org/10.1186/s40462-016-0080-y.]
Benhamou, S., 2011, Dynamic approach to space and habitat use based on biased random bridges: PLoS One, v. 6, no. 1. [Also available at https://doi.org/10.1371/journal.pone.0014592.] https://doi.org/10.1371/journal.pone.0014592
Bunnefeld, N., Borger, L., van Moorter, B., Rolandsen, C.M., Dettki, H., Solberg, E.J., and Ericsson, G., 2011, A model‐driven approach to quantify migration patterns—Individual, regional and yearly differences: Journal of Animal Ecology, v. 80, no. 2, p. 466–476. [Also available at https://doi.org/10.1111/j.1365-2656.2010.01776.x.] https://doi.org/10.1111/j.1365-2656.2010.01776.x
Horne, J., Garton, E.O., Krone, S.M., and Lewis, J.S., 2007, Analyzing animal movements using Brownian bridges: Ecology, v. 88, no. 9, p. 2354–2363. [Also available at https://doi.org/10.1890/06-0957.1.] https://doi.org/10.1890/06-0957.1
Kauffman, M.J., Copeland, H.E., Berg, J., Bergen, S., Cole, E., Cuzzocreo, M., Dewey, S., Fattebert, J., Gagnon, J., Gelzer, E., Geremia, C., Graves, T., Hersey, K., Hurley, M., Kaiser, J., Meacham, J., Merkle, J., Middleton, A., Nuñez, T., Oates, B., Olson, D., Olson, L., Sawyer, H., Schroeder, C., Sprague, S., Steingisser, A., and Thonhoff, M., 2020, Ungulate migrations of the western United States—Volume 1: U.S. Geological Survey Scientific Investigations Report 2020–5101, 119 p. [Also available at https://doi.org/10.3133/sir20205101.] https://doi.org/10.3133/sir20205101
Merkle, J.A., Gage, J., Sawyer, H., Lowrey, B., and Kaufmann, M.J., 2022, Migration Mapper—identifying movement corridors and seasonal ranges for large mammal conservation: Methods in Ecology and Evolution, v. 13, p. 2397–2403. [https://doi.org/10.1111/2041-210X.13976.]
Sawyer, H., Kauffman, M.J., Nielson, R.M., and Horne, J.S., 2009, Identifying and prioritizing ungulate migration routes for landscape-level conservation: Ecological Applications, v. 19, no. 8, p. 2016–2025. [Also available at https://doi.org/10.1890/08-2034.1.] https://doi.org/10.1890/08-2034.1
Sawyer, H., and Kauffman, M.J., 2011, Stopover ecology of a migratory ungulate: Journal of Animal Ecology, v. 80, no. 5, p. 1078–1087. [Also available at https://doi.org/10.1111/j.1365-2656.2011.01845.x.] https://doi.org/10.1111/j.1365-2656.2011.01845.x
Datum
Vertical coordinate information is referenced to the North American Vertical Datum of 1988 (NAVD 88).
Horizontal coordinate information is referenced to North American Datum of 1983 (NAD 83).
Abbreviations and Acronyms
BBMM
Brownian bridge movement model
BLM
Bureau of Land Management
BMV
Brownian Motion Variance
CalTrans
California Department of Transportation
CDFW
California Department of Fish and Wildlife
CMT
Corridor Mapping Team
CPW
Colorado Parks and Wildlife
DOI
U.S. Department of the Interior
FS
U.S. Department of Agriculture Forest Service
ft
foot
GMU
Game Management Unit
GPS
global positioning system
ha
hectare
IDFG
Idaho Department of Fish and Game
km
kilometer
km2
square kilometer
mi
mile
NDOT
Nevada Department of Transportation
NDOW
Nevada Department of Wildlife
NSD
net squared displacement
SO
Secretarial Order
UDWR
Utah Division of Wildlife Resources
UD
utilization distribution
USGS
U.S. Geological Survey
WDMZ
White-Tailed Deer Management Zone
WGFD
Wyoming Game and Fish Department
WMA
Wildlife Management Area
WVC
wildlife-vehicle collision
For more information concerning the research in this report, contact the
Associate Director
Ecosystems Mission Area
U.S. Geological Survey
Mail Stop 300
12201 Sunrise Valley drive
Reston, VA 20192
Suggested Citation
Kauffman, M., Lowrey, B., Berg, J., Bergen, S., Brimeyer, D., Burke, P., Cufaude, T., Cain, J.W., III, Cole, J., Courtemanch, A., Cowardin, M., Cunningham, J., DeVivo, M., Diamond, J., Duvuvuei, O., Fattebert, J., Ennis, J., Finley, D., Fort, J., Fralick, G., Freeman, E., Gagnon, J., Garcia, J., Gelzer, E., Graham, M., Gray, J., Greenspan, E., Hall, L.E., Hendricks, C., Holland, A., Holmes, B., Huggler, K., Hurley, M., Jeffreys, E., Johnson, A., Knox, L., Krasnow, K., Lockyer, Z., Manninen, H., McDonald, M., McKee, J.L., Meacham, J., Merkle, J., Moore, B., Mong, T.W., Nielsen, C., Oates, B., Olsen, K., Olson, D., Olson, L., Pieron, M., Powell, J., Prince, A., Proffitt, K., Reddell, C., Riginos, C., Ritson, R., Robatcek, S., Roberts, S., Sawyer, H., Schroeder, C., Shapiro, J., Simpson, N., Sprague, S., Steingisser, A., Tatman, N., Turnock, B., Wallace, C., and Wolf, L., 2022, Ungulate migrations of the western United States, Volume 3: U.S. Geological Survey Scientific Investigations Report 2022–5088, 114 p., https://doi.org/10.3133/sir20225088.
ISSN: 2328-0328 (online)
Study Area
| Publication type | Report |
|---|---|
| Publication Subtype | USGS Numbered Series |
| Title | Ungulate migrations of the western United States, volume 3 |
| Series title | Scientific Investigations Report |
| Series number | 2022-5088 |
| DOI | 10.3133/sir20225088 |
| Year Published | 2022 |
| Language | English |
| Publisher | U.S. Geological Survey |
| Publisher location | Reston VA |
| Contributing office(s) | Coop Res Unit Seattle |
| Description | Report: xvi, 114 p.; Data Release |
| Country | United States |
| State | Arizona, California, Idaho, Nevada, New Mexico, Oregon, Utah, Washington, Wyoming |
| Google Analytic Metrics | Metrics page |