

Hydrology, Water Quality, and Biological Characteristics of Levittown Lake, Toa Baja, Puerto Rico, April 2010–June 2011
Links
- Document: Report (1.73 MB pdf) , HTML , XML
- Dataset: USGS National Water Information System database —USGS water data for the Nation
- Data Release: USGS data release —Data for the hydrologic and water-quality characterization of Levittown Lake, Toa Baja, Puerto Rico, April 2010–June 2011
- Download citation as: RIS | Dublin Core
Abstract
Levittown Lake is a 30-hectare, brackish waterbody located in the municipality of Toa Baja, on the northern coast of Puerto Rico. The lake is a small, man-made feature formed by draining the marshland over which the Levittown community was built. Levittown Lake has an average depth of about 5 meters and a water level at/near mean sea level. Tidal oscillations within the lake were minimal during the study, about 10 centimeters regardless of ocean tides, and the daily flushing rate of the lake was about 2 percent of its entire water volume.
Hydrologic, water-quality, and biological data were collected in Levittown Lake and adjacent areas (specifically, the inlet/outlet channel and Caño El Hato drainage canal) between April 2010 and June 2011 (1) to establish baseline conditions and determine the water quality of the lake on the basis of preestablished standards and (2) for contrast with other, more healthy coastal lagoons. The study provides a baseline for an assessment of the potential of Levittown Lake to function as a coastal lagoon.
Water-quality properties measured onsite (temperature, pH, dissolved oxygen concentration, specific conductance, salinity, and water transparency) varied diurnally and seasonally. In general, water-quality properties were in compliance with current regulatory Class SB standards established by the Puerto Rico Environmental Quality Board, except for some dissolved oxygen concentration and pH measurements. Some dissolved oxygen concentration measurements at the water surface and all dissolved oxygen concentration measurements at the lake bottom were lower than the values recommended by the Puerto Rico Environmental Quality Board. The pH of the water at the lake surface ranged from 7.3 to 9.1, with the upper value exceeding the recommended pH values. Nutrient concentrations were below the current regulatory standards of less than 5 milligrams per liter (mg/L) for total nitrogen and 1 mg/L for total phosphorus. The measured concentrations of chlorophyll a varied throughout the year of sampling and indicate that eutrophic conditions predominate in Levittown Lake.
The phytoplankton yielded an average net productivity of 0.5 milligram of oxygen per liter per hour, as determined by light and dark bottle primary productivity studies conducted on a monthly basis and measured in the early morning hours. Because these measurements were restricted to the morning hours, a qualification of the representativeness of the results to the full diurnal cycle is necessary. The measured hourly respiration rate averaged 0.39 milligram of oxygen per liter. Diel studies were planned in the lake to assess dissolved oxygen concentration diurnal curves and ultimately to compute the community net primary productivity, respiration, and gross productivity. Conditions during the diel studies were later determined to be unsuitable, limiting the assessment of community metabolism. Another biological indicator evaluated during the study was the phytoplankton biomass, and results indicated that phytoplankton biomass measured at the Levittown Lake ranged from 6.0 to 112.5 mg/L.
Fecal indicator bacteria concentrations ranged from 10 to 1,540,000 colonies per 100 milliliters of water. Concentrations generally were greatest in and near the Caño El Hato drainage canal and, during the study, exceeded current regulatory standards established for Puerto Rico.
Introduction
Levittown Lake, a 30-hectare brackish waterbody with an average depth of about 5 meters (m) and water level at/near mean sea level, is located in the municipality of Toa Baja on the northern coast of Puerto Rico (fig. 1). The lake is a man-made feature created by draining the preexisting marshland over which the Levittown community was built. The Caño El Hato drainage canal (also called the “runoff channel” herein) transports stormwater runoff from the center of Levittown to the lake. Details on the specific date of the completion of Levittown Lake are not available; however, it is known that the Levittown community, one of the largest planned communities in Puerto Rico, was developed during the 1960s and 1970s (Levittown Beyond, 2012). Densely developed residential areas border about 75 percent of the lake’s shoreline and extend to the north, east, and south. An extensive vegetated buffer zone borders the remaining 25 percent and extends about 6 kilometers (km) to the west (fig. 2).
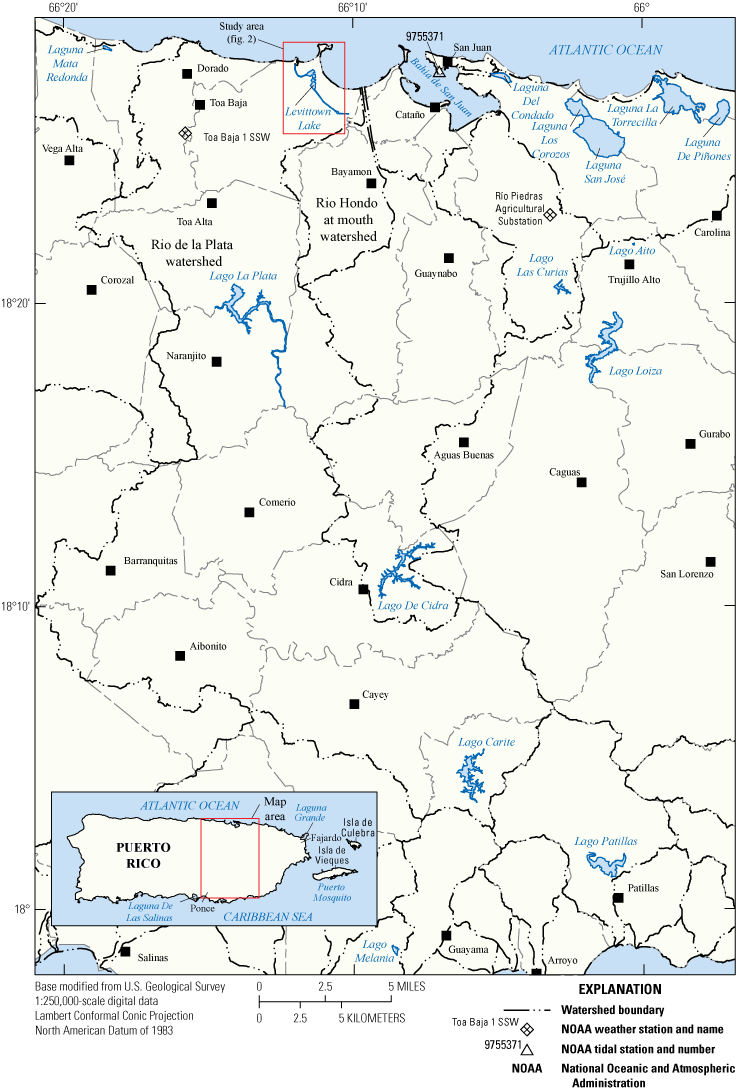
Location of the study area for Levittown Lake in the Río de la Plata watershed, Toa Baja, Puerto Rico. The extent of the drainage area for Levittown Lake is not known and therefore is not delineated on the map.
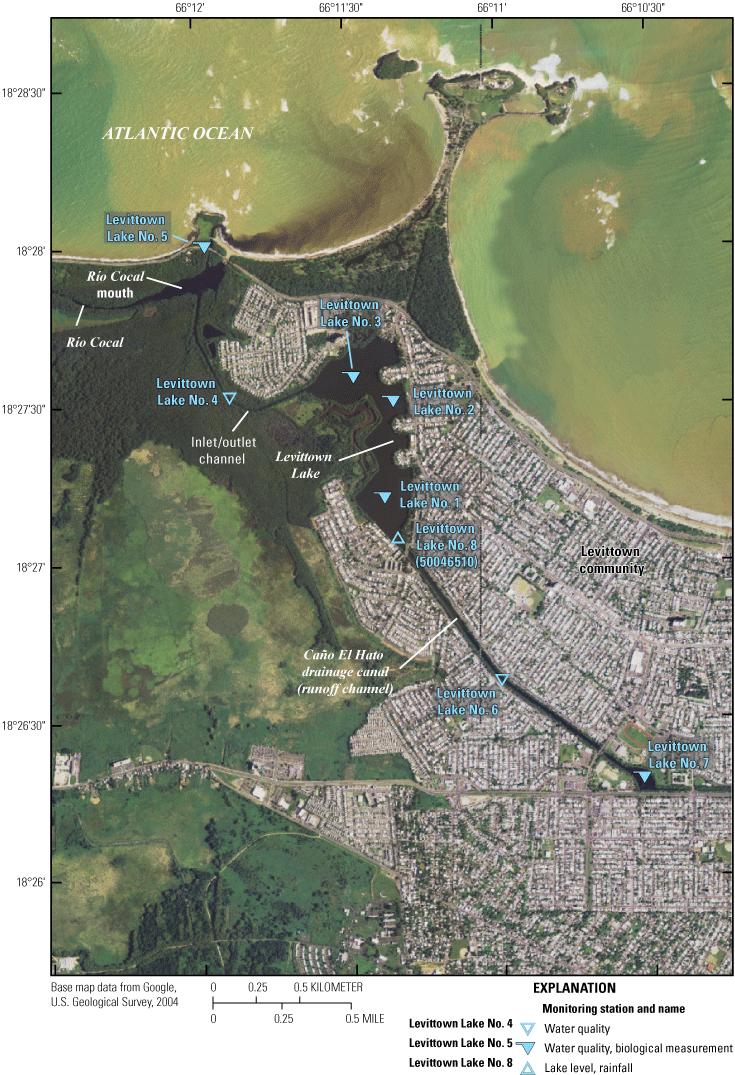
Study area, including Levittown Lake (main waterbody), the inlet/outlet channel, the Caño El Hato drainage canal, and the data collection stations.
Although initially intended to be a drainage system for stormwater during the construction of Levittown, the lake may have become a functional aquatic ecosystem that supports a trophic chain. With its inlet/outlet channel indirectly connecting the lake to the ocean, the lake may be operating as a typical coastal lagoon by exporting substantial organic matter to the ocean, supporting the food chain, and removing carbon dioxide (CO2) from the atmosphere. Therefore, the lake may have become an integral part of the local coastal resources, as well as an important ecological oasis and CO2 sink in the middle of a heavily developed and populated area. The degree to which Levittown Lake functions like a coastal lagoon has not been determined; thus, it is unclear how much Levittown Lake contributes to the health of the local coastal resources by serving as a source of consumable organic matter for the marine environment and by serving as a carbon sink.
Other coastal lagoons in Puerto Rico such as Laguna de Las Salinas (Soler-López and others, 2005), Laguna Grande (Soler-López and Santos, 2010), and Puerto Mosquito (Gómez-Fragoso and Santiago-Sáez, 2018) have been monitored to characterize their water-quality conditions, and results indicate that they were found to be within the regulatory standards, with some isolated exceptions. Physical and chemical properties assessed in these studies included temperature, pH, dissolved oxygen, turbidity, specific conductance, and nutrients. The measured temperature at these coastal lagoons ranged between 26 and 31 degrees Celsius (°C) and pH values ranged between 7.1 to 8.6. Nutrient analyses indicated that the concentrations did not exceed the regulatory standards of 5.0 (total nitrogen) and 1.0 (total phosphorous as P) milligrams per liter (mg/L) for Class SB waters. The highest measured concentrations of total nitrogen were observed at Laguna de las Salinas, ranging between 1.2 and 2.62 mg/L. Puerto Mosquito had the lowest measured concentrations of phosphorus, some of which were below the method reporting limit during the sampling period.
Because of its potential to function as a coastal lagoon, the U.S. Geological Survey (USGS), in cooperation with the Puerto Rico Department of Natural and Environmental Resources, collected and evaluated hydrologic, water-quality, and biological data from April 2010 to June 2011 to characterize the water quality of Levittown Lake and to establish a baseline for its management as a coastal environmental resource. Although Levittown Lake may be operating as a typical coastal lagoon, it will be referred to as a lake throughout this report.
Purpose and Scope
The purpose of this report is to (1) document seasonal variability of hydrologic, aqueous geochemical and biological conditions during a 15-month period from April 2010 through June 2011, (2) characterize the biological productivity of the lake, and (3) compare the results of the water-quality assessment against the regulatory standards. Baseline characteristics included temperature, turbidity, pH, dissolved oxygen concentration, specific conductance, salinity, and water transparency. Water samplings were conducted at approximately 1-month intervals in Levittown Lake, the runoff channel, and the inlet/outlet channel. In addition to measuring water-quality constituents, the study included the determination of (1) community productivity through the light and dark bottle method and two diel data collection efforts, (2) diurnal variation of selected water-quality characteristics, and (3) surface-water exchange between the lake and ocean.
Description of Study Area
The study area encompasses the lacustrine system of Levittown Lake, which is composed of three basic, identifiable components (fig. 2): the main waterbody of the lake; a 1.6-km inlet/outlet channel, surrounded by mangroves and tidal swamps, that connects the lake to the mouth of the Río Cocal and the Atlantic Ocean; and the Caño El Hato drainage canal. The lake is primarily used for stormwater storage, but it is also used by the community for recreational activities such as fishing and boating.
The extent of the Levittown Lake drainage basin cannot be determined, because the lake is in the middle of a heavily populated and developed area that has complex and unmapped stormwater systems that convey runoff from distant areas. The lake is connected at times to tidal swamps to the west that are underwater most of the year and to tidal flats that are slightly above mean sea level and only affected by saltwater during high tides. No perennial streams discharge into the lake; consequently, it only receives freshwater inflow during rainfall-runoff events, mainly through the Caño El Hato drainage canal.
The climate of the study area is tropical, with an annual mean rainfall (1981–2010) of about 1,721 millimeters (mm), as recorded at National Oceanic and Atmospheric Administration (NOAA) Toa Baja 1 SSW weather station (66–9421) (NOAA, 2011). Recent climate information showed that the annual mean rainfall from 1991 to 2020 near Levittown Lake was about 1,914 mm, as recoded at National Oceanic and Atmospheric Administration (NOAA) Toa Baja Levittown weather station (66–9415) (National Weather Service, 2021).
About 70 percent of the surface geology surrounding the Levittown Lake area is composed of beach deposits (mainly rounded grains of quartz, volcanic rock, and shell) that range from 1 to 5 m in thickness. Another 20 percent is composed of swamp deposits of sandy muck and clayey sand; in some areas, these deposits are underlain by peat generally less than 10 m thick. The remaining 10 percent is composed of alluvium deposits of sand, clay, sandy clay, and beds of sand containing gravel and cobbles. The alluvium deposits vary in thickness and may extend as deep as 25 m below land surface (Boccheciamp, 1978).
Methods of Investigation
Data for this study were collected at eight locations in Levittown Lake, the Caño El Hato drainage canal, and the inlet/outlet channel between April 2010 and June 2011 (fig. 2). Levittown Lake Nos. 1, 2, and 3 are located within the main waterbody; Levittown Lake No. 4 is located about halfway along the inlet/outlet channel; Levittown Lake No. 5 is at the mouth of the inlet/outlet channel; Levittown Lake No. 6 is located halfway along the runoff channel; Levittown Lake No. 7 is located at the beginning of the runoff channel; and Levittown Lake No. 8 is located at a concrete dock in the southeastern portion of the main waterbody.
Hydrologic properties, water chemistry, and selected biological characteristics of the lake were determined from field measurements and sampling by following USGS standard methods (U.S. Geological Survey, 1998). Table 1 lists the seven stations used for water sampling and the physical, chemical, and biological determinations made at each station. Sample volumes, containers, and preservation methods used for individual chemical and biological samples are listed in table 2.
Table 1.
Water-quality determinations conducted at the Levittown Lake study area, Toa Baja, Puerto Rico, April 2010 to June 2011.[Monthly field determinations included measurements of temperature, pH, dissolved oxygen, specific conductance, salinity, and water transparency (determined by Secchi disk). USGS, U.S. Geological Survey]
Table 2.
Sample collection and preservation for selected analytes measured at the Levittown Lake study area, Toa Baja, Puerto Rico.[mL, milliliter; µm, micron; °C, degrees Celsius; H2SO4, sulfuric acid; N, normality; L, liter; mm, millimeter]
Bathymetric Survey
A bathymetric survey of the lake was conducted on January 11, 2011, to map the lake bottom, calculate the water volume of the lake at mean sea level, and to estimate the mean depth of the lake; these characteristics were used for further analysis of water-quality data. A bathymetric-land survey system interfaced with a water-depth sounder (fathometer) was used to conduct the survey. Geographic location and water-depth data were simultaneously collected and stored in a portable computer. Onsite calibration of the fathometer was conducted prior to the beginning of data collection using the bar-check method (Thompson, 2014). The raw depth data were adjusted by applying a time-water elevation correction factor using water levels at Levittown Lake No. 8 (fig. 2; USGS lake level station 50046510) to reference depth data to mean sea level. For example, depth data for a specific area were adjusted by adding or subtracting values depending on the water level in the lake. If the lake level was below mean sea level, depth data were adjusted by adding a value. Conversely, if the lake level was above mean sea level, depth data were adjusted by subtracting a value. This was done prior to transferring data into the USGS geographic information system (GIS) for processing and analysis.
After the data reduction process (noise removal) and postprocessing of raw depth data, the lake bottom was mapped by onscreen digitizing and converted into a triangulated irregular network to calculate the volume. The triangulated irregular network represents the lake-bottom surface as thousands of adjoining triangles with Cartesian x, y, and z coordinates assigned to all vertices (Environmental Systems Research Institute, Inc., 2021).
Tidal and Rainfall Data Collection
Water exchange between the Atlantic Ocean and the lake during low and high tides was determined through a series of discharge measurements where the inlet/outlet channel connects with the ocean. The measurements were conducted using USGS standard wading and hydroacoustic methods (Laenen, 1985).
Daily and annual tidal cycles in the lake were monitored at Levittown Lake No. 8 (fig. 2). Tidal cycles in the Atlantic Ocean were determined at the NOAA San Juan, La Puntilla PR tidal station (9755371), located within Bahia de San Juan about 9 km east of the lake (fig. 1).
Historical data for yearly tidal fluctuations indicate the highest tidal cycle of the Atlantic Ocean on the northern coast of Puerto Rico occurs in November and the lowest tidal cycle occurs in April (NOAA, 2013). To characterize the maximum and minimum flood (inflow) and ebb (outflow) flows, discharge measurements were conducted during November 4–5, 2010, and April 27–28, 2011, to coincide with the typical periods of highest and lowest tides for the year. In 2010, discharge measurements were made at hourly intervals from 7:30 a.m. on November 4 to 7:30 a.m. on November 5. An acoustic doppler current profiler was used on both days to measure flood and ebb flows of the lake during a full tidal cycle period of about 25 hours. In 2011, flood and ebb flows were measured from 7:30 a.m. on April 27 to 8:00 a.m. on April 28.
A tipping-bucket rain gage was installed at the Levittown Lake No. 8 station to measure rainfall. Site inspection and calibration were mostly conducted on a monthly basis following USGS standards, and data are available from the USGS National Water Information System (NWIS) database (U.S. Geological Survey, 2021). The rainfall data were compared with rainfall normals at the NOAA Río Piedras Agricultural Substation, which has a period of record from 1981 to 2020 (NOAA, 2011). The NOAA station is located approximately 9 km southeast of the study area (fig. 1).
Water-Quality Sampling and Analysis
Water-quality data were collected and analyzed to determine selected physical and chemical characteristics as well as concentrations of indicator bacteria for fecal coliform. Selected physical and chemical characteristics of the lake water were measured at Levittown Lake Nos. 1–7 (fig. 2) using a multiparameter water-quality probe (YSI 650) at approximately 1-month intervals (during morning hours) from April 2010 to June 2011. Measurements include in situ temperature, pH, dissolved oxygen (DO) concentration, specific conductance, and salinity derived from specific conductance. The multiparameter sonde was calibrated prior to each site visit by using pH 7 and pH 10 buffers, and conductivity standards for 50,000 microsiemens per centimeter at 25 degrees Celsius (µS/cm at 25 °C).
Water transparency was measured by lowering a 20-centimeter (cm) diameter Secchi disk into the water and recording the depth at which it disappeared from view. The Secchi disk provides a means of determining the limit of visibility based on the contrast between four quadrants of alternate black and white areas on the disk. Water transparency is roughly 1.7 times the Secchi disk depth of disappearance but is highly variable in shallower areas (Scheffer, 2004). Water turbidity was determined by collecting water samples and analyzing them at the USGS National Water Quality Laboratory (NWQL). Table 1 specifies the stations at which turbidity samples were collected.
Nitrogen (N) and phosphorus (P) compounds, as well as chlorophyll a and biomass, were sampled at nearly 1-month intervals at Levittown Lake Nos. 1 and 3 (fig. 2) from April 2010 to June 2011. Nutrient water samples were collected, filtered onsite as needed, chilled, and sent to the USGS NWQL for analysis (table 2). The water samples were analyzed for several N species (organic N, ammonium, nitrate, and nitrite) and for total P. Total N was calculated as the sum of all N species. Chlorophyll a samples were collected in labeled bottles, filtered onsite, packed in dry ice, and sent to the NWQL for analysis (table 2). Nutrients results are reported in milligrams per liter, and chlorophyll a results are reported in micrograms per liter. All data collected from April 2010 to June 2011, including the water-quality sampling results and field-measured water properties, are available from NWIS (U.S. Geological Survey, 2021).
Determination of Biological Characteristics
The assessment of the biological characteristics of Levittown Lake included tasks such as estimating primary productivity, phytoplankton biomass, and bacteriological communities. Samples were collected on a monthly basis from April 2010 to June 2011 using USGS standard field techniques and analytical methods (U.S. Geological Survey, 1998). The assessment of primary productivity of the aquatic community also involved the determination of DO concentrations during November 2010 and May 2011, within a month of the highest and lowest tides, respectively.
The primary productivity of an ecosystem is defined as the rate at which new organic matter is created by photosynthesis (or chemosynthesis) and is expressed as the production of organic matter per unit of volume per unit of time. The principal primary producers in aquatic ecosystems include phytoplankton, periphyton, and macrophytes. Of these, phytoplankton often synthesize the most organic matter in aquatic systems, although periphyton and macrophytes add substantial amounts of organic matter. The cycles of photosynthesis and respiration, respectively, are summarized by the following universal equation (Petersen and others, 2015):
wherePrimary productivity for Levittown Lake was determined by using the light and dark bottle method and by diel studies (Dodds and Whiles, 2010). These methods make it possible to assess the three main processes controlling the primary productivity of organic matter: (1) gross productivity; (2) respiration or the oxygen consumed by all communities; and (3) net primary productivity, which is the rate at which organic matter is created after subtracting losses or respiration. Natural systems are affected by many factors that cause rapid, frequent, and variable changes in productivity, such that only average rates can be determined in a typical environment.
The light (translucent) and dark (nontranslucent) bottle method can be used to determine net changes in the concentration of DO for a given volume of water within a given time interval (Dodds and Whiles, 2010). This technique was used to analyze net primary productivity by phytoplankton in the water column. Productivity measurements were made through the calculation of DO concentrations at Levittown Lake Nos. 1 and 3 at roughly monthly intervals by sampling lake water in light and dark bottles (table 1, fig. 2) and later calculating the primary production divided by the time of incubation. These sampling sites were the same ones used to collect nutrient samples and were collected at the top of the water column. Incubation was typically initiated before 6:00 a.m. and terminated at about 10:00 a.m. The early initial time was selected to avoid high levels of oxygen saturation at the time of sample collection so that an increase in DO concentration could be measured at the end of the incubation period. The initial concentration of DO prior to incubation was determined using the Winkler titration method (Clesceri and others, 1998). At both sites, an aluminum rack was deployed that contained two contiguous light bottles and two contiguous dark bottles (Clesceri and others, 1998). The water samples were incubated for at least 4 hours at the same depths where they were collected (top of water column). After incubation, the bottles were removed and the DO concentration of each sample was determined by titration. The initial DO concentration was expected to decrease in the dark bottle by means of respiration and was expected to increase in the light bottle by means of photosynthesis. The oxygen production and respiration results (later divided by time to obtain the primary productivity and respiration rate), therefore, can be expressed as
wherePg
is gross production, in grams of oxygen per cubic meter;
OL
is the DO concentration at the end of the incubation period in the light bottle, in grams of oxygen per cubic meter;
OD
is the DO concentration at the end of the incubation period in the dark bottle, in grams of oxygen per cubic meter;
Pn
is net production, in grams of oxygen per cubic meter;
OI
is the initial DO concentration prior to incubation, in grams of oxygen per cubic meter; and
R
is respiration, in grams of oxygen per cubic meter.
Diel studies were also conducted at the lake to estimate the community net primary productivity, the community respiration rate, and the community gross productivity (Cornell and Klarer, 2008). The diel studies were conducted on November 18, 2010, and May 18, 2011, near the respective annual periods of highest and lowest tides along the northern coast of Puerto Rico. Data collection began before sunrise and continued until after sunset. Measurements were made at Levittown Lake Nos. 1, 2, and 3 (fig. 2). These studies included measuring physical and chemical water properties such as temperature, pH, and DO, all of which are affected by metabolic processes in the water column during diurnal fluctuations. As stated earlier, the collected data can be used to define the hourly variation in DO and its saturation levels to calculate the net oxygen production and respiration rates (Odum, 1956). Data used for the primary productivity analysis are presented in Soler-López (2022). As stated earlier, these two diel studies were conducted to determine the aquatic net community primary productivity.
Phytoplankton biomass concentration—commonly used to assess the toxicity, nutrient enrichment, and other biological processes occurring in water bodies—was measured at Levittown Lake Nos. 1 and 3 by collecting samples in designated bottles, filtering the water onsite, and shipping the samples overnight to the NWQL for analysis. Phytoplankton biomass was determined using the ash-weight/dry-weight ratio method (Clesceri and others, 1998). The samples were collected as sequential replicates within the water column at the same locations where samples were obtained for light and dark bottle incubation. The water samples were filtered through a glass-fiber (borosilicate) filter, frozen, and sent to the NWQL for analysis (table 2). At the laboratory, these filters were dried at 105 °C overnight, cooled to room temperature, and weighed; the samples were then redried at 60 °C for several hours and reweighed. The difference in weight was reported as the ash-free dry phytoplankton biomass, in milligrams per liter.
Another biological characteristic, the concentration of fecal indicator bacteria, was determined through direct sampling and analyzed using standard USGS procedures. Water samples were collected for fecal coliform bacterial analysis using the “hand-dip” method, which is applicable to streams and standing waters (Clesceri and others, 1998). Samples were collected at Levittown Lake Nos. 2, 5, and 7 for fecal coliform bacterial analysis approximately every month (fig. 2); water at these stations is presumed to be affected by human activity and sewer discharge. At each station, two or three sterilized borosilicate 100-milliliter (mL) bottles were immersed in the water to a depth of about 15 cm, leaving a small air pocket to maintain oxygenation and to allow subsequent mixing before analysis (table 2). Within 6 hours of collection, samples were passed through a filter with a 0.65-micrometer pore size using the microfiltration method (Clesceri and others, 1998). Fecal coliform bacteria were cultured in fecal coliform agar base (m-FC) and incubated at 44.5 °C for 20–24 hours; colonies were counted using a magnifying glass (Clesceri and others, 1998). The results were reported as colonies of bacteria per 100 mL of sample.
Bathymetry
The water volume of Levittown Lake was calculated to be 1.35 million cubic meters (Mm3) at mean sea level. The lake bottom relief was irregular, having an average depth of about 5 m below mean sea level and a maximum depth of 8 m below mean sea level in the northern and central parts of the lake (fig. 3). Lake-water depths typically ranged from 5 to 6 m, with shallower areas located in the southeastern part of the lake. The lake encompassed about 0.29 square kilometer, as calculated using a GIS. Spatial data associated with the bathymetric survey conducted in 2011 are presented in Soler-López (2022).
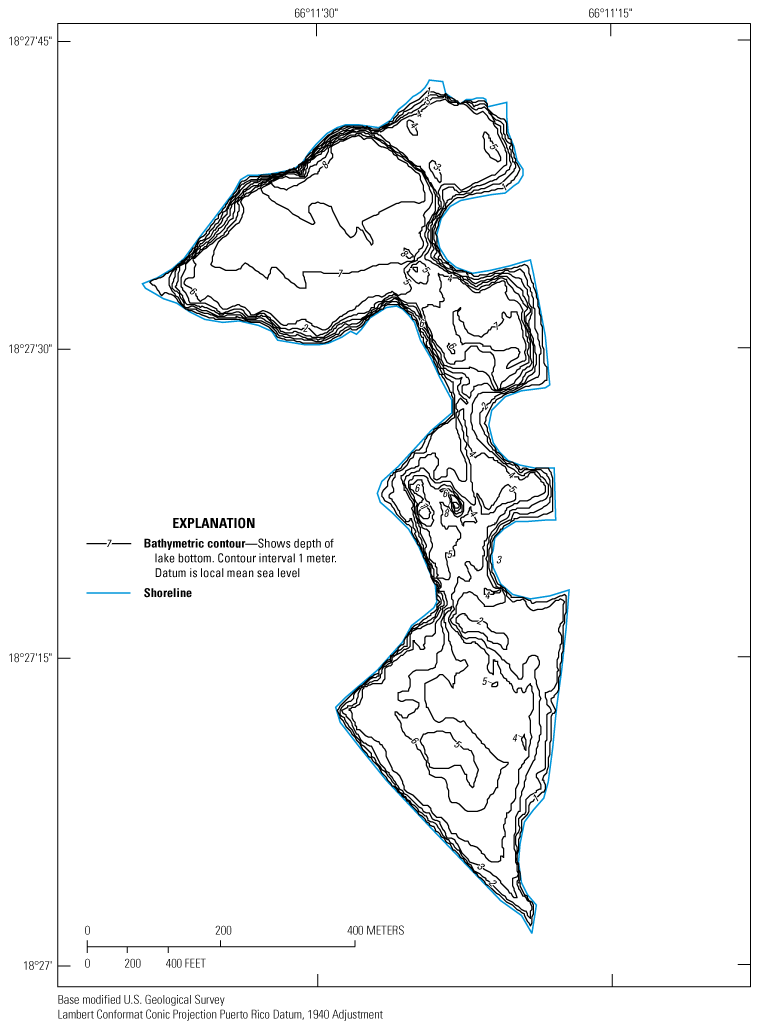
Bathymetry of the main waterbody of Levittown Lake in 2011, Toa Baja, Puerto Rico.
Inflows and Outflows
Hydrologic inflows to Levittown Lake include direct rainfall, runoff during rainfall events, and tidal inflows. The primary hydrologic outflows from Levittown Lake are assumed to be tidal outflows, which are considered in this report. Evapotranspiration may also contribute to outflows but is not considered directly.
Rainfall and Runoff
Monthly rainfall during 2010 in the Levittown Lake area was compared with rainfall recorded by a NOAA observation station at the Río Piedras Agricultural Substation, Puerto Rico, which has a historical period of record from 1981 to 2010 (table 3; NOAA, 2011). The total annual rainfall at the lake rainfall station for 2010 was determined to be about 1,869 mm (Soler-López, 2022). The comparison revealed that 2010 was a year of slightly above-normal rainfall, totaling about 104 percent of the corresponding long-term annual mean for the area (table 3).
Table 3.
Comparison between the long-term mean monthly rainfall at the National Weather Service station Río Piedras Agricultural Substation and monthly rainfall at the Levittown Lake rainfall station during 2010.[Long-term means for the Rio Piedras Agricultural Substation were determined from data in National Oceanic and Atmospheric Administration [NOAA], 2011]). All values are in millimeters]
Levittown Lake has no connection to ephemeral or perennial streams, and lake level is dependent on runoff from the Caño El Hato drainage canal. Runoff into the lake is considered substantial, as indicated by daily water-level data (not shown in this report because the amount of data is too great). For example, during December 15, 2010, the lake level rose from 0.99 to 1.59 m (arbitrary datum), a 60-cm increase, in less than 2 hours. This rise is three times the daily tidal fluctuation recorded at the lake, discussed in the following section.
Seawater Exchange
Flow into and out of the lake (flood and ebb flow) is controlled by oceanic tidal fluctuations, the volume of water associated with the flooded area, and the resistance that water in the lake exerts over inflow. The 24-hour tidal measurements made north of Levittown Lake No. 5 at the mouth of the Río Cocal tidal inlet/outlet channel during periods of highest and lowest annual tides (November and April, respectively) indicate that lake stage peaked about 2 hours after the corresponding oceanic tidal peak (fig. 4). This time period may represent contaminant travel time between Levittown Lake and the ocean (by way of the channel), depending on tides. During November 2010, the peak amplitude of the lake tidal cycle was about 10 cm and that of the oceanic tidal cycle was 65 cm (fig. 4A). During April 2011, the peak amplitude of the lake tidal cycle was about 10 cm and that of the oceanic tidal cycle was about 30 cm (fig. 4B). Water-level data indicate that the lake surface was never lower than that of the ocean, indicating that when the lake level started to drop during low tide, the ocean tide began rising again, impeding lake-water outflow (fig. 4B).
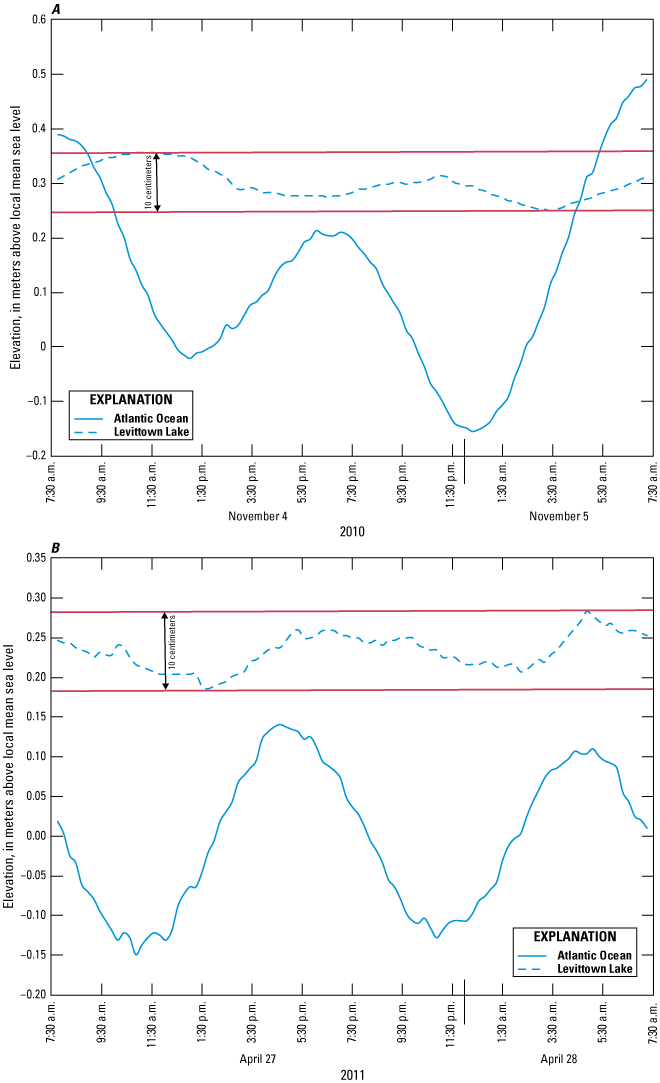
Typical tidal cycles in Levittown Lake and the Atlantic Ocean during periods of A, highest and, B, lowest tides of the year.
An attempt to determine the flushing rate of Levittown Lake was initially made by calculating its flood (inflow) and ebb (outflow) discharges. High flushing rates are generally associated with good water quality and healthy conditions unless the ocean-water quality is substantially impaired. In general, coastal lagoon or lake water is less susceptible to the effects of point-source contamination originating within the shoreline perimeter than to contamination from the ocean because of the relatively rapid dilution with seawater or purging during ebb flows. However, sudden changes in nearshore seawater quality, such as from a fuel or oil spill, can rapidly affect water quality in a nearby coastal lagoon or lake, depending on its proximity to the contamination source and the degree of connection between the waterbody and ocean.
The fact that seawater mixes with water in the Rio Cocal mouth before entering the lake during high tides, and that discharge from the Río Cocal is combined with outflow from the lake during low tides, made it impractical to use discharge data collected at Levittown Lake No. 5 to calculate a flushing rate for the lake. Tidal discharge data, however, were useful for estimating a potentially increased flushing rate for the lake, which is explained later. The flushing rate of the lake was instead calculated by using daily water-level variations recorded at the tidal station that operated inside the lake for 1 year (Levittown Lake No. 8).
Water-level data indicated that, regardless of tidal fluctuation amplitude, the lake vertically oscillates only 10 cm. Multiplying this height by the surface area of the lake (293,992 square meters) yields a volume of 29,400 cubic meters (m3). Therefore, Levittown Lake flushes about 2.1 percent of its entire volume daily ([29,400/1,350,000] × 100 = 2.1), which means the lake renews its water volume equivalent about every 48 days, or 7.6 times per year.
Assuming that the average net tidal flux between the annual high and low tides represents the mean annual tidal flux for the lake, about 170,000 cubic meters per day enter through the inlet/outlet channel. Based on the lake-water volume of 1.35 Mm3, the daily flushing rate of the lake theoretically could be increased up to about 12 percent or about every 8 days of renewal rate (about 46 times per year) if all of the water that enters through the channel could reach Levittown Lake. This estimate assumes that water could be prevented from entering the Río Cocal but does not account for the water that seeps through mangrove roots into surrounding tidal swamps. Nonetheless, by redirecting some tidal flow into the lake, the flushing rate could be increased considerably. Freshwater inflow to the lake can be characterized as substantial compared to the amount of seawater inflow to the lake, as water-level data indicate. Seawater exchange between the lake and Atlantic Ocean is minimal, as indicated by the water budget during high and low tides.
Water Quality
Water-quality data collected during this study were analyzed, and the water quality of the lake was characterized, using comparable values established for Class SB waters (Puerto Rico Environmental Quality Board, 2014). Class SB waters are classified as coastal and estuarine waters intended for use for primary and secondary contact and for the propagation and preservation of desirable species, including those that are threatened or endangered (Puerto Rico Environmental Quality Board, 2014).
Field-Measured Water Properties and Constituents
The discussion of the field determinations at Levittown Lake encompasses the characterization of water-quality conditions and their variability throughout the (1) water column (stratification), (2) study area, and (3) period of study (seasonal changes, if any). Field-collected data included temperature, pH, DO, specific conductance, salinity, and water transparency, all of which were measured at the top and bottom of water column at each site sampled. Although no depth information was collected for the inlet/outlet channels, it was assumed that they were shallower than the main body of the lake. The assessment of spatial variability is discussed by dividing the lake into two distinct areas: the main waterbody (Levittown Lake Nos. 1, 2, and 3) and the inlet/outlet and runoff channels (Levittown Lake Nos. 4, 5, 6, and 7), because of their different morphological and hydrologic characteristics. Values of monthly field-measured parameters are available through the NWIS database (U.S. Geological Survey, 2021). Turbidity was measured only in the main body of the lake and was determined by analyzing water samples collected on a monthly basis at Levittown Lake Nos. 1 and 3.
Temperature
Water temperature exerts a major influence on the biological activity and growth of aquatic organisms. Generally, water temperature is positively related to biological activity. Very high water temperatures, however, can terminate all biological activity. Water temperature is also important because of its influence on water chemistry. The rate of chemical reactions generally increases at higher water temperatures, which in turn affects biological activity.
Water temperature throughout the main waterbody (Levittown Lake Nos. 1, 2, and 3) varied seasonally, with slight differences among the stations (fig. 5). Temperatures mostly were higher from April to October 2010 and lower from November to March 2011. The highest temperature was recorded at Levittown Lake No. 2 (top of water column), and the lowest temperature was recorded at Levittown Lake No. 3 (top of water column).
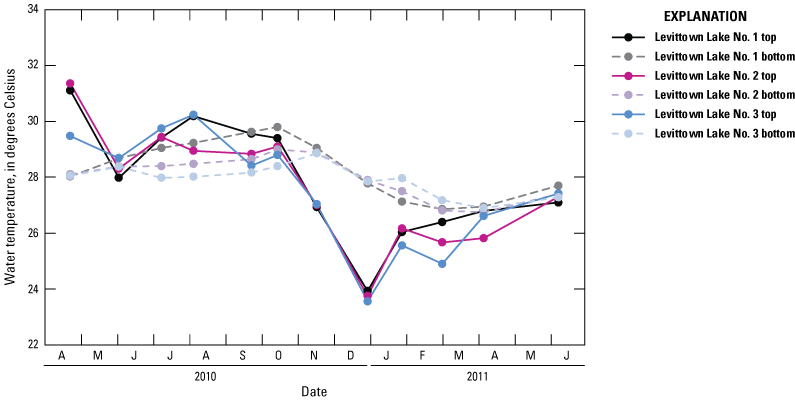
Monthly water temperatures in the main waterbody of Levittown Lake, Toa Baja, Puerto Rico, April 2010 to June 2011.
Water temperatures in Levittown Lake were less vertically stratified in the summer than in the winter, based on surface and bottom temperatures recorded within the main waterbody of the lake (Levittown Lake Nos. 1, 2, and 3). Temperatures at the bottom of the water column were noticeably higher than those at the top from November 2010 through March 2011 (fig. 5). This pattern may be due to the timing of the temperature measurements, which were made early in the morning when the water surface was in direct contact with cool nighttime air. The temperature gradient was reversed during the summer and early fall, with surface-water temperatures being higher at the top of the water column than at the bottom (fig. 5), thus showing the effect of the more intense sunlight exposure during this period compared to late fall and winter. The highest temperatures recorded in the main waterbody (Levittown Lake Nos. 1, 2, and 3) were just below the surface, within the top 1–2 m of the water column. This is probably where the most vigorous planktonic biochemical activity takes place, because plankton communities are generally most concentrated just below the water surface, thereby avoiding direct exposure to ultraviolet rays from the sun (Häder, 2011).
All temperature measurements at the lake were within the Puerto Rico Environmental Quality Board (PREQB) standards for Class SB waters, which establish that water temperature should not increase above 32.2 °C other than for natural causes (Puerto Rico Environmental Quality Board, 2014). The top water-column temperature in the main waterbody ranged from 23.6 °C on December 29, 2010, at Levittown Lake No. 3 to 31.4 °C on April 22, 2010, at Levittown Lake No. 2 (fig. 5). The bottom water-column temperature inside the waterbody ranged from 26.8 °C (April 6, 2011, at Levittown Lake No. 2) to 29.8 °C (October 14, 2010, at Levittown Lake No. 1).
Excluding the stations along the runoff and inlet/outlet channels (which are affected more by runoff and tides, respectively), the range of observed temperatures in the main waterbody can be divided into two general categories (fig. 5): the range during summer months and the range during winter months. The temperature differences between these categories are greatest at the top of the water column. During the winter months (December 2010 to March 2011) the temperature at the top of the water column ranged from 23.6 to 26.4 °C. The temperature at the bottom of the water column showed less variability (from 26.8 to 27.97 °C) than at the top of the water column during the winter months.
During spring and summer months (April–July 2010 and April–June 2011), the temperatures at the top of the water column were mostly warmer, ranging from 25.8 to 31.4 °C. The bottom water-column temperature during spring and summer ranged from 26.8 to 29.0 °C (fig. 5). Water temperature within Levittown Lake varied less by location than by season and the main waterbody seems to be subject to vertical stratification mostly during the winter months.
At Levittown Lake Nos. 4, 5, 6, and 7, in the inlet/outlet and runoff channels, water temperatures were mostly higher at the channel bottom than at the water surface (fig. 6). Stratification is more noticeable at these stations than in the main waterbody, and the stratification was observed throughout the entire year of data collection. These results were deemed reasonable, as these stations are more subject to external effects such as runoff (Levittown Lake Nos. 6 and 7), or tidal flux. Seasonal trends were also observed at Levittown Lake Nos. 4, 5, 6, and 7, with the lowest temperature measured at Levittown Lake No. 5 (December 2010) and the highest temperature measured at Levittown Lake No. 6 (April 2010).
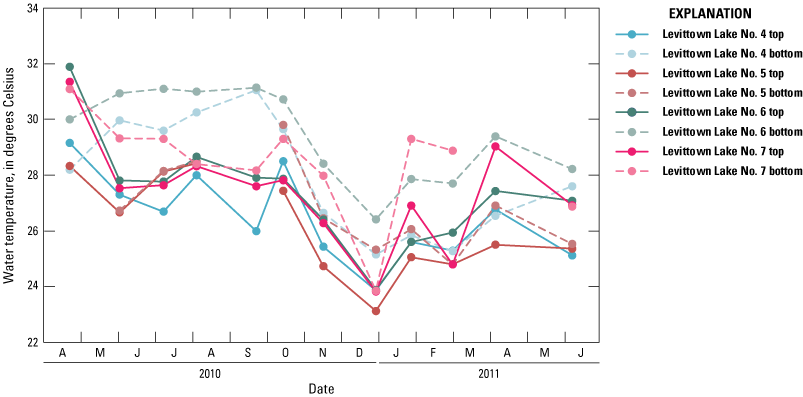
Monthly water temperatures in the inlet/outlet and runoff channels of Levittown Lake, Toa Baja, Puerto Rico, April 2010 to June 2011.
pH
pH is a measure of the activity of hydrogen ions and the pH of water affects the solubility and biological availability of chemical constituents, such as nutrients. In addition, pH can be a sign of biological processes, because photosynthesis consumes dissolved CO2. Removal of CO2 reduces the acidity of the water, thereby increasing water pH. In contrast, respiration of organic matter produces CO2, which dissolves in water to produce carbonic acid, thereby lowering water pH.
pH values varied seasonally near the top of the water column but were spatially uniform within the main waterbody of the lake (Levittown Lake Nos. 1, 2, and 3) and ranged from 7.3 to 9.1 standard units (fig. 7); seawater pH typically ranges from 7.3 to 8.5 as indicated by PREQB regulatory standards. Top and bottom pH values within the main waterbody were dissimilar, indicating vertical stratification, and the pH was always higher at the top of the water column than at the bottom. This is expected, because photosynthetic activity is greatest at the top where sunlight is most intense, thereby increasing pH to the greatest degree. Other properties measured directly in water (dissolved oxygen concentration and specific conductance) showed trends similar to those for pH, with disparities between top- and bottom-measured values in the lake and are later discussed in the report. The mean pH values measured at the surface and bottom of the water column were 8.1 and 6.9, respectively (PREQB regulatory standards recommend a pH range of 7.3–8.5 for coastal lagoons; Puerto Rico Environmental Quality Board, 2014).
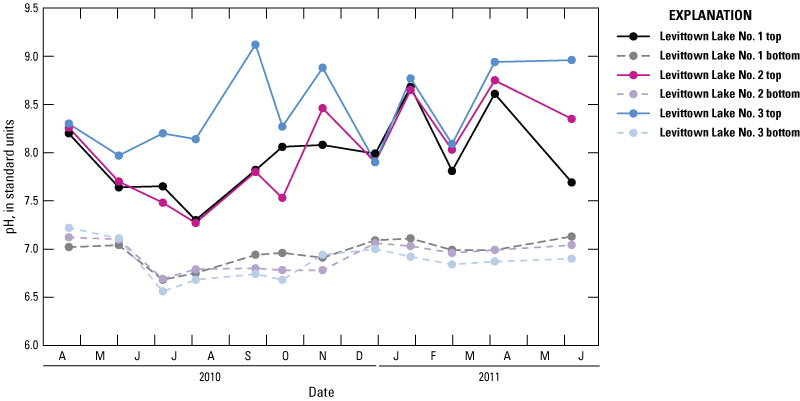
Monthly pH values in the main waterbody of Levittown Lake, Toa Baja, Puerto Rico, April 2010 to June 2011.
Less stratification is observed in the pH values measured at Levittown Lake Nos. 4, 5, 6, and 7 compared to the main waterbody. The pH values ranged from 7.22 to 8.59 at the top of water column and from 6.66 to 8.25 at the bottom of the water column (fig. 8). Seasonal variation in pH was also minor compared with other field water-measured properties.
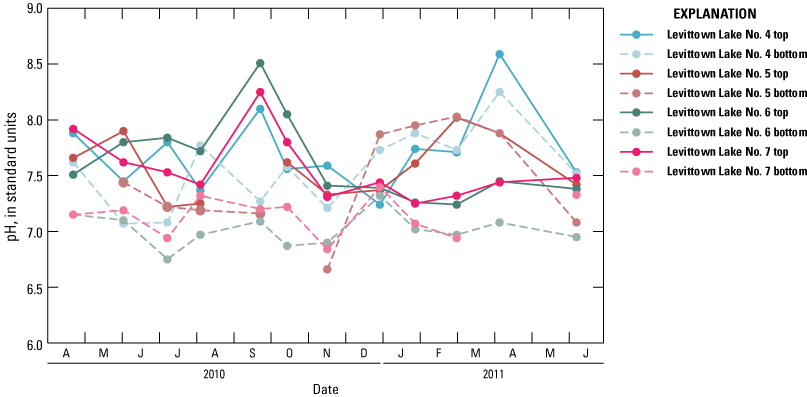
Monthly pH values measured in the inlet/outlet and runoff channels of Levittown Lake, Toa Baja, Puerto Rico, April 2010 to June 2011.
Dissolved Oxygen Concentration
The absolute concentration of DO in an aquatic system is controlled primarily by physical variables, such as water temperature, barometric pressure, and salinity, as well as by photosynthetic activity and community respiration. Monthly DO concentration measurements were used to evaluate water quality in terms of preestablished standards and to serve as a baseline for establishing long-term trends.
DO concentrations at the top of the water column in the main waterbody during the study period frequently did not comply with the PREQB standards (Puerto Rico Environmental Quality Board, 2014), which establish that the concentrations should be above 5.0 mg/L. In addition, no DO concentrations at the bottom of the water column were in compliance with PREQB standards. DO concentrations at the top of the water column in the main waterbody of the lake (Levittown Lake Nos. 1, 2, and 3) for many samples were above 5 mg/L (fig. 9). Bottom DO concentrations in the main waterbody were low, or anoxic, indicating that the lake bottom is devoid of aquatic vegetation and eutrophic conditions are present in the lake. The water-transparency data (discussed later) support this observation. DO concentrations at the top of the water column in the main waterbody ranged from 0.11 to 12.92 mg/L (fig. 9, Levittown Lake Nos. 1 and 3, respectively); DO concentrations at the bottom ranged from 0 to 1.63 mg/L at all three stations and Levittown Lake No. 1, respectively.
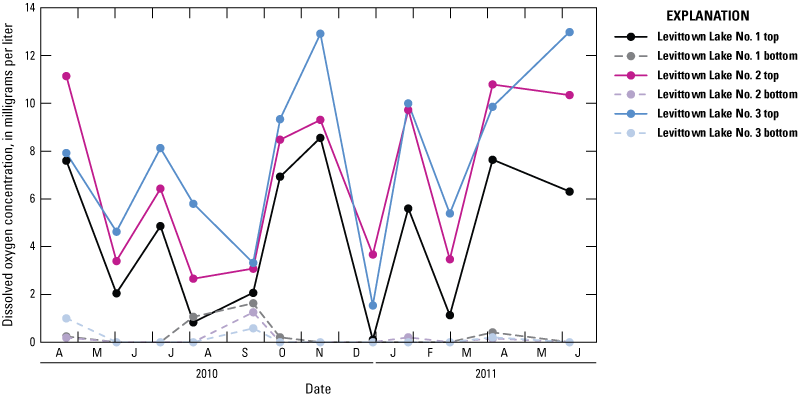
Monthly dissolved oxygen concentrations in the main waterbody of Levittown Lake, Toa Baja, Puerto Rico, April 2010 to June 2011.
Monthly variations in DO concentrations were generally lower at the inlet/outlet and runoff channel stations (Levittown Lake Nos. 4, 5, 6, and 7; fig. 10) than in the main body of the lake (Levittown Lake Nos. 1, 2, and 3). Most DO concentrations at the bottom of the water column in the inlet/outlet channel, Levittown Lake No. 4, were slightly greater than values at the top (fig. 10A), indicating that oxygen-saturated seawater was flowing across the channel bottom, as indicated by specific conductance data. Per figure 10B, Levittown Lake No. 7 has a DO range from 0 to 6.79 mg/L, the greatest of all sites. Fecal coliform bacteria data (discussed later) indicate this is the most impaired area of the lake system. Top and bottom DO concentrations ranged from 0 to 3.35 mg/L at Levittown Lake No. 6, and from 0 to 6.79 mg/L at Levittown Lake No. 7 (fig. 10B).
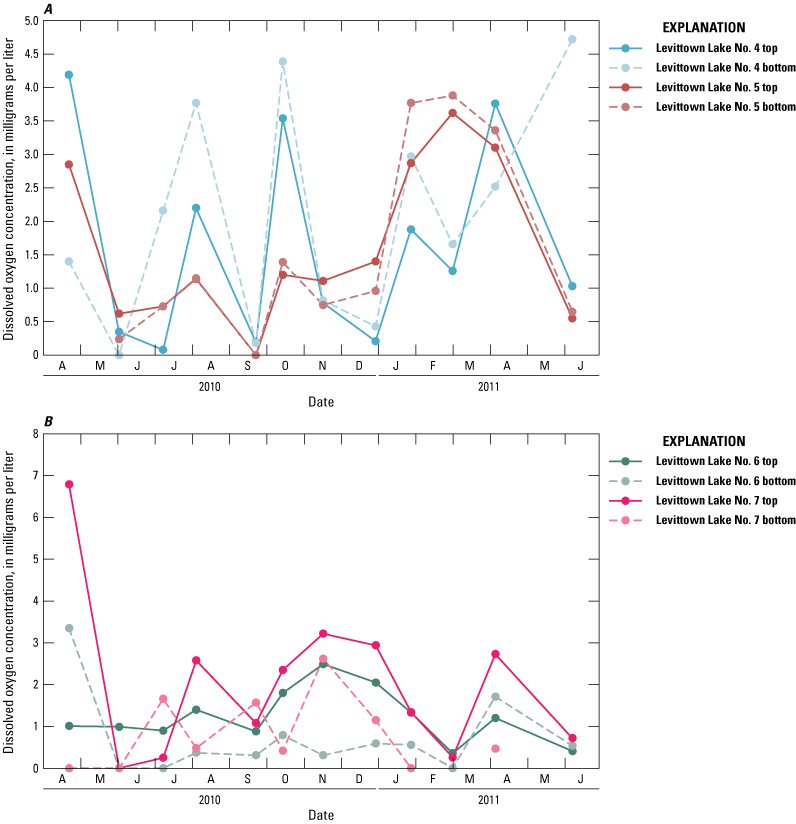
Monthly dissolved oxygen concentrations at stations in A, the inlet/outlet channel (Levittown Lake Nos. 4 and 5) and, B, the Caño El Hato drainage canal (Levittown Lake Nos. 6 and 7) of Levittown Lake, Toa Baja, Puerto Rico, April 2010 to June 2011.
Specific Conductance
Specific conductance is a measure of the capacity of water (or other substance) to conduct an electrical current. Specific conductance is a function of the types and quantities of dissolved constituents and can be used to approximate dissolved-solids concentrations in water. The concentration of dissolved solids, expressed in milligrams per liter, is typically 55–75 percent of the specific conductance in µS/cm at 25 °C (Díaz and others, 2004). Specific conductance is linearly correlated with salinity by the relation described in Clesceri and others (1998) and is often used as a proxy.
The specific conductance of samples collected in the main waterbody at Levittown Lake Nos. 1, 2, and 3 ranged from 1,950 to 33,500 μS/cm at 25 °C near the top of the water column (fig. 11) and from 36,800 to 51,600 μS/cm at 25 °C near the bottom.
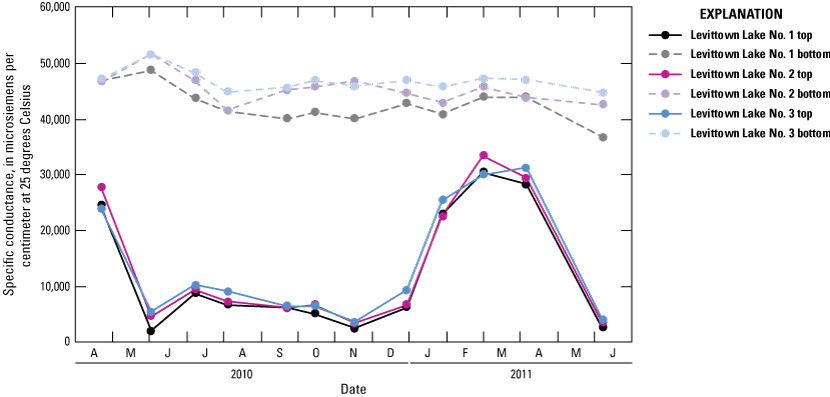
Monthly specific conductance values in the main waterbody of Levittown Lake, Toa Baja, Puerto Rico, April 2010 to June 2011.
Specific conductance in the lake varied seasonally and was associated with rainfall/runoff episodes (fig. 11). Specific conductance values were lowest between June and December 2010 at the top of the water column, a period that includes all but one of the wettest months of the year (table 3). Vertical stratification of specific conductance was marked in Levittown Lake Nos. 1, 2, and 3, indicating seawater influx to the lake (fig. 11). In the inlet/outlet channel (Levittown Lake Nos. 4 and 5), specific conductance was less vertically stratified as a result of seawater influence. In the runoff channel (Levittown Lake Nos. 6 and 7), specific conductance was also vertically stratified (fig.12). The PREQB has not established specific conductance standards (Puerto Rico Environmental Quality Board, 2014).
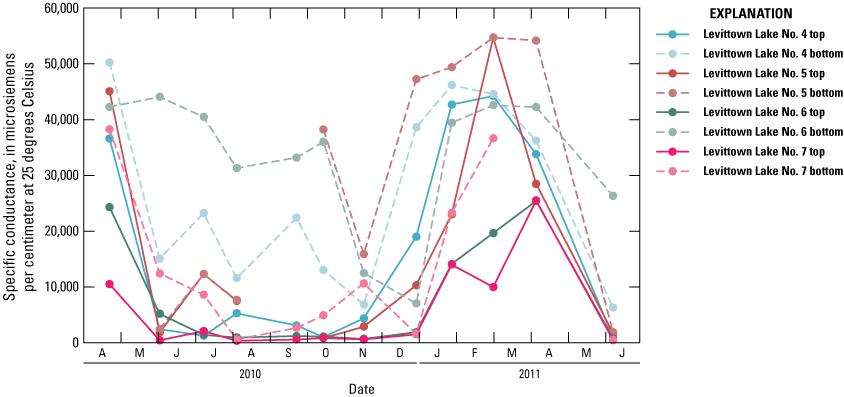
Monthly specific conductance values in the inlet/outlet channel and Caño El Hato drainage canal of Levittown Lake, Toa Baja, Puerto Rico, April 2010 to June 2011.
Water Transparency
Water transparency is a physical water property that has ecological and recreational importance. Specifically, water transparency affects sunlight penetration, and thus photosynthetic activity, and is an aesthetically valuable characteristic. Water transparency and light penetration can be reduced by natural factors such as inorganic particulate matter, plankton biomass, and humic and fulvic acids produced from decomposing organic matter. Biologists consider the depth of the euphotic zone to be roughly three times the measured Secchi disk depth. The euphotic zone is defined as the upper layer of a waterbody into which enough light penetrates to permit the growth of green plants and algae.
Water transparency in the main waterbody of the lake was generally low compared to the mean water depth of about 5 m (based on bathymetric study), with the Secchi disk depth of disappearance ranging from 15 to 61 cm, and a mean depth of 46 cm; therefore, the euphotic zone in the main waterbody extended less than 1.4 m below the top of the water column. Water transparency ranged from 0.26 m to 1.0 m (fig. 13), determined by multiplying the mean depth of Secchi disk disappearance by 1.7 (Scheffer, 2004). The mean depth water transparency was 0.8 m, indicating that aquatic vegetation growth is inhibited by poor light penetration. No aquatic plant growth was observed on the channel bottoms, however, possibly because of the poor water quality and associated poor sediment quality at these sites.

Monthly water transparency in the main waterbody of Levittown Lake, Toa Baja, Puerto Rico, April 2010 to June 2011.
Laboratory Evaluated Constituents
Water chemistry determinations for Levittown Lake included nutrient concentrations (N and P) and chlorophyll a concentrations. Nutrients are indicators of trophic levels, and chlorophyll a is an indicator of photosynthetic activity as well as trophic level. Turbidity, a physical property and good indicator of water quality, is another constituent evaluated in the laboratory and was measured only in the main body of the lake through water samples collected on a monthly basis at Levittown Lake Nos. 1 and 3.
Nitrogen and Phosphorus
Nutrients are elements and compounds essential to sustain plant and animal life (Hutchinson, 1973). N and P compounds are considered to be the most important in aquatic ecosystems because they are often limiting factors. Waters that have ambient nutrient concentrations can become enriched by organic matter decay, autotrophic or heterotrophic processes, and runoff. Human and animal activities, as well as poor soil conservation practices, can also increase nutrient contributions to waters that have background concentrations of N and P compounds. Several chemical species of N, such as ammonium, nitrite, nitrate, and orthophosphorus, are the primary anthropogenic contaminants related directly to eutrophication. Excessive concentrations of these constituents can lead to increased densities of planktonic and benthic algae, as well as substantial daily variation in DO concentrations and pH (Webb and Gómez-Gómez, 1997).
Total N measurements in the lake indicate this constituent is distributed uniformly at concentrations substantially below the PREQB standard of 5.0 mg/L for Class SB waters (Puerto Rico Environmental Quality Board, 2014). Concentrations at Levittown Lake No. 1 ranged from 0.61 to 2.36 mg/L (occurring in September 2010 and November 2010, respectively), with a mean value of 1.42 mg/L (table 4, fig. 14). At Levittown Lake No. 3, total N concentrations ranged from 0.79 to 1.98 mg/L, with a mean value of 1.14 mg/L. The minimum and maximum total N concentrations at Levittown Lake No. 3 were recorded in July 2010 and March 2011, respectively.
Table 4.
Total nitrogen species concentrations at Levittown Lake stations, Toa Baja, Puerto Rico, April 2010 to June 2011.[N, nitrogen; NH4+, ammonium; NO3-, nitrate nitrogen; NO2-, nitrite nitrogen. All concentrations as N, in milligrams per liter]
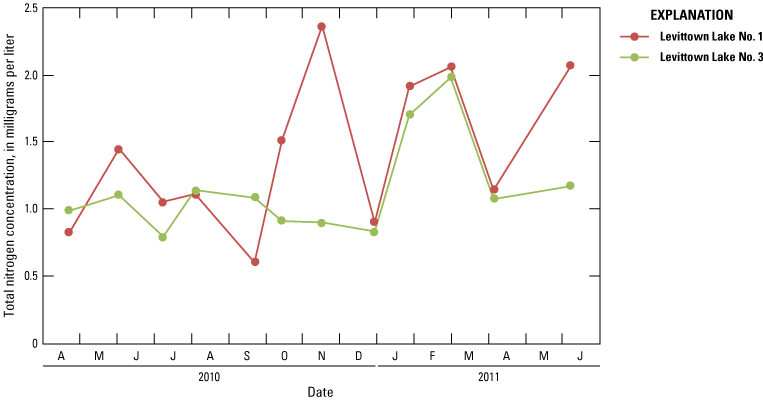
Monthly total nitrogen concentrations in the main waterbody of Levittown Lake, Toa Baja, Puerto Rico, April 2010 to June 2011.
Most of the N measured in the lake was in the form of organic N, having an overall mean concentration of 0.87 mg/L at Levittown Lake Nos. 1 and 3 and composing roughly 68 percent of the total N as N present (table 4). The next most predominant N species was ammonium, having mean concentrations of 0.483 and 0.213 mg/L at Levittown Lake Nos. 1 and 3, respectively. The overall average ammonium concentration for both sites was 0.348 mg/L, composing 27 percent of the total N as N present. Nitrite and nitrate were less abundant, having overall mean concentrations of 0.013 and 0.047 mg/L N, respectively, and composing roughly 1 and 4 percent of the total N as N present.
The high proportion of total N accounted for by organic N and ammonium, compared to the proportion available as nitrate and nitrite, is typical of eutrophic water bodies because of the rapid uptake of the reduced states of N by photosynthetic activity. In the absence of regular stream inflow to the lake, the high concentrations of total N in its different species can be accounted for by nutrient-rich, high-rainfall/runoff events as well as decomposition and metabolism of organic matter within the lake itself.
Total P concentrations in the lake ranged from 0.07 to 0.34 mg/L as P, well below the PREQB standard of 1.0 mg/L for Class SB waters (Puerto Rico Environmental Quality Board, 2014). The highest concentration was measured in November 2010, and the mean concentrations for both stations (Levittown Lake Nos. 1 and 3) were 0.21 mg/L and 0.15 mg/L, respectively (fig. 15, table 5). Total P concentrations at Levittown Lake No. 1 ranged from 0.07 mg/L (September 2010) to 0.34 mg/L (November 2020). In Levittown Lake No. 3, the total P concentrations ranged from 0.10 mg/L (December 2010) to 0.21 mg/L (March 2011). Figure 15 and table 5 show the total P concentrations in the main waterbody of Levittown Lake.
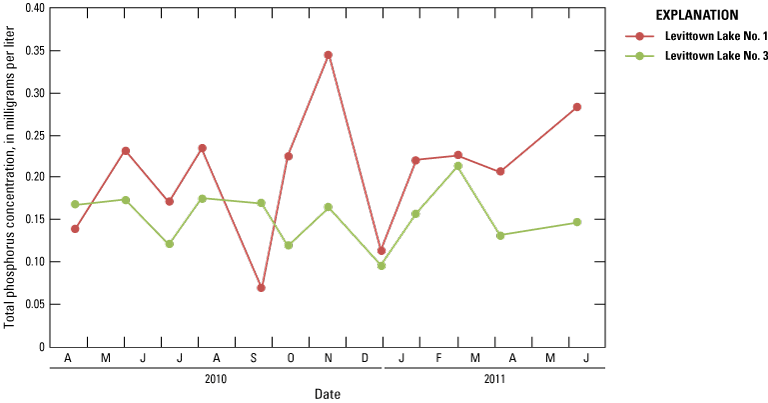
Monthly total phosphorus concentrations in the main waterbody of Levittown Lake, Toa Baja, Puerto Rico, April 2010 to June 2011.
Table 5.
Total phosphorus concentration at Levittown Lake stations, Toa Baja, Puerto Rico, April 2010 to June 2011.[All concentrations as total phosphorus (P), in milligrams per liter]
The low P concentrations in the lake suggest that available P uptake occurs rapidly through photosynthetic activity by planktonic flora and that P may limit primary production. The total P concentrations measured in the lake were substantially lower than those measured in other coastal lagoons in Puerto Rico, where concentrations are greater than 1 mg/L. For example, in Laguna de las Salinas in Ponce, Puerto Rico (fig. 1), the mean total P concentration was 1.86 mg/L (Soler-López and others, 2005). Other ecosystems that have been studied are Laguna San José and Laguna de Piñones with mean P concentrations of 1.0 and 2.5 mg/L, respectively (U.S. Geological Survey, 2021; Soler-López and Santos, 2010).
Redfield and others (1963) found that the atomic ratios of carbon (C), N, and P are related generally by a C:N:P ratio of 106:16:1 in planktonic tissue, which is known as Redfield's ratio. Because C is more abundant than N and P in plant tissue (and in all living organisms), this ratio can be simplified to the total N to total P ratio (TN/TP). By sampling for these constituents in aquatic ecosystems, their ratio can be used to determine the potential for phytoplankton and plant growth in ambient waters. According to Vollenweider (1968), TN/TP ratios exceeding a value of 15 indicate that P is the limiting factor for phytoplankton and aquatic plant growth. The TN/TP mean ratio in Levittown Lake was 7.2, indicating that P concentrations in the lake are not a limiting factor for phytoplankton growth and that the element is present in adequate quantities.
Chlorophyll a
Chlorophyll a is the principal photosynthetic pigment in vascular plants and algae, converting sunlight into the chemical energy needed to fix CO2 into carbohydrates. The pigment was sampled at Levittown Lake Nos. 1 and 3 to provide a reasonable estimate of the algal biomass in the lake (fig. 2).
Chlorophyll a data collected during this study indicate that Levittown Lake is eutrophic. Concentrations were dissimilar between Levittown Lake Nos. 1 and 3, averaging 36.46 and 64.92 micrograms per liter (µg/L), respectively. Concentrations ranged from 3.05 to 212.42 µg/L for both sites (fig. 16).
Maximum concentrations of chlorophyll a concentrations at Levittown Lake No. were measured in April 2011, and the lowest concentrations were measured in June 2010. The highest concentrations of chlorophyll a at Levittown Lake No. 3 were measured in September 2010 and June 2011, and the lowest were measured in June 2010 (fig. 16, table 6). Although the high chlorophyll a concentration measured in September 2010 was initially thought to be an outlier, biomass concentrations measured on the same date were also high, validating the chlorophyll a result. The mean chlorophyll a concentration of 50.7 µg/L for the lake was considerably higher (indicating marked eutrophication) than in other coastal lagoons, such as Laguna de Las Salinas where the mean concentration was 14.0 µg/L (Soler-López and others, 2005). Chlorophyll a concentrations ranged between 14.0 and 23.0 µg/L in Laguna San José, and the mean concentration was about 26.0 µg/L in Laguna de Piñones (Soler-López and Santos, 2010; U.S. Geological Survey, 2021).
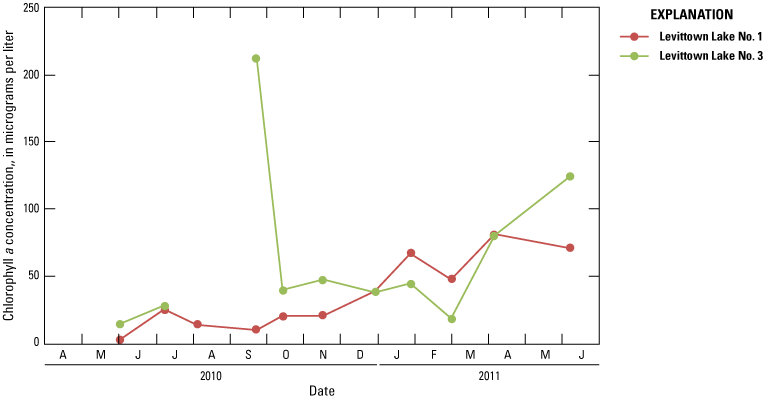
Monthly chlorophyll a concentrations in the main waterbody of Levittown Lake, Toa Baja, Puerto Rico, April 2010 to June 2011.
Table 6.
Chlorophyll a concentration at Levittown Lake stations, Toa Baja, Puerto Rico, April 2010 to June 2011.[Del, sample damaged. All concentrations are in micrograms per liter]
Turbidity
Turbidity caused by suspended colloidal particles is a measure of water clarity. The amount of total suspended solids in water is inversely related to clarity and directly related to measured turbidity. High concentrations of particulate matter can reduce light penetration and can lead to rapid siltation of shallow lakes and bays, effectively smothering benthic habitats.
Turbidity was measured at Levittown Lake Nos. 1 and 3 to account for runoff entering the main waterbody of the lake. Turbidity at Levittown Lake No. 1 ranged from 3.35 to 15.60 nephelometric turbidity units, measured in December 2010 and August 2010, respectively. At Levittown Lake No. 3, turbidity ranged from 3.15 to 14.90 nephelometric turbidity units, as measured during November 2010 and January 2011, respectively (fig. 17, table 7). No major differences are observed when comparing the turbidity values between Levittown Lake No. 1 and Levittown Lake No. 3 throughout the period of water samplings except for the turbidity measured in August 2010.
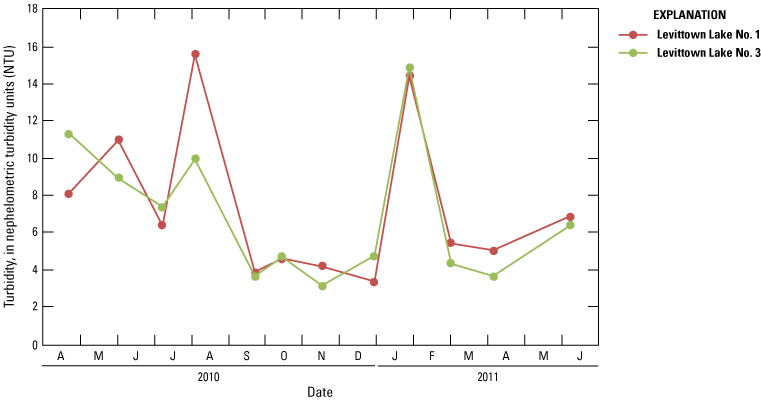
Monthly turbidity values in the main waterbody of Levittown Lake, Toa Baja, Puerto Rico, April 2010 to June 2011.
Table 7.
Turbidity at Levittown Lake stations, Toa Baja, Puerto Rico, April 2010 to June 2011.[All values are in nephelometric turbidity units]
Biological Characteristics
Primary productivity, phytoplankton biomass, and fecal indicator bacteria concentrations in the lake were determined to characterize biotic conditions within its aquatic ecosystem. Levittown Lake appears to be eutrophic, with high primary productivity, and it constitutes an important food supply for primarily aquatic organisms. Fecal indicator bacteria were present in relatively high concentrations near developed areas compared to concentrations at the center of the lake.
Phytoplankton Net Primary Productivity, Plankton Respiration, and Plankton Gross Productivity
Light and dark bottle primary productivity measurements were made to determine the net primary productivity by phytoplankton, plankton respiration, and gross primary productivity. An uncertainty associated with the method in which primary productivity is calculated is the effect of the incubation time, which is based on the early hours only; therefore, the representativeness of the results to the full diurnal cycle is not clear. This method also assumes that the conditions controlling phytoplankton production and respiration in the bottles are the same as those outside, and this particular study only provides primary productivity measurements on a monthly basis. Table 8 summarizes the primary productivity results obtained using the light and dark bottle method at Levittown Lake Nos. 1 and 3. The DO concentrations shown in table 8 represent the average of two titrations for each of the two light bottles and the average of two titrations for each of the two dark bottles. Therefore, each individual initial oxygen, light bottle oxygen, and dark bottle oxygen value presented in table 8 is the average of four separate titrations. Analyses of high initial DO concentration and saturation values are seldom used in primary productivity calculations, because when water is supersaturated, oxygen production over time is minimal or does not occur. In the case of Levittown Lake, data were not excluded because DO concentrations increased, indicating net primary production.
Table 8.
Primary productivity results obtained by the light and dark bottle method at Levittown Lake stations, Toa Baja, Puerto Rico, April 2010 to June 2011.[All dissolved oxygen values are in milligrams per liter. All productivity and respiration rates are in milligrams of oxygen per liter per hour. DO sat., dissolved oxygen saturation, in percent; OI, initial oxygen; OL, light bottle oxygen; OD, dark bottle oxygen; GP, gross productivity; NP, net productivity; R, respiration; IT, incubation time, in hours. Values in bold are at or near saturation]
Given that rates of DO production and consumption are measures of photosynthesis and respiration, results of the light and dark bottle primary productivity studies indicate that the plankton community in Levittown Lake is very productive. The phytoplankton yielded an average net productivity of 0.50 milligram of oxygen per liter per hour (mgO2/L-h) for both sites (Levittown Lake Nos. 1 and 3), and the plankton yielded an average respiration rate of 0.39 mgO2/L-h (table 8). The average plankton gross productivity was 0.89 mgO2/L-h (0.50 + 0.39 = 0.89).
Multiplying the hourly net productivity of grams of oxygen per cubic meter (0.5 gO2/m3) by 0.375 provides an estimate of the net organic C produced (Fox, 2000). Therefore, phytoplankton in the lake water column had an estimated hourly net organic C production of about 0.19 gram of carbon per cubic meter (gC/m3). By comparison, the net productivity in Levittown Lake was greater than other values observed for coastal upwelling zones (Sverdrup and others, 1942), where nutrient-rich waters move upward by currents and wind and are considered to be very productive. In addition, the net productivity for Levittown Lake was also three times the hourly net production of 0.06 gC/m3 calculated for Laguna de las Salinas (Soler-López and others, 2005), and about five times that of Laguna Grande (0.04 gC/m3) in Fajardo, Puerto Rico (Soler-López and Santos, 2010).
Community Net Primary Productivity, Respiration, and Gross Productivity
Diel studies were conducted in the lake to estimate the community net primary productivity, the respiration rate, and the gross productivity. Data associated with this study (Soler-López, 2022) summarize the DO concentrations for diel studies on November 18, 2010, and May 18, 2011, at Levittown Lake Nos. 1, 2, and 3, along with temperature, pH, specific conductance, and salinity data. Figure 18 shows dissolved oxygen concentrations at Levittown Lake Nos. 1, 2 and 3 collected during the diel studies. The results showed that the dissolved oxygen concentration curves generated from the diel studies differed from the typical diurnal curve, which is characterized by increased DO concentrations during the daylight hours (caused by photosynthesis-driven process) and decreasing DO concentrations during the nighttime hours when community respiration predominates. For example, on November 18, 2010, DO concentration and saturation at Levittown Lake No. 1 gradually decreased until approximately 8:00 a.m., increased markedly after 9 a.m., reached a maximum at about 11:00 a.m., decreased at 12:00 p.m., and increased again steadily until about 2:00 p.m. (fig. 18A). DO concentrations started decreasing again at 5:00 p.m. when respiration became more active (fig. 18A).
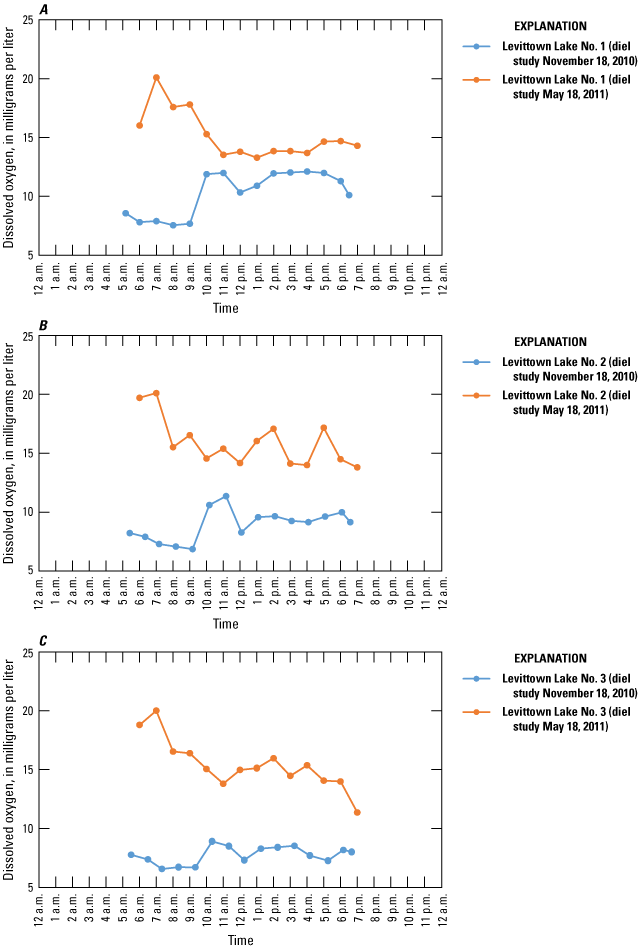
Dissolved oxygen concentration for November 18, 2010, at Levittown Lake stations in Levittown Lake, Toa Baja, Puerto Rico.
Although both diel studies were initiated before dawn and terminated after sunset, the information needed to determine usable estimates for community productivity is not available. The diel oxygen data and subsequent calculations of community net primary productivity, respiration rate, and gross productivity have associated uncertainties and limitations for the following reasons:
-
A complete 24-hour diurnal cycle would be necessary to use the diel method (Odum, 1956), which is based on the analysis of the changes in DO concentrations that occur during daylight (production of DO) and night (consumption of DO is more active) hours.
-
Initial oxygen concentrations were extremely high, on the order of 8–19 mg/L; therefore, results could have been impractical if the expected diurnal pattern of productivity could not be determined.
-
All bottom dissolved oxygen concentrations were 0 mg/L, indicating anoxic conditions, which suggested no substrate oxygen production by benthic communities.
-
Such extreme oxygen concentration conditions were documented only twice during the study and thus cannot be considered representative of the metabolic conditions of the lake, contrary to the conditions documented during approximately monthly samplings, which are considered more representative.
The stations used for the diel study (Levittown Lake Nos. 1, 2, and 3) were located at the deepest parts of the lake to compare the diel results with the light and dark bottle productivity. At these stations, water transparency measurements indicated that sunlight did not reach the lake bottom; therefore, benthic oxygen-producing organisms are considered nonexistent in these deep areas. Benthic primary producers must be located at areas of the lake where water depths are about 1.4 m according to Secchi disk water transparency measurements (mean 46 cm). Based on the bathymetric map of Levittown Lake (fig. 3), benthic oxygen-producing organisms should be located along the entire littoral zone of the lake and in an area northeast of Levittown Lake No. 1.
Other uncertainties or challenges associated with the analysis of the collected DO concentration measurements during diel studies are related to components such as solar radiation, vertical and horizontal mixing, and the air-water exchange. Although the analysis of these factors is beyond the scope of the study, future studies may consider combining this method with others that allow (1) the effect of solar radiation to be integrated, (2) the continuous monitoring of DO concentrations rather than collecting only 2 days of data, and (3) the installation of sensors at different depths. To assess how representative the diel study made at Levittown Lake is, the solar radiation that was recorded on the day of primary production measurements was compared with the mean solar radiation that could typically be expected for a given day of the year (fig. 19). To this end, the average solar radiation for a given day of the year was calculated using the time-series data for daily solar radiation for the period from January 1, 2010, to December 31, 2017 (PRAGWATER, 2020). The results indicated that solar radiation input during the dates of the diel studies and light and dark bottle water samplings is mostly representative of the corresponding solar radiation input expected for those days of the year. Some exceptions occurred during the diel study conducted in May 2010 and during a few light and dark bottle water samplings.
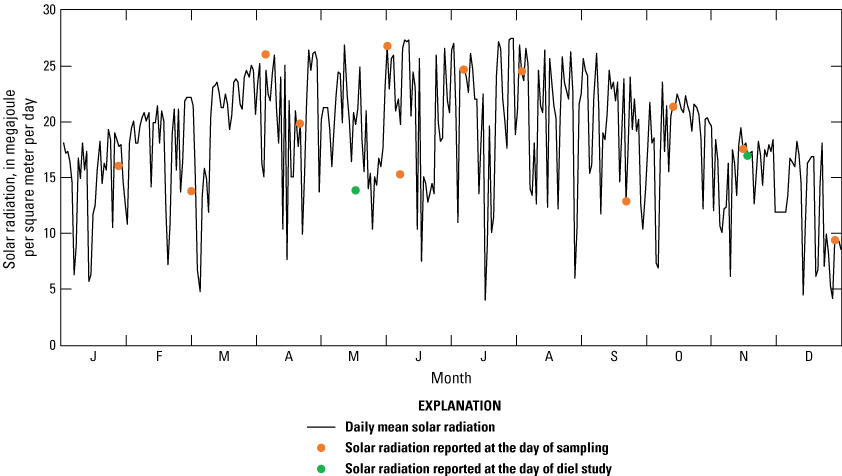
Daily mean solar radiation values during the year, computed from the period of January 1, 2010, to December 31, 2017, over the area of Levittown Lake, Toa Baja, Puerto Rico, and actual solar radiation values recorded during the diel studies and light and dark bottle water samplings conducted between April 2010 and June 2011.
Phytoplankton Biomass
Phytoplankton biomass is defined as the mass or weight of photosynthetic organisms present in the water column per unit area or volume at a given instant in time (Wetzel, 2001) and is synonymous with phytoplankton standing crop. Phytoplankton biomass (B) was determined in the lake at Levittown Lake Nos. 1 and 3, where light and dark bottle primary productivity measurements were made from April 2010 to June 2011 (fig. 2, table 1). The phytoplankton biomass at the two stations in the lake ranged from 6.0 mg/L on June 2, 2010, to 112.5 mg/L on September 22, 2010 (fig. 20, table 9). The spike in biomass at Levittown Lake No. 3 in September 2010 led to an analysis of this phytoplankton sample compared to the other samples. The average phytoplankton biomass between April 2010 and June 2011 was 19.05 mg/L, which is equal to 19.05 grams per cubic meter. Based on Secchi disk data (mean depth of 46 cm) and the defined vertical extent of the euphotic zone, the productive layer of the lake had a water volume of 366,000 m3. Therefore, the lake contained a phytoplankton biomass of approximately 6.9 tons.
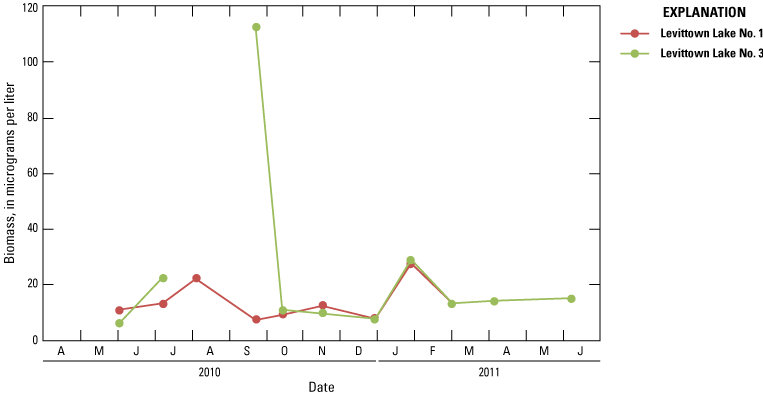
Monthly biomass concentrations in the main waterbody of Levittown Lake, Toa Baja, Puerto Rico, April 2010 to June 2011.
Table 9.
Phytoplankton biomass at Levittown Lake stations, Toa Baja, Puerto Rico, April 2010 to June 2011.[All concentrations are in milligrams per liter. Del, sample damaged]
Fecal Indicator Bacteria
Microorganisms such as fecal coliform bacteria can be used to indicate the presence of human and animal waste in a waterbody. Because coliform bacteria cannot live for prolonged periods outside a host organism, a positive test result indicates recent fecal contamination or inadequate sewage treatment
Potential sources of fecal contamination in the lake are (1) sewage overflows from sewer mains located along the eastern shore of Levittown Lake, (2) illegal connections between sewer and storm drains that may have been created in the early 1960s during construction of the Levittown community when regulations were either absent or not enforced, and (3) feces from large populations of green iguanas, pets, and other fauna that inhabit the surrounding lakeshore.
The PREQB fecal coliform standard for Class SB waters specifies that the geometric mean concentration of at least five samples collected sequentially should not exceed 200 colonies per 100 milliliters (col/100 mL), and not more than 20 percent of the samples should exceed 400 col/100 mL (Puerto Rico Environmental Quality Board, 2014). The regulations do not specify a time period during which the sequential samples must be obtained.
Fecal coliform concentrations exceeded the 200 col/100 mL PREQB standard at all stations during all samplings except for the sample collected on March 2, 2011, at Levittown Lake No. 5, near the mouth of the inlet/outlet channel, when fecal coliform concentrations were 10 col/100 mL (fig. 21). This very low concentration coincided with floodtide flow conditions and does not represent water from the lake itself but rather incoming seawater.
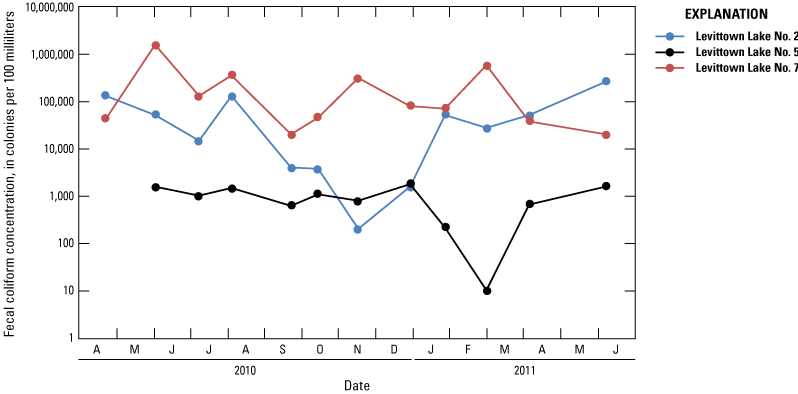
Monthly fecal coliform concentrations at selected stations in the Levittown Lake study area, Toa Baja, Puerto Rico, April 2010 to June 2011.
The highest fecal coliform concentrations observed during this study were at Levittown Lake No. 7 at the runoff channel, where the fecal bacteria concentrations greatly exceeded the 200 col/100-mL standard, with the lowest concentration being 20,000 col/100 mL. The second most affected area of the lake was at Levittown Lake No. 2, in the middle of the main waterbody of the lake, where concentrations ranged between 200 and 260,000 col/100 mL. Levittown Lake No. 5, at the inlet/outlet channel, was least affected by fecal contamination, probably because of the diluting effect of seawater influx driven by daily changes in tide.
Summary and Conclusions
Levittown Lake is a 30-hectare, man-made brackish lake located in the municipality of Toa Baja, on the northern coast of Puerto Rico just west of San Juan. The lake was created to drain the marshland over which the Levittown community was built. Levittown Lake is surrounded by densely populated areas to the north, east, and south, and is bordered by an extensive vegetated buffer zone to the west. A 1.6-kilometer inlet/outlet channel connects the lake to the Río Cocal and ultimately to the Atlantic Ocean. The U.S. Geological Survey, in cooperation with the Puerto Rico Department of Natural and Environmental Resources, collected and evaluated hydrologic, water-quality, and biological data from April 2010 to June 2011 to characterize the water quality of Levittown Lake and to establish a baseline for its management as a coastal environmental resource.
Although Levittown Lake was initially intended to be a drainage system for Levittown, the results from the characterization of water-quality and biological properties indicate that the lake functions as an aquatic ecosystem that supports a trophic chain. With its inlet/outlet channel connecting the lake to the ocean, Levittown Lake may be operating as a typical coastal lagoon by exporting organic matter to the ocean, supporting the food chain, and removing carbon dioxide from the atmosphere. Levittown Lake may have become an integral part of the nearby coastal resources as an important ecological component and carbon dioxide filter in the middle of a heavily developed and populated zone.
Historical rainfall data collected 9 kilometers southeast of the study area indicate that the rainfall data collected in the study area during 2010 was greater than the corresponding long-term monthly means for the area. Tidal oscillations within the lake were about 10 centimeters regardless of ocean tides. During normal wind and tide conditions, the estimated daily flushing rate for the lake is about 2 percent of its water volume, which corresponds to a flushing rate of once every 48 days or about 7.6 times per year. A bathymetric survey indicated that Levittown Lake has a water volume of approximately 1.35 million cubic meters. At the time of this study, the maximum depth of the lake bottom was about 8 meters (m) below mean sea level and the mean depth was about 5 m below mean sea level.
With some exceptions, the physical and chemical properties of the water in Levittown Lake generally were found to be in compliance with Puerto Rico Environmental Quality Board (PREQB) Class SB regulatory standards. The lake exhibited temporal rather than areal variations in water temperature and marked vertical stratification within the main waterbody. The top water-column temperatures ranged from about 23.6 to 31.4 °C, and the bottom water-column temperatures ranged from 26.9 to 29.8 °C. The pH at the lake surface ranged from 7.3 to 9.1, with the upper value exceeding PREQB standards (8.3–9.1). Dissolved oxygen concentrations at the lake surface ranged from 0.1 to 12.9 milligrams per liter (mg/L) and varied areally and temporally, with dissolved oxygen concentrations diminishing with increasing depth . Bottom dissolved oxygen concentrations were always below the PREQB regulatory standards (5 mg/L), indicating that the lake bottom is barren and supports no aquatic plant growth.
Specific conductance and salinity in the main waterbody of the lake varied temporally and vertically, but not areally, and these variations were directly associated with coastal tides and rainfall runoff. Specific conductance and salinity at the top of the water column were always lower than at the bottom, indicating marked vertical stratification, and these values varied temporally, with lower values associated with increased rainfall. Water transparency was consistently low, with all Secchi disk depth readings being less than 65 centimeters in this lake of mean 5-m depth.
Total nitrogen and total phosphorus concentrations were below the PREQB standards of 5 and 1 mg/L, respectively. Total N concentrations ranged from 0.61 to 2.36 mg/L, with a mean of about 1.42 mg/L at the Levittown Lake No. 1 station. Of the N species present in Levittown Lake, organic N composed about 68 percent of the total N, ammonium composed 27 percent, and nitrate and nitrite collectively composed the remaining 5 percent. Total P concentrations ranged from 0.07 to 0.34 mg/L, with a mean of 0.18 mg/L. The average concentration of chlorophyll a ranged from about 3.05 to 212.4 micrograms per liter, with a mean concentration of 50.7 micrograms per liter.
Primary productivity measurements were made using the light and dark bottle method at about monthly intervals between April 2010 and June 2011 during the morning hours. Because these measurements were restricted to the morning hours, a qualification of the representativeness of the results to the full diurnal cycle is necessary. The average phytoplankton net primary productivity was about 0.5 gram of oxygen per cubic meter per hour, the plankton respiration rate was about 0.39 gram of oxygen per cubic meter per hour, and the mean hourly plankton gross productivity was 0.89 gram of oxygen per cubic meter. The rate of net organic carbon production in Levittown Lake was high, about 0.19 gram of carbon per cubic meter.
The average phytoplankton biomass values in Levittown Lake ranged from 6.0 to 112.5 mg/L. Levittown Lake is estimated to have contained a phytoplankton biomass of about 6.9 tons during the study period. The computation of community net primary productivity, respiration, and gross productivity was planned through the assessment of the diurnal patterns in dissolved oxygen concentration; however, conditions during the diel studies limited the ability to assess community metabolism.
Fecal indicator bacteria samples were collected at about monthly intervals during the study at three locations. Fecal coliform bacteria concentrations ranged from 10 to 1,540,000 colonies per 100 milliliters, which exceeded the PREQB standard of 200 colonies per 100 milliliters at most of the sampling stations, particularly in the runoff channel and main waterbody.
The data obtained from this study will provide stakeholders and managers with a holistic perspective of the local hydrology and its relation to water-quality conditions in Levittown Lake. Water-quality conditions could possibly improve substantially if the flushing rate of the lake is increased by redirecting seawater flood flow into the lake or by widening the inlet/outlet channel to allow more seawater flow.
References Cited
Environmental Systems Research Institute, Inc., 2021, Fundamentals of creating TIN surfaces: Redlands, California, Environmental Systems Research Institute, Inc., accessed October 25, 2022, at https://desktop.arcgis.com/en/arcmap/latest/manage-data/tin/fundamentals-of-creating-tins.htm.
Fox, R., 2000, Phytoplankton primary productivity—Laboratory exercises for biology 306: Greenwood, South Carolina, Lander University web page, accessed October 2004 at http://www.lander.edu/RSFOX/306prod-BLab.html.
Gómez-Fragoso, J.M., and Santiago-Sáez, J.A., 2018, Hydrologic and water-quality characteristics of Caño Boquerón, Cabo Rojo, and Puerto Mosquito, Isla de Vieques, Puerto Rico, July 2015–July 2016: U.S. Geological Survey Scientific Investigations Report 2018–5018, 34 p., accessed March 24, 2021, at https://pubs.er.usgs.gov/publication/sir20185018.
Häder, D.P., 2011, Ultraviolet effects on phytoplankton: Möhrendorf, Germany, Photobiological Sciences Online website, accessed December 17, 2014, at http://www.photobiology.info/Hader.html.
Levittown Beyond, 2012, The unofficial reference for Levitt and Sons communities after 1957: Levittown Beyond web page, accessed June 18, 2019, at http://www.levittownbeyond.com/LevittownPR.html.
National Oceanic and Atmospheric Administration, [NOAA], 2011, Data tools—1981–2010 normals: National Oceanic and Atmospheric Administration database, accessed November 7, 2022, at https://www.ncdc.noaa.gov/cdo-web/datatools/normals.
National Oceanic and Atmospheric Administration, [NOAA], 2013, Tides and currents: National Oceanic and Atmospheric Administration, Center for Operational Oceanographic Products and Services web page, accessed May 1, 2013, at https://tidesandcurrents.noaa.gov/.
National Weather Service, 2021, Rainfall and temperature maps for Puerto Rico and U.S. Virgin Islands—Mean annual rainfall 1991–2020: National Weather Service web page accessed September 15, 2022, at https://www.weather.gov/images/sju/climo/monthlymaps/2020-Annual-Normal-Rainfall.png.
Puerto Rico Agricultural Water Management [PRAGWATER], 2020, Solar radiation data for the northern Caribbean region: Puerto Rico Agricultural Water Management [PRAGWATER] web page, accessed March 30, 2020, at https://pragwater.com/solar-radiation-data-for-pr-dr-and-haiti/.
Puerto Rico Environmental Quality Board, 2014, Reglamento de Estándares de Calidad de Agua de Puerto Rico [Puerto Rico Water Quality Standards Regulations]: Junta de Calidad Ambiental de Puerto Rico [Puerto Rico Environmental Quality Board] website, accessed October 26, 2022, at http://www.jca.pr.gov/.
Soler-López, L.R., 2022, Data for the hydrologic and water-quality characteristics of Levittown Lake, Toa Baja, Puerto Rico, April 2010–June 2011: U.S. Geological Survey data release, https://doi.org/10.5066/P9MC6JZ6.
Sverdrup, H.U., Johnson, M.W., and Fleming, R.H., 1942, The oceans—Their physics, chemistry, and general biology: Prentice Hall, 939 p., accessed March 27, 2020, at https://publishing.cdlib.org/ucpressebooks/view?docId=kt167nb66r&chunk.id=d3_4_ch19&toc.depth=1&toc.id=ch19&brand=eschol.
Thompson, R.F., 2014, Nearshore bathymetric mapping of a 7-mile reach of Lake Sharpe shoreline near Lower Brule, South Dakota, 2013: U.S. Geological Survey Scientific Investigations Map 3307, 2 sheets, accessed September 28, 2016, at https://doi.org/10.3133/sim3307.
U.S. Geological Survey, 2021, USGS water data for the Nation: U.S. Geological Survey National Water Information System database, accessed March 29, 2021, at https://doi.org/10.5066/F7P55KJN.
Conversion Factors
International System of Units to U.S. customary units
Temperature in degrees Celsius (°C) may be converted to degrees Fahrenheit (°F) as follows:
°F = (1.8 × °C) + 32.
Datums
Vertical coordinate information is referenced to local mean sea level.
Horizontal coordinate information is referenced to the North American Datum of 1983 and to the Puerto Rico Datum, 1940 Adjustment.
Elevation, as used in this report, refers to distance above the vertical datum.
Supplemental Information
Specific conductance is given in microsiemens per centimeter at 25 degrees Celsius (µS/cm at 25 °C).
Concentrations of chemical constituents in water are given either in milligrams per liter (mg/L) or micrograms per liter (µg/L).
Abbreviations
DO
dissolved oxygen
GIS
geographic information system
mL
milliliter
NOAA
National Oceanic and Atmospheric Administration
NWIS
National Water Information System
NWQL
National Water Quality Laboratory
PREQB
Puerto Rico Environmental Quality Board
TN/TP
total nitrogen to total phosphorus ratio
USGS
U.S. Geological Survey
For more information about this publication, contact
Director, Caribbean-Florida Water Science Center
U.S. Geological Survey
4446 Pet Lane, Suite 108
Lutz, FL 33559
For additional information, visit
Suggested Citation
Soler-López, L.R., Gómez-Fragoso, J.M., and Val-Merníz, N.A., 2022, Hydrology, water quality, and biological characteristics of Levittown Lake, Toa Baja, Puerto Rico, April 2010–June 2011: U.S. Geological Survey Scientific Investigations Report 2022–5096, 32 p., https://doi.org/10.3133/sir20225096.
ISSN: 2328-0328 (online)
Study Area
| Publication type | Report |
|---|---|
| Publication Subtype | USGS Numbered Series |
| Title | Hydrology, water quality, and biological characteristics of Levittown Lake, Toa Baja, Puerto Rico, April 2010–June 2011 |
| Series title | Scientific Investigations Report |
| Series number | 2022-5096 |
| DOI | 10.3133/sir20225096 |
| Year Published | 2022 |
| Language | English |
| Publisher | U.S. Geological Survey |
| Publisher location | Reston, VA |
| Contributing office(s) | Caribbean-Florida Water Science Center |
| Description | Report: vii, 32 p.; Data Release; Dataset |
| Country | United States |
| State | Puerto Rico |
| Other Geospatial | Levittown Lake |
| Online Only (Y/N) | Y |
| Google Analytic Metrics | Metrics page |