

Characterization of Streamflow and Nutrient Occurrence in the Upper White River Basin, Colorado, 1980–2020
Links
- Document: Report (7.55 MB pdf) , HTML , XML
- Related Works:
- USGS Fact Sheet 2023-3005— Potential Factors Controlling Benthic Algae in the Upper White River Basin, Colorado, 2018–21
- USGS Scientific Investigations Report 2023-5009— Investigation of Potential Factors Controlling Benthic Algae in the Upper White River Basin, Colorado, 2018–21
- Data Releases:
- USGS data release — Channel Characteristics, benthic algae, and water quality model data for selected sites in the upper White River Basin, Colorado, 2018-21
- USGS data release — USGS water data for the Nation: U.S. Geological Survey National Water Information System database
- Download citation as: RIS | Dublin Core
Acknowledgments
The report was improved by review comments from U.S. Geological Survey staff Rodney Richards and William Battaglin. Any use of trade, firm, or product names is for descriptive purposes only and does not imply endorsement by the U.S. Government.
Abstract
In 2016, Colorado Parks and Wildlife identified filamentous algae collected from the main stem White River as Cladophora glomerata, a pervasive nuisance aquatic alga. Excessive levels of filamentous algae can compromise aesthetic quality, limit recreational activities, and have negative effects on aquatic life including strong fluctuations in dissolved oxygen levels and a reduction in overall biodiversity. To increase understanding of the biology of the upper White River Basin in Colorado, identify potential factors promoting or limiting nuisance algal abundance, and outline information to aid in the understanding and protection of water resources, the U.S. Geological Survey (USGS), in cooperation with the White River and Douglas Creek Conservation Districts and the White River Algae Technical Advisory Group, initiated a study to collect and analyze physical, chemical, and biological information for the upper White River Basin. The report describes long-term changes and spatial variations in streamflow and nutrient concentrations and loads in the upper White River Basin and identifies possible nutrient sources in the basin.
Long-term streamflow and nutrient data indicate that conditions in the upper White River Basin have become more favorable to benthic algae over varying timescales. Upward trends in total phosphorus concentrations and loads were found at three sites across the basin from 2000 to 2020. Total phosphorus loads increased around 50 percent, ranging from 18 to 48 pounds per year. Annual estimated concentrations of total phosphorus from 2005 to 2020 were above algal-specific nutrient criteria at the North Fork White River at Buford, Colo., indicating that phosphorus concentrations at this site likely promote algal growth. Discrete concentrations of total phosphorus exceeded algal-specific nutrient criteria on the South Fork and main stem White River during the summer season, though less frequently than samples collected from the North Fork White River. Nitrogen to phosphorus molar ratios collected from July to September indicate movement from colimitation (10–22) to nitrogen limited (less than 13) conditions at the North Fork White River at Buford, Colo. and the South Fork White River at Buford, Colo. starting in 2012. The magnitude of trends in phosphorus loads were generally greater than trends in concentrations across all sites, indicating that the largest changes in concentrations occurred during greater streamflow periods.
At White River above Coal Creek, near Meeker, Colo., significant downward trends in streamflow were found in August and September for mean streamflow (15 and 14 percent per decade, respectively) and 7-day minimum streamflows (23 and 22 percent per decade, respectively). Significant downward trends in annual 7-day minimum streamflows of 24 percent per decade, or 66 percent over the 40-year period of analysis, were also observed. Though not significant based on 90-percent confidence intervals, downward trends in 1-day maximum and mean streamflows in May and June and corresponding increases in April may indicate a shift toward earlier snowmelt runoff, as observed across western North America and the Colorado River Basin. Alteration of the annual hydrograph can influence factors that influence algae including nutrient input and dilution potential, water temperature, dissolved oxygen, light availability, and physical disturbance.
Results from a synoptic-style sampling identified the lower North Fork White River subbasin as a large source of phosphorus to the downstream system. Large increases in phosphorus loads were observed below Marvine Creek. Synoptic samples and samples collected during spring and summer of 2019 and 2020 also show large increases in total nitrogen, orthophosphate, and total phosphorus occurring at the furthest three downstream sites on the White River. To further evaluate sources of nitrogen in the upper White River Basin, the dual isotopic composition of nitrate was compared across four sites. The isotopic compositions of nitrate were all within the expected range of typical soil-derived nitrate, though the same values can also be derived from a mixture of agricultural fertilizer and manure or septic sources.
Introduction
Nuisance levels of benthic filamentous algae are becoming increasingly common in surface waters of Colorado and the western United States (Oleksy and others, 2021). Increases in nutrients, changes in nutrient limitation, and warming air and water temperatures have been implicated in the proliferation of these organisms over the last several decades (Dodds and Welch, 2000; Suplee and others, 2012; Oleksy and others, 2021). In 2016, Colorado Parks and Wildlife (CPW) identified filamentous algae collected from the main stem White River as Cladophora glomerata, a pervasive nuisance aquatic alga (CPW, 2017). Excessive levels of filamentous algae can compromise aesthetic quality, limit recreational activities, and can have negative effects on aquatic life, including strong fluctuations in dissolved oxygen levels and a reduction in overall biodiversity (Dodds and Gudder, 1992; Vadeboncoeur and others, 2021). In response to concerns from residents and land managers about the increased frequency and severity of benthic algae in the White River, multiple independent investigations were conducted in the White River Basin to examine causes of the blooms. Based on exploration of existing water-quality data collected at four U.S. Geological Survey (USGS) National Water Information System (NWIS) sites, in addition to new data collected by CPW, these investigations identified nutrients as a factor likely contributing to the benthic algal blooms (CPW, 2017; HydroSolutions, 2017; Skibo, 2018).
Nutrients, such as nitrogen and phosphorus, naturally occur in water as a result of weathering of rock and soil, breakdown of organic material, and through atmospheric deposition; or can result from human-related activities including runoff from agricultural and urban areas, wastewater treatment and septic tank effluent, and changes in land use and hydrology (Hem, 1985; Murphy and Sprague, 2019; Stets and others, 2020). Elevated nutrient concentrations in surface water can cause excessive growth of algae and other nuisance aquatic plants (Lopez and others, 2008). As such, nutrient concentrations are often compared to National, State, or region-specific nutrient standards and criteria recommended to limit algal growth. The State of Colorado established interim water-quality standards for nitrogen and phosphorus to protect the beneficial uses of surface water, which include support of aquatic life and use for domestic water supply, agriculture, and recreation (CDPHE, 2017). However, these water-quality standards are not specific to limiting benthic algal growth. In addition to comparing nutrient concentrations to individual nutrient standards, the relative availability of nitrogen to phosphorus can be used to assess nutrient limitation. During algal growth, about 16 atoms of nitrogen are used for every atom of phosphorus (16:1), which is the Redfield ratio (Redfield, 1958). CPW (2017) identified that the White River is nitrogen limited, meaning the relative abundance of nitrogen species to phosphorus species is low (below 16:1), and that any further addition of nitrogen could stimulate additional growth. A report from HydroSolutions (HydroSolutions, 2017) supported this finding, while also finding that concentrations still exceed levels thought to limit algal growth even though nutrient concentrations are below interim nutrient standards for Colorado (CDPHE, 2017). A better understanding of the sources of and controls on nutrients, including factors that can and cannot be controlled locally, is a priority for State and local stakeholders.
In 2018, the USGS, in cooperation with the White River and Douglas Creek Conservation Districts, initiated a study to collect and analyze physical, chemical, and biological information for the upper White River Basin. The upper White River Basin, as defined in this report, is the area of land drained by the White River from its headwaters in the Flat Tops, a mountain range in Garfield County, to near Meeker, Colorado (fig. 1). Table 1 provides information on the NWIS water-quality sites. This study aims to increase understanding of the biology of the upper White River Basin, identify potential factors promoting or limiting nuisance algal abundance, and outline information needs to aid in the understanding and protection of water resources.
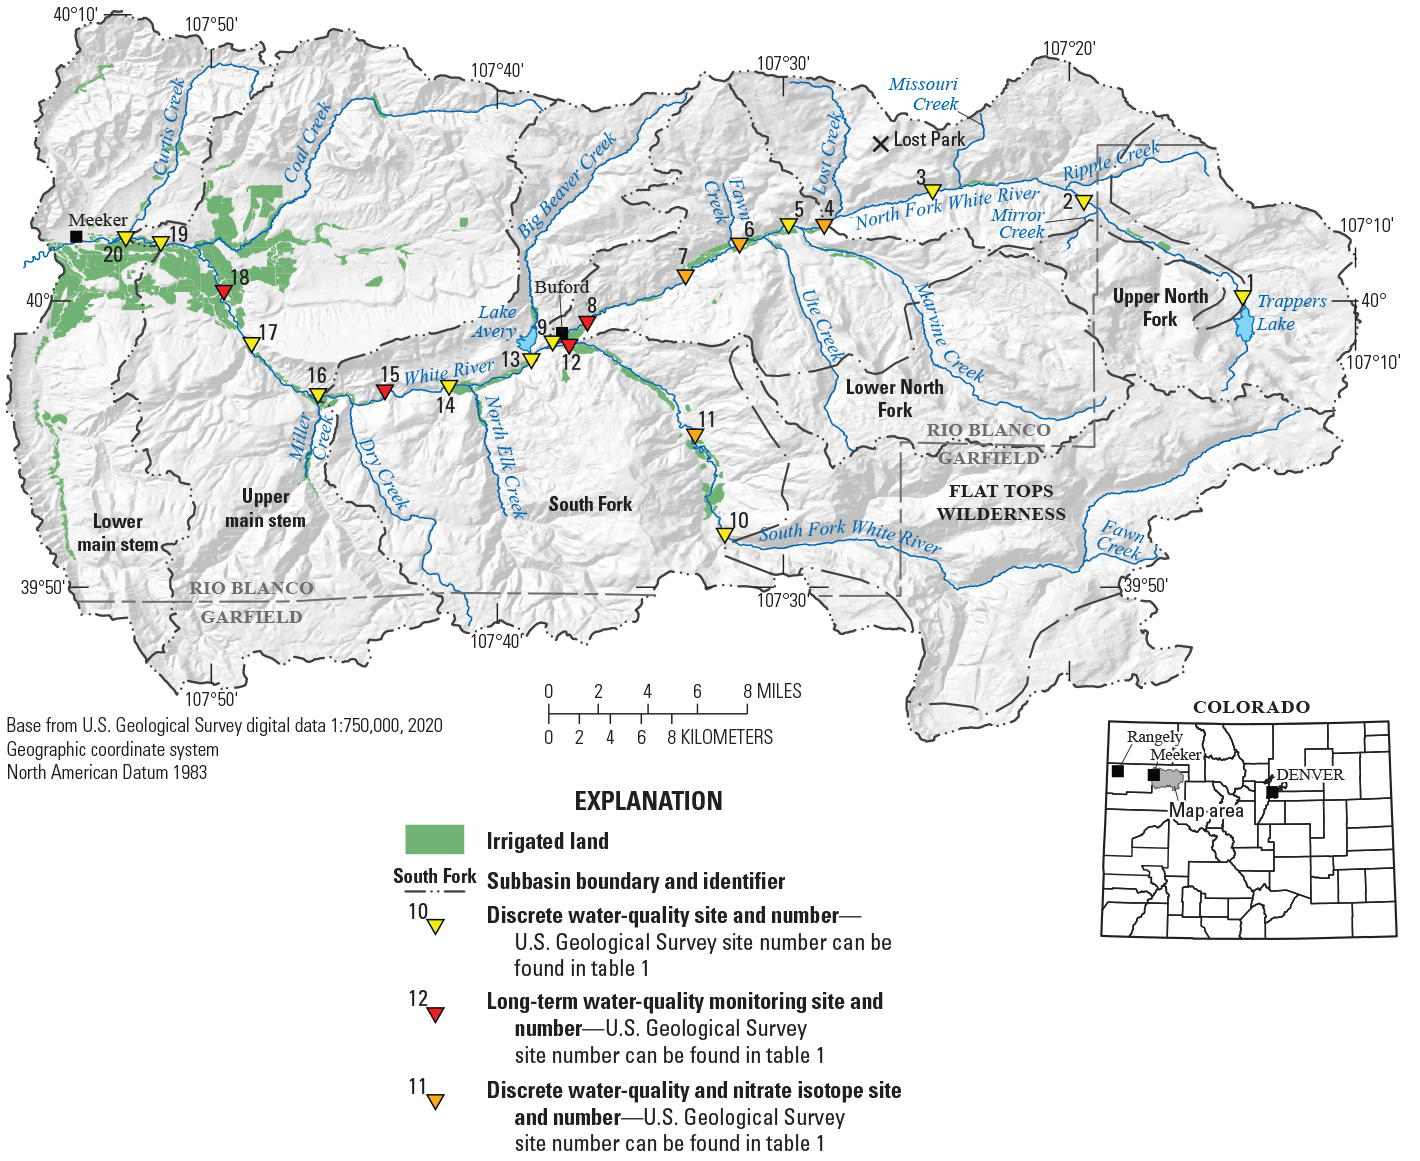
Location of the upper White River Basin, Colorado, with selected U.S. Geological Survey (USGS) water-quality sites. Irrigated lands layer modified from Colorado Decision Support Systems (2020).
Table 1.
Summary of U.S. Geological Survey (USGS) water-quality sites in the upper White River Basin, Colorado.[Site numbers and subbasins are shown on figure 1. USGS information from the USGS National Water Information System database (USGS, 2021). no., number; USGS, U.S. Geological Survey; NWIS, National Water Information System; ft above NAVD88, feet above North American Vertical Datum of 1988; CO, Colorado; CR, County Road]
Purpose and Scope
The purpose of this report is to present and to describe seasonal and spatial patterns and long-term changes in streamflow and nutrient (inorganic nitrogen, total nitrogen, total phosphorus, and orthophosphate) occurrence in the upper White River Basin, Colorado, and to provide insight into how these conditions may contribute to nuisance algal occurrence in the basin. This report (1) describes long-term changes in streamflow and nutrient concentrations and loads at sites in the water-quality monitoring program; (2) describes spatial variation in nutrient abundance from 20 sites across the basin; (3) identifies possible nutrient sources at a subset of sites through isotope sampling; (4) identifies subbasins with higher nutrient loads and yields through synoptic sampling; and (5) discusses how nutrient conditions, including concentrations and ratios of concentrations, compare to standard values related to algal growth.
Description of the Study Area
The upper White River Basin drains approximately 1,020 square miles of the White River Basin in northwestern Colorado (fig. 1). The boundaries of the basin extend from the Flat Tops in the eastern and southeastern parts of the basin to Lost Park and the town of Meeker, Colo., in the northern and western parts of the basin. Elevations (feet [ft] above North American Vertical Datum of 1988) in the basin range from 12,000 ft in the Flat Tops to 5,900 ft along the White River west of Meeker. The majority of the upper White River Basin is within Rio Blanco County with a smaller part located in Garfield County along the southern and eastern boundary.
The North and South Forks of the White River both begin in the Flat Tops and flow generally west meeting near Buford, Colo. Major tributaries entering the North Fork White River include Mirror Creek, Ripple Creek, Missouri Creek, Lost Creek, Marvine Creek, Ute Creek, and Fawn Creek, all located upstream from Buford, Colo.; along the South Fork White River the only major tributary is Fawn Creek. Downstream from the North and South Forks are Big Beaver Creek, North Elk Creek, Dry Creek, Miller Creek, Coal Creek, and Curtis Creek, all upstream from Meeker, Colo. (fig. 1).
Temperature and precipitation characteristics in the upper White River Basin are typical of those found in other mountainous and semiarid regions of Colorado. Mean temperatures from 1995 to 2020 in the town of Meeker range from a minimum temperature of 6.5 degrees Fahrenheit (°F), during January, to a maximum temperature of 86.4 °F during July (High Plains Regional Climate Center, 2020). On average, annual precipitation totals are nearly 18 inches per year (in/yr) in Meeker, Colo. Much of the annual precipitation occurs as snow during winter months with a total of 70 inches per year of cumulative snowfall reported in Meeker (High Plains Regional Climate Center, 2020).
Spring snowmelt, typically from April through June, contributes most of the streamflow annually. Late-summer, fall, and winter streamflow is dominated by base flow from groundwater discharge (fig. 2). Although there is some municipal and industrial use of surface water, the principal water use is agricultural. Irrigated acreage in the White River Basin is approximately 26,000 acres, predominately pasture grass and alfalfa. The greatest concentration of irrigated lands in the upper White River Basin is south and east of Meeker, Colo. (fig. 1; Colorado Water Conservation Board, 2016). The towns of Meeker and Rangley, Colo., draw municipal water supplies from alluvial wells along the White River. Approximately 1,000 acre-feet of groundwater are pumped annually from alluvial aquifers near these towns, primarily for municipal, domestic, and irrigation purposes (Colorado Water Conservation Board, 2016).
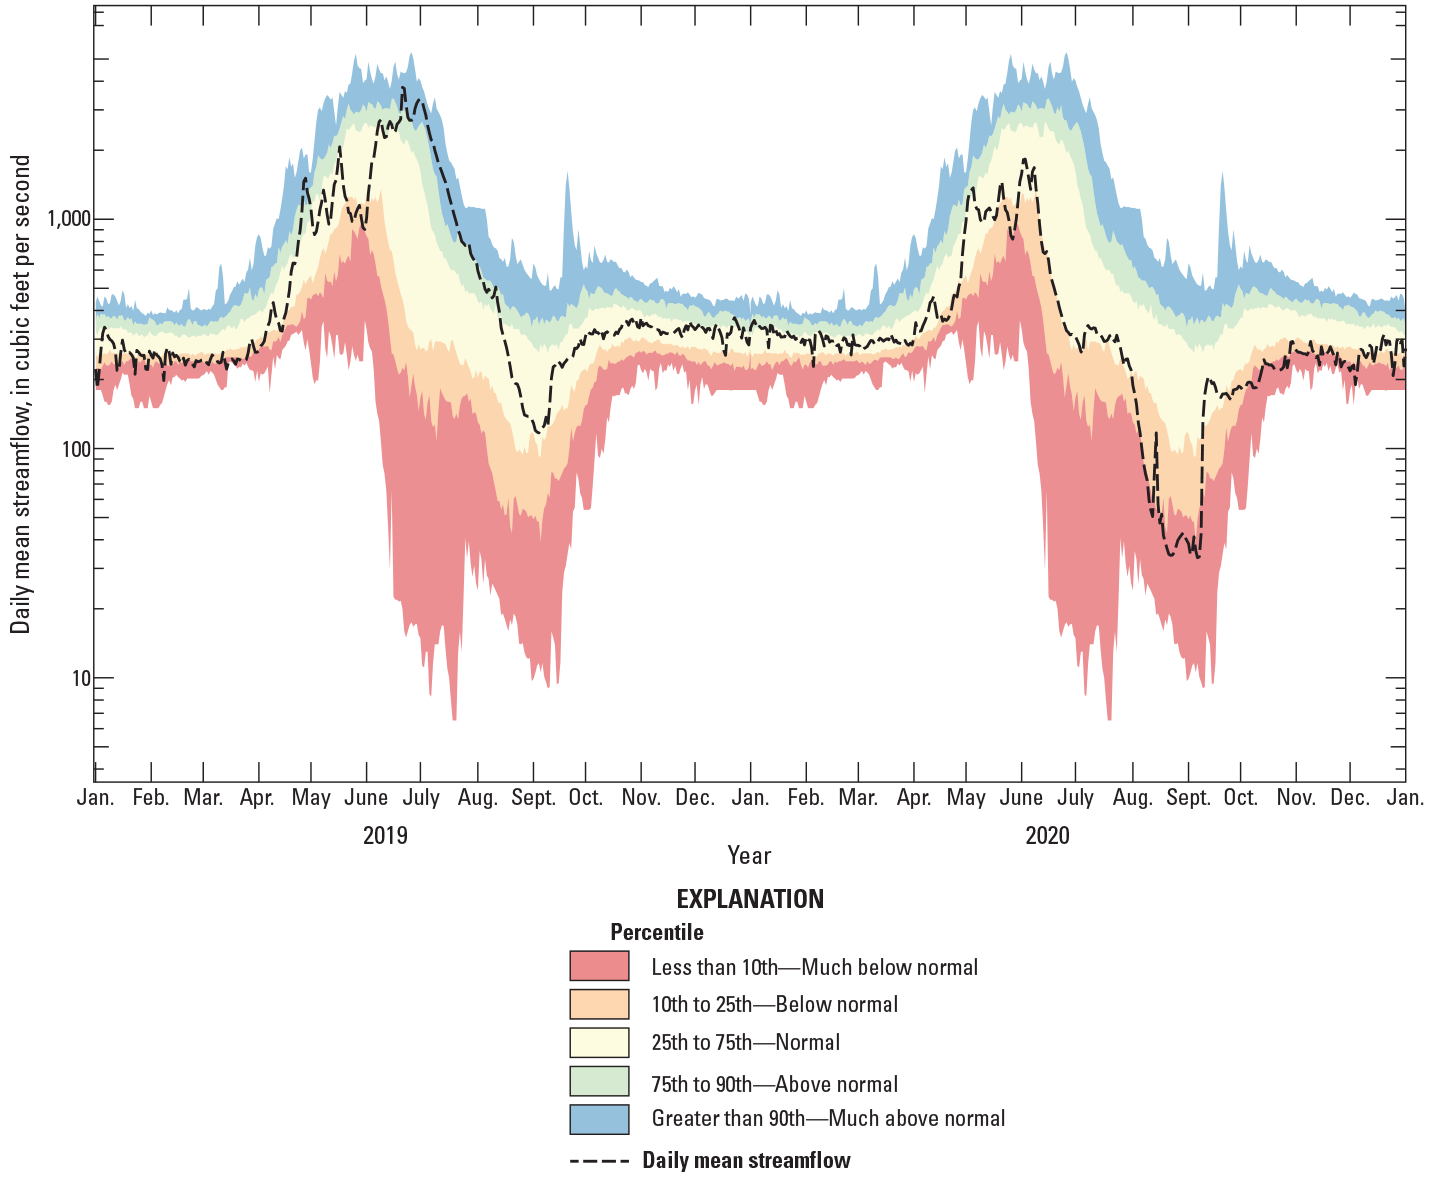
Daily mean streamflow from 2019 to 2020 and streamflow statistics for each day of the year from 1961 to 2020 at White River above Coal Creek near Meeker, Colorado (U.S. Geological Survey, 2021).
Lake Avery (also known as Big Beaver Reservoir) is the largest reservoir in the upper White River Basin and is located about 20 miles east of Meeker, Colo. (fig. 1). It is owned and operated by the Colorado Division of Wildlife, has a storage volume of 7,658 acre-feet, and is used primarily for recreational and fishery purposes. This reservoir is not used to supplement water supplies in the region but can be used to maintain minimum instream flows (Colorado Water Conservation Board, 2016). Trappers Lake is located at 9,500 ft elevation at the headwaters of the North Fork White River in the Flat Tops Wilderness Area (fig. 1). Trappers Lake is the second-largest natural lake in Colorado after Grand Lake and is a fishery of brook trout and native cutthroat trout. The Big Fish wildfire burned around 17,000 acres of forest around the lake in the summer of 2002 (Urquhart, 2012).
Surface geology in the White River Basin is mostly composed of sedimentary rocks (fig. 3; Tobin, 1993). The middle and eastern parts of the study area are predominately Permian and Pennsylvanian sedimentary rocks, including sandstones, shales, and limestones with erosion-resistant basalt layers. Cretaceous sandstones and shales are common in the western third of the basin and are less resistant to erosion (Tobin, 1993).
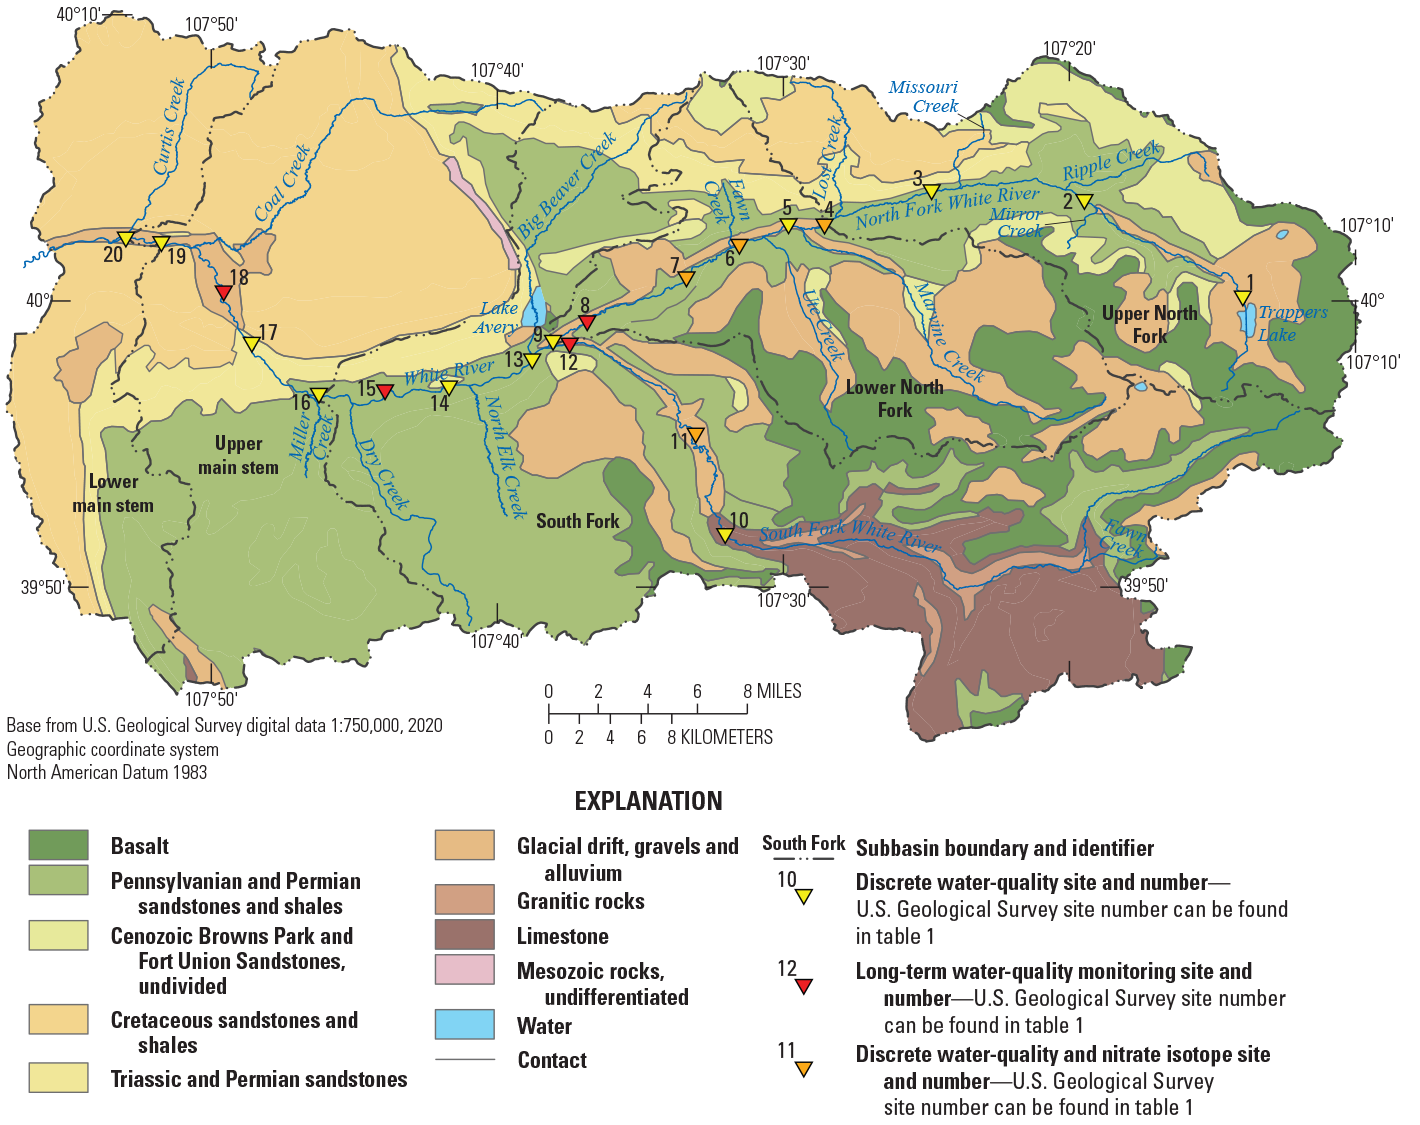
Surface geology in the upper White River Basin, Colorado, with selected U.S. Geological Survey water-quality sites (U.S. Geological Survey, 2021) and subbasin boundaries. Modified from Tweto (1979).
Potential Sources of Nutrients
Nutrient inputs to the land surface from natural and anthropogenic sources can be taken up by crops and native vegetation and stored within the terrestrial system. Any excess nutrients are potentially available for export to aquatic habitats, where they may contribute to local water-quality problems and fuel the growth of nuisance algae. Nutrients can occur naturally because of weathering and erosion of rocks and soils and breakdown of organic material (Hem, 1985; USGS, 2000), but also from anthropogenic activities, including point and nonpoint sources. Examples of point-source inputs include discharge from industrial sources and effluent from municipal wastewater treatment plants. Nonpoint-source inputs are primarily caused by rainfall or snowmelt moving over and through the ground that flush natural and human-made nutrient sources into basins, including excess fertilizers and herbicides from agricultural areas, bacteria and nutrients from livestock and septic systems, oil and chemicals from urban areas, and sediment from crop and forest lands and eroding streambanks. Hydrologic and geologic differences among basins can also interact with land use to alter nutrient discharges. For example, phosphorus export to a basin from nonpoint sources may be greater during years with greater snowmelt runoff due to increased overland flow and erosion potential (Grobler and Silberbauer, 1985). Similarly, agricultural land use may make basins more sensitive to runoff and erosion through the removal of vegetation and exposure of the soil (Knox, 2001), which suggests that underlying geology may have greater influence on nutrient export in basins with large amounts of agriculture. Changes in forested ecosystems, such as those caused by acidification from atmospheric deposition, wildfires, and insect infestation, can also affect nutrient inputs to receiving waterbodies (Monteith and others, 2007; Smith and others, 2011; Mikkelson and others, 2013).
The nutrient forms entering streams and rivers mainly depend on their origin (Jordan and others, 1997). Nitrogen and phosphorus can occur in several chemical species or forms, including organic and inorganic forms. Organic forms of nitrogen and phosphorus are derived from living and detrital organic material and are generally unavailable to living organisms until they are converted to an inorganic form. Inorganic forms of nitrogen include nitrite, nitrate, and ammonia, and the inorganic form of phosphorus is orthophosphate. Nitrite typically is present in low concentrations in streams because it is unstable in oxygenated water, and high levels of nitrite generally indicate contamination from sewage or organic waste (Hem, 1985). Nitrate is more stable than nitrite in the presence of oxygen and is generally present in low concentrations in streams and lakes because it is readily consumed by aquatic plants. Ammonia occurs in water as ammonium (NH4+), the form used by living organisms, or as un-ionized ammonia (NH3), the form that can be toxic to fish in excessive concentrations (Mueller and others, 1995).
Potential sources of nutrients in the upper White River Basin include, but are not limited to, atmospheric deposition, septic systems, fertilizer, wildfire, fish feeding, golf courses, geologic sources, livestock grazing, stream channel configuration activities, pesticides, and agricultural ponds. This study does not explicitly quantify the relative contribution of each of these sources, though the findings can be used to better inform stakeholders which sources are likely to contribute to the occurrence of nutrients in the upper White River Basin and which sources may warrant further investigation.
Methods
This section provides details on the methods for assessment of streamflow and water-quality trends. Methods also are described for streamflow measurements and water-quality sample collection, laboratory analyses, and quality assurance and quality control. Abbreviated forms of USGS site names are used throughout the report and displayed in table 1. In addition to displaying data at individual sites, streamflow and nutrient data are also summarized for five subbasins, where delineation was designed to generalize conditions in the basin while accounting for the influence of major hydrologic features (fig. 1).
Data for water-quality constituents are reported as filtered (through a 0.45-micron filter, dissolved) or unfiltered. Total data, which represent all chemical species of a particular element, are also reported. Total nitrogen represents all inorganic and organic species of nitrogen present in a stream and is a calculated value that comprises separate measures of inorganic and organic chemical species. At the sites considered in this study, total nitrogen was calculated as the sum of unfiltered nitrite plus nitrate and unfiltered Kjeldahl nitrogen (organic nitrogen plus ammonia). Sample concentrations are reported as censored when the concentration is less than the long-term method detection level concentration (Foreman and others, 2021). Constituents presented in this report include filtered nitrate plus nitrite (USGS parameter code 00631); herein referred to as inorganic nitrogen; unfiltered total nitrogen (USGS parameter code 00600); filtered orthophosphate (USGS parameter code 00671); total phosphorus (USGS parameter code 00665); oxygen (δ18O; USGS parameter code 63041) and nitrogen (δ15N; USGS parameter code 82690) isotope ratios of detected nitrate; and streamflow. All water-quality and streamflow data for this study are available in the NWIS database (USGS, 2021) and can be retrieved using the USGS site numbers found in table 1.
Streamflow and Nutrient Trends
Streamflow data and data for inorganic nitrogen, total nitrogen, and total phosphorus were retrieved in an electronic format from the USGS NWIS database (USGS, 2021) from long-term water-quality monitoring sites (fig. 1; table 1) to characterize long-term changes (trends) in streamflow from 1980 to 2020 and concentrations and loads from 2000 to 2020. Water-quality data from the long-term water-quality monitoring sites were collected quarterly. Seasonality of discrete concentrations was explored at all four sites, long-term trends in streamflow were assessed at one site, and long-term trends in concentrations and loads were assessed at three sites. Estimated time series of streamflow were created for two sites with incomplete streamflow records. The period of analysis was longer for streamflow trends, as changes in streamflow can have lagged effects on water quality that may be particularly important for non-point source contamination (Murphy and Sprague, 2019). All data analysis was performed in R (R Core Team, 2021). Qualified USGS personnel review and approve all USGS discrete water-quality and continuous streamflow data on a regular interval. Data used in this report have been approved for publication. Modeled data used to assess streamflow and water-quality trends are available in a USGS data release (Day and others, 2023).
Streamflow Trends
To explore trends in streamflow in the upper White River Basin, temporal changes in daily streamflow statistics for White River above Coal Creek (site no. 18, fig. 1; table 1) were explored on an annual and monthly basis. The time period of analysis for assessing trends in streamflow extended from water years (WYs) 1980 to 2020. A WY is defined as a 12-month period beginning October 1 and ending September 30 of the following year, with the year corresponding to the year in which it ends. Streamflow statistics included 1-day maximum, mean, and 7-day minimum, and were assessed using the R package Estimation of Graphics for RivEr Trends (EGRET; Hirsch and De Cicco, 2015). Trend slopes were calculated using the Thiel-Sen slope estimator and expressed as percentage change per decade (Hirsch and De Cicco, 2015). The statistical strength of the trends was assessed using the Mann-Kendall trend test, and 90-percent confidence intervals were used to determine significance.
Streamflow Record Extension
The assessment of nutrient trends needed continuous streamflow records. White River above Coal Creek is the only site in the upper White River Basin study area with a continuous streamflow record for the period of interest (WYs 1980–2020). Estimated time series of streamflow were created for the North Fork White River at Buford and the South Fork White River at Buford (site nos. 8, 12, fig. 1; table 1) which had incomplete streamflow records. Continuous streamflow records exist for these two sites from the early 1900s; however, the longest time span of data collection at the North Fork White River at Buford site occurred between WYs 1952–2001 and between 1952–97 at the South Fork White River at Buford site.
The Maintenance of Variance Extension Type 2 (MOVE.2) regression technique was used to estimate daily streamflow records at the North Fork White River at Buford by using the correlation between daily streamflow at the site and concurrent daily streamflow at White River above Coal Creek (Hirsch, 1979). An adjustment of 145 cubic feet per second (ft3/s) was made during April–October to account for irrigation withdrawals that occur between the sites based on State irrigation records (Colorado Water Conservation Board, 2016). The daily streamflow data between the North Fork White River at Buford and White River above Coal Creek were highly correlated (R2 greater than [>] 0.96), and the coefficients produced from a linear regression were used to predict missing daily streamflow at the North Fork White River at Buford. Missing daily streamflow at the South Fork White River at Buford site were generated using the ratio of published daily streamflow for the South Fork White River at Buford site relative to the streamflow for the White River above Coal Creek site during periods of time with overlapping streamflow records, 1962–97. Because of the large proportion of streamflow data estimated, the North Fork White River at Buford and the South Fork White River at Buford were not included in the streamflow trend analysis. These sites were used in regression equations to assess trends in concentrations and loads; however, interpretation of these results may warrant being assessed with a higher degree of caution because errors in the estimated hydrograph will be propagated into concentration and load calculations.
Nutrient Trends
The Weighted Regressions on Time, Discharge, and Season (WRTDS) method (Hirsch and De Cicco, 2015) was used to assess trends in inorganic nitrogen, total nitrogen, and total phosphorus concentrations and loads at three sites in the upper White River Basin from WY 2000 to 2020. Trends in orthophosphate concentrations and loads were not possible due to a high number of censored values along with multiple changes in laboratory methodology and detection reporting limits. Seasonal characterization of orthophosphate concentrations is discussed from 2009 to 2020. Assessment of trends using the WRTDS method requires a minimum of 60 water-quality observations that sufficiently represent seasonal variation in streamflow and concentration. The sample data, consisting of a concentration value coupled with a daily streamflow from the day of sample collection, for a given site and constituent, are used to fit weighted regression models using the following,
whereln
is the natural logarithm;
c
is the constituent concentration, in milligrams per liter;
b0
is the regression equation intercept;
bn
is the coefficient on the nth regression variable, where n is 1 through 4;
Q
is the daily streamflow term, in cubic feet per second;
t
is time, in decimal years;
sin
is the sine function;
π
is 3.14159;
cos
is the cosine function; and
e
is the error associated with the regression equation.
The WRTDS method estimates a unique set of coefficients for every combination of daily streamflow and time in the period of record. The coefficients are fit by weighted regression, which bases coefficients more heavily on observations collected under conditions that are similar to those on the day for which an estimate is sought. The degree of similarity, and thus weight on each observation, is based on their similarity in terms of streamflow, time, and season to the day being calibrated. The variable-parameter weighted-regression approach allows WRTDS to represent complex relations between concentration and streamflow at a site, as well as complex trends over time. Estimates of daily concentration and load are strongly influenced by random variations in streamflow; therefore, WRTDS also produces flow-normalized estimates of daily concentration and load for a site. The flow-normalized estimates remove variations in concentration or load resulting from random streamflow variations but not variations from nonrandom seasonal streamflow variations. See Hirsch and De Cicco (2015) for more details.
The WRTDS models are associated with a load bias statistic, a dimensionless representation of the difference between the sum of the estimated loads on all sampled days and the sum of the true loads on all sampled days (Hirsch and DeCicco, 2015). A load bias near zero indicates the model is nearly unbiased, whereas a positive or negative value indicates a positive or negative bias, respectively. Load bias values between −0.1 and +0.1 indicate that the bias in estimates of the long-term mean load is likely to be less than 10 percent.
Confidence intervals on trend analysis were obtained using the WRTDS Bootstrap Test, which is a block bootstrap approach that uses a set of Monte Carlo simulations to estimate Type I error probability, the probability of detecting a trend when a trend is not present (Hirsch and others, 2015). The WRTDS Bootstrap Test output includes (1) hypothesis tests for the presence of a trend flow-normalized concentration and flow-normalized load trend (reject or do not reject the null hypothesis at alpha = 0.1), (2) p-values for those tests, (3) 90-percent confidence intervals for the magnitude of the trend in flow-normalized concentration and flow-normalized load, and (4) likelihood statements (in numerical form and as descriptive statements) about trends in flow-normalized concentration and flow-normalized load. Likelihood designations are computed from the reported two-sided p-value and follow the pattern described in Hirsch and others (2015) where likelihood values greater than or equal to (≥) 0.95 and less than or equal to (≤) 1.0 are considered “highly likely,” ≥0.90 and <0.95 is “very likely,” ≥0.66 and <0.90 is “likely,” >0.33 and <0.66 is “about as likely as not,” >0.1 and ≤0.33 is “unlikely,” >0.05 and ≤0.1 is “very unlikely,” and ≥0 to ≤0.05 is “highly unlikely.”
Discrete Sample Collection and Analysis
Multiple sampling designs were utilized to characterize nutrient conditions in the upper White River Basin: early spring (April–May) and summer (July–September) sampling for 2019–20, nitrate isotope sampling on April 19, 2019, and a synoptic-style sampling on October 22, 2020. The goal of the early spring and summer sampling was to characterize nutrient concentrations at 20 sites when nutrient source inputs were expected to dominate and to characterize nutrient concentrations later in the water year when the greatest level of biological activity was expected. The isotope sampling results were compared with known isotopic source signatures to identify potential nutrient source types in the upper North Fork and the South Fork White River where transitioning land use and land cover were associated with potential increased algal abundance and nutrient sources (CPW, 2017). The goal of the synoptic sampling was to identify source areas and sinks of nutrients in the basin during steady-state conditions when biological uptake and diel fluctuations were minimized.
All water-quality samples were collected using procedures described by the “National Field Manual for the Collection of Water-Quality Data” (USGS, variously dated). Water-quality samples were collected as grab samples during spring sample periods (including isotope samples) and isokinetically using equal-width increment methods during the summer sample period and during the synoptic sampling. Water samples were filtered through a 0.45-micron filter and acid preserved on-site in a mobile water-quality laboratory, or nearby in a stationary sample processing location, and then stored and shipped in accordance with standard procedures (USGS, variously dated). Nutrients were analyzed at the USGS National Water Quality Laboratory in Lakewood, Colo., following standard techniques and methods described by Fishman (1993); Patton and Truitt (2000); Patton and Kryskall (2011). Samples for analysis of stable isotopes of oxygen and nitrogen in nitrate were frozen and shipped to the USGS Stable Isotope Laboratory in Reston, Virginia (Coplen and others, 2007). Field properties, including pH, water temperature, specific conductance, and dissolved oxygen, were measured with each discrete water-quality sample collected using techniques and methods in the “National Field Manual for the Collection of Water-Quality Data” (USGS, variously dated).
Quality Assurance and Quality Control
Quality assurance and quality control samples were collected equivalent to 10 percent of total samples collected and consisted of field blanks and split replicates (USGS, variously dated). Field blanks were used to evaluate the potential for sample contamination, where high concentrations would indicate contamination from sample collection, processing, and analysis. Nutrient concentrations were below their respective detection limits and indicated no substantial contamination during collection and processing of samples. Differences in replicate samples were used to indicate variability in analytical methodology or variability in field methods and equipment used prior to analysis. Numerous or large amounts of variation may identify a problem with field methods potentially adding bias or variability into the data prior to laboratory analysis. The relative percent difference was calculated to assess variability between the environmental and replicate samples. Mueller and others (2015) cautioned the high variability associated with relative percent differences greater than 20 percent could affect the interpretation of the environmental data. Only two replicate pairs exceeded a relative percent difference of 20 percent. At the South Fork White River at Buford, Kjeldahl nitrogen, used in the calculation of total nitrogen, had a relative percent difference of 20.4 percent. At the North Fork White River, above Fawn Creek near Buford site, total phosphorus had a relative percent difference of 27.7 percent. For both of these samples, the concern for the high relative percent differences affecting the interpretation of environmental data is minor because of the generally low concentrations. The absolute differences rather than relative percent differences were compared for replicates of isotope samples because the delta values represent ratios. Absolute differences between replicates ranged from 0 to 0.51 per mil for δ18O and 0.06 to 0.42 per mil for δ15N.
Comparison of Nutrient Concentrations to CDPHE Standards and Algae-Specific Criteria
Concentrations of total nitrogen and total phosphorus were compared to State of Colorado interim water-quality standards. The standards were established by the CDPHE to protect the beneficial uses of surface water, which include support of aquatic life, use for domestic water supply, agriculture, and recreation (CDPHE, 2017), shown in table 2. The standards were designed to apply to a broad suite of water uses and may be too high to limit benthic algal blooms (Dodds and others, 2002). The standards are based on annual median values rather than values experienced during algal growth periods.
Total nitrogen and total phosphorus concentrations were also compared to algal-specific nutrient criteria identified by Suplee and Watson (2013), shown in table 2. These nutrient criteria were established using regional stressor response studies and data from reference streams to create total nitrogen and total phosphorus criteria for different ecoregions. The criteria apply during the period when algal growth is active, July through September, and are recommended in order to maintain benthic algal growth at less than 125 milligrams chlorophyll a per square meter (mg/m2).
In addition to comparing concentrations to individual nutrient standards and criteria, consideration of instream nutrient limitation was also assessed in relation to potential algal growth. The molar ratio of total nitrogen to total phosphorus (N:P) indicates the relative availability of the two primary nutrients that algae require for growth. About 16 nitrogen atoms are used for every phosphorus atom, a ratio of 16:1 (Redfield, 1958). For benthic algae, moving above or below the balanced ratio, is necessary to be more certain that a waterbody is nitrogen or phosphorus limited (Dodds, 2003). Nitrogen limitation is indicated at N:P ratios <13, and phosphorus limitation is indicated when N:P ratios are >22 (Hillebrand and Sommer, 1999).
Table 2.
Colorado Department of Public Health and Environment (CDPHE) interim water-quality standards for total nitrogen and total phosphorus concentrations for surface water (CDPHE, 2017) and algal-specific nutrient criteria focused on limiting algal growth in surface waters identified in Suplee and Watson (2013).[CDPHE, Colorado Department of Public Health and Environment; mg/L, milligrams per liter]
| Constituent | CDPHE standards for cold rivers and streams | Criteria identified in Suplee and Watson (2013) |
|---|---|---|
| Total nitrogen | 1.25 mg/L1 | 0.30 mg/L2 |
| Total phosphorus | 0.11 mg/L1 | 0.03 mg/L2 |
Synoptic-Style Sampling Event
On October 22, 2020, a synoptic-style sampling event was completed at 20 sites (table 1; fig. 1) to quantify source areas and loading of nutrients in the upper White River Basin. Mid-October was chosen because streamflows were expected to be steady and have minimal fluctuations from irrigation activity, evapotranspiration, or freeze-thaw cycles. In order to perform the sampling across a stable period of streamflow, the synoptic sampling was conducted by a team of six people, working at 3–4 sites each. Samples were processed at two sample processing locations based on standard procedures (USGS, variously dated).
Loads and Yields
Two methods were used to determine streamflow during the synoptic sampling: (1) streamflow reported from streamgage records and (2) discrete current-meter measurements. Two sites had streamgage records, White River above Dry Creek and White River above Coal Creek. Streamflow measurements, during synoptic sampling, were made using a handheld SonTek Flow Tracker acoustic Doppler velocimeter with a wading rod according to methods in Turnipseed and Sauer (2010).
Loads of nutrients were compared across individual sites and across five subbasins (fig. 1; table 1) to identify the magnitude of nutrient loading from upstream to downstream. Loads were calculated as the concentration times the instantaneous streamflow; for censored concentrations, the reporting limit was used in calculations. The load of each subbasin was represented by the furthest downstream site in the subbasin. Streamflow and nutrient yields were compared across five subbasins to further assess the influence of natural processes, land-use activities, population, and water consumption on water quality. Streamflow yield was calculated by dividing the total streamflow of a subbasin by the total land area contributing to that subbasin and reported in cubic feet per second per square mile. Nutrient yields were calculated by dividing the nutrient load of a subbasin by the total land area contributing to that subbasin and reported as pounds per square mile.
Error Analysis
An error analysis incorporated the two variable components of load calculations: streamflow and laboratory-reported nutrient concentrations. The error from these variables were propagated into the loading computation to characterize error ranges. Error is assessed to streamflow values from streamgage records as a percentage rating based on hydrologic conditions during that period. All streamgage records had a data quality rating of “good” during the synoptic sampling and an accuracy rating of 5 percent was assigned. Error is assigned to current meter measurements based on a qualitative rating by the hydrographer specific to the measurement conditions. Streamflow-accuracy ratings are explained in Novak (1985). All streamflow measurements obtained from current meters were assigned a data quality rating of “fair” and assigned an accuracy rating of 8 percent.
Error associated with the concentration of water-quality constituents was determined using results from two replicate split samples, two field blanks, and laboratory precision records. Laboratory analysis error was estimated by calculating the mean percent difference between the environmental sample and replicates. Nutrient concentrations in field blanks were below their respective detection limits and indicated no substantial contamination during collection and processing of samples. Laboratory precision was determined using the mean percent recovery of samples during internal quality assurance testing (USGS, 2020). The total error associated with the water-quality constituent load estimations were calculated combining streamflow error and concentration error using error propagation as outlined in Taylor (1982) and Williams and Leib (2005). The percentage error associated with load estimates is depicted by error bars in the figures.
Streamflow and Nutrient Occurrences in the Upper White River Basin
This section presents results for streamflow and nutrient data from multiple datasets, including data collected from 1980 to 2020 from 4 sites in the long-term water-quality monitoring program and data from 2019 to 2020 from 20 sites across the upper White River Basin (fig. 1; table 1). Data collected from 2019 to 2020 include discrete sampling in early spring (April–May) and summer (July–September), nitrate isotope sampling (2019), and a synoptic sampling (2020).
Characterization of Long-Term Streamflow and Nutrient Data
The upper White River Basin has four sites that are part of a USGS long-term water-quality monitoring network. Trends in streamflow were evaluated at White River above Coal Creek (site no. 18, fig. 1; table 1), the only site with a long-term continuous record of streamflow in the upper White River Basin, from WY 1980 to 2020. Monthly patterns in discrete concentrations and molar ratios of total nitrogen to total phosphorus are displayed at White River above Coal Creek, White River above Dry Creek, North Fork White River at Buford, and South Fork White River at Buford (site nos. 18, 15, 8, and 12 respectively, fig. 1; table 1) for various time periods. Trends in nutrient concentrations and loads were evaluated for White River above Coal Creek, North Fork White River at Buford, and South Fork White River at Buford (site nos. 18, 8, 12, fig. 1; table 1) from WY 2000 to 2020 using WRTDS. Discrete and estimated concentrations were compared to CDPHE standards and algal-specific criteria.
Streamflow Trends
Climate and human-related factors are the principal mediators of hydrologic systems. As factors like precipitation, air temperature, land use, and water management can change over time, it is useful to assess corresponding trends of hydrologic variables. Streamflow extremes, such as low and high flows, mediate water-quality conditions of great ecological importance, including water temperature, dissolved oxygen, and the potential for effluent dilution (Rolls and others, 2012). Identifying and quantifying long-term trends in streamflow in the upper White River Basin can provide insight into how changes in hydrology may influence recent changes in aquatic community composition, including the proliferation of benthic algae.
The time period of trend analysis, WY 1980–2020, in part coincides with one of the hottest drought periods on record in the Colorado River Basin (2000–14) where mean annual streamflow was 19 percent below that of the 20th century mean (Udall and Overpeck, 2017). Declines of streamflow are expected to continue in the future (Wheeler and others, 2021). At White River above Coal Creek, significant downward trends in streamflow, based on 90-percent confidence intervals, were found in August and September for mean streamflow (15 and 14 percent per decade, respectively) and 7-day minimum streamflows (23 and 22 percent per decade, respectively; fig. 4). Significant downward trends in annual 7-day minimum streamflows of 24 percent per decade (fig. 4), or 66 percent over the 40-year period of analysis, were also observed.
Though not significant based on 90-percent confidence intervals, downward trends in 1-day maximum and mean streamflows in May and June and corresponding increases in April (fig. 4) may indicate a shift toward earlier snowmelt runoff, as observed across western North America and the Colorado River Basin (Udall and Bates, 2007). Increasing air temperatures, changes in precipitation, and the resulting shifts in snowmelt runoff in the upper Colorado River Basin have been linked to decreases in snowmelt runoff, which accounts for a large proportion of the annual water budget (Miller and Piechota, 2008; Clow, 2010). In addition to climate-related changes, trends may be influenced by changes in water use in the basin.
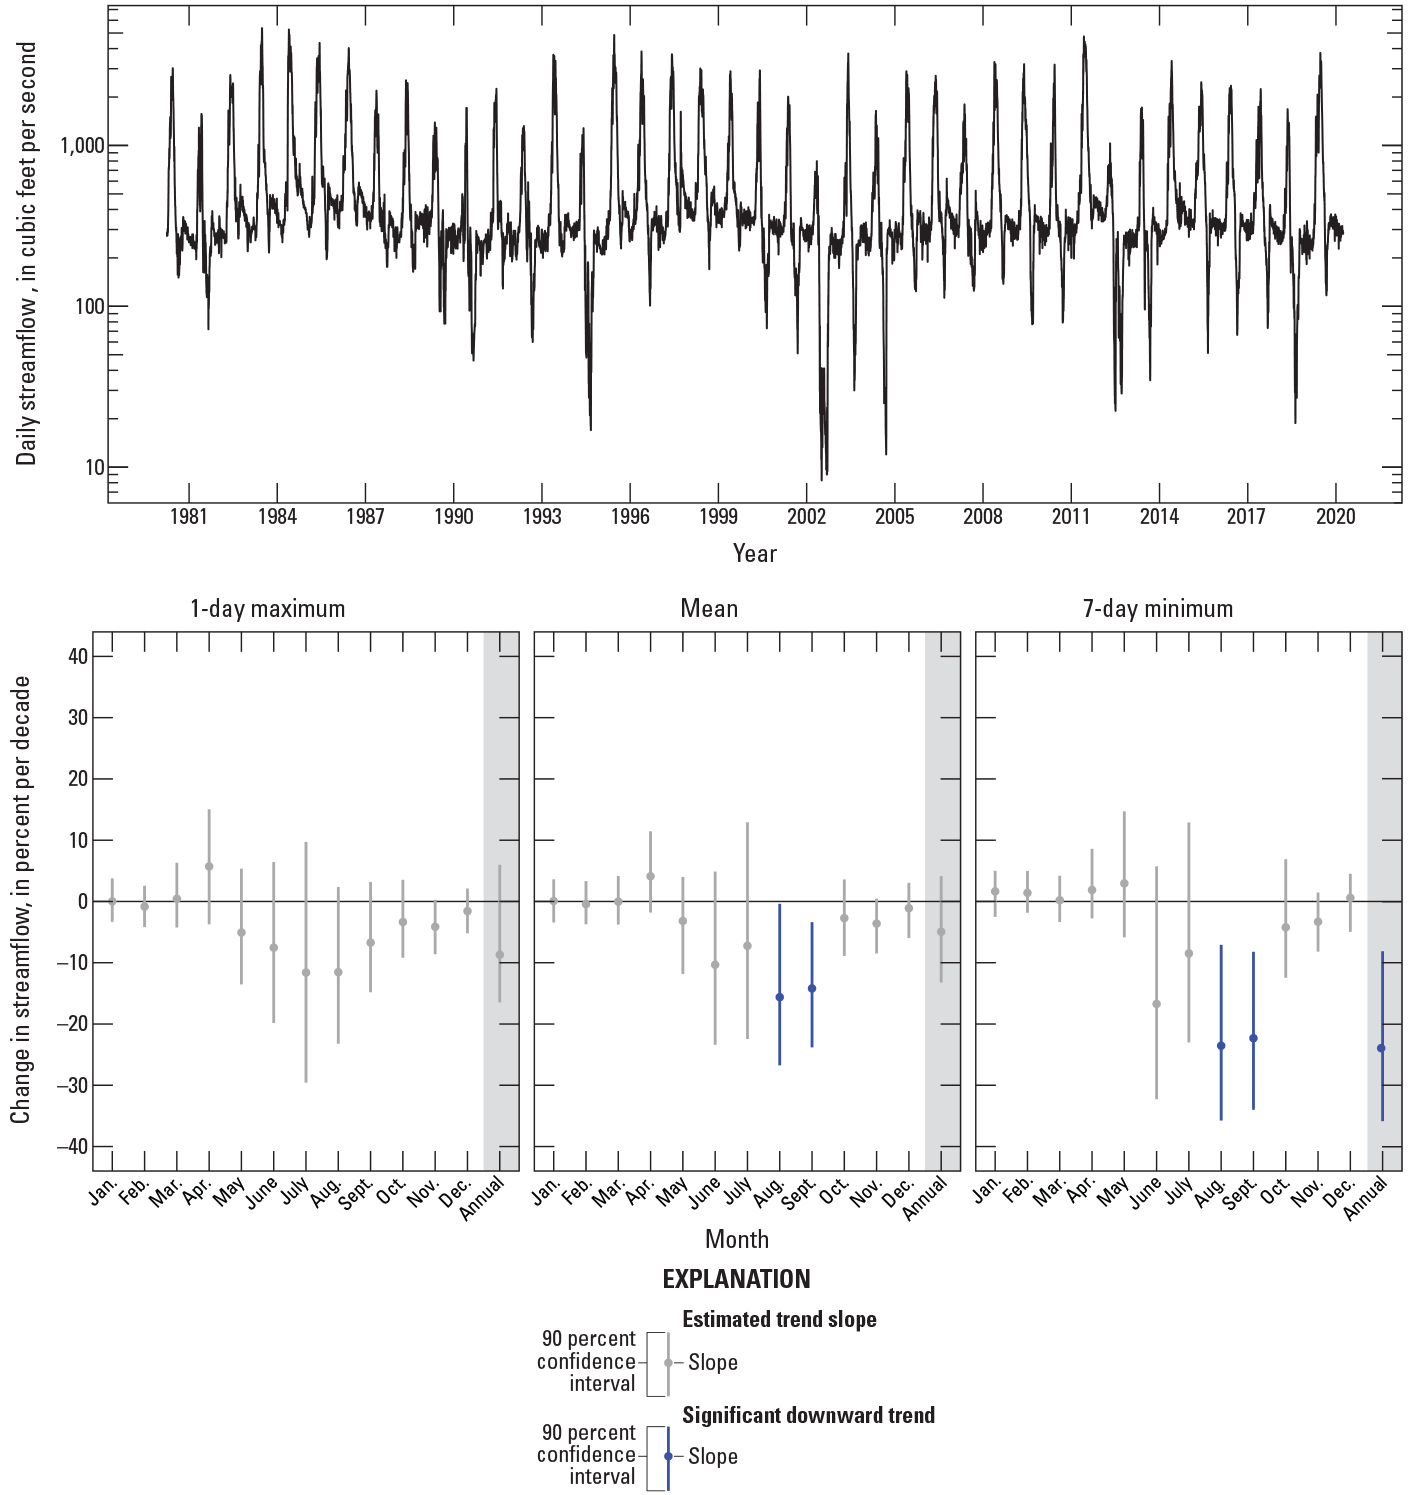
Daily streamflow (top plot; U.S. Geological Survey, 2021) and changes in 1-day maximum, mean, and 7-day minimum streamflow statistics (bottom plots) at White River above Coal Creek, near Meeker, Colorado, climate years 1980–2020. Jan., January; Feb., February; Mar., March; Apr., April; Jun., June; Jul., July; Aug., August; Sep., September; Oct., October; Nov., November; Dec., December.
A nonsignificant trend toward decreases in annual 1-day maximum streamflows (fig. 4) may influence benthic algal growth through alteration of the disturbance regime. The annual spring snowmelt pulse and other hydrologic events of sufficient magnitude can temporarily reduce benthic algal production and abundance (Grimm and Fisher, 1989) and alter community composition (Power and Stewart, 1987). Thus, lower 1-day maximum streamflows may promote benthic algal growth throughout the summer.
Seasonal Characterization of Nutrient Concentrations
Seasonal patterns in inorganic nitrogen, total nitrogen, and total phosphorus concentrations were observed at the four long-term monitoring sites (White River above Coal Creek, White River above Dry Creek, North Fork White River at Buford, and South Fork White River at Buford) during the period 2000–20. Similar patterns in orthophosphate data were observed from 2009 to 2020 (site nos. 18, 15, 12, 8, fig. 1; table 1; fig. 5A–D). The highest median monthly concentrations of inorganic nitrogen, total nitrogen, and total phosphorus at North Fork White River at Buford occurred in April, while the highest concentrations at South Fork White River at Buford, White River above Dry Creek, and White River above Coal Creek occurred in May and June (fig. 5A, B, D). Particulate forms of nutrients, including organic nitrogen and phosphorus readily sorb to soils and can be mobilized through leaching, soil loss (erosion), or desorption after precipitation events (Ulén and others, 2007). Spring snowmelt and rainfall transport nutrients and some sediments that have accumulated on the land surface over the winter into waterbodies, creating increased nutrient concentrations during these months (Hirsch, 2011). Decreases in nutrient concentrations after snowmelt runoff at most sites indicate reduced inputs from surface runoff along with increases in biological uptake of inorganic constituents, processes occurring in the hyporheic zone (Bardini and others, 2012), or changes in groundwater inputs (Kohn and others, 2019). Seasonal patterns in orthophosphate concentrations were less distinct (fig. 5C).
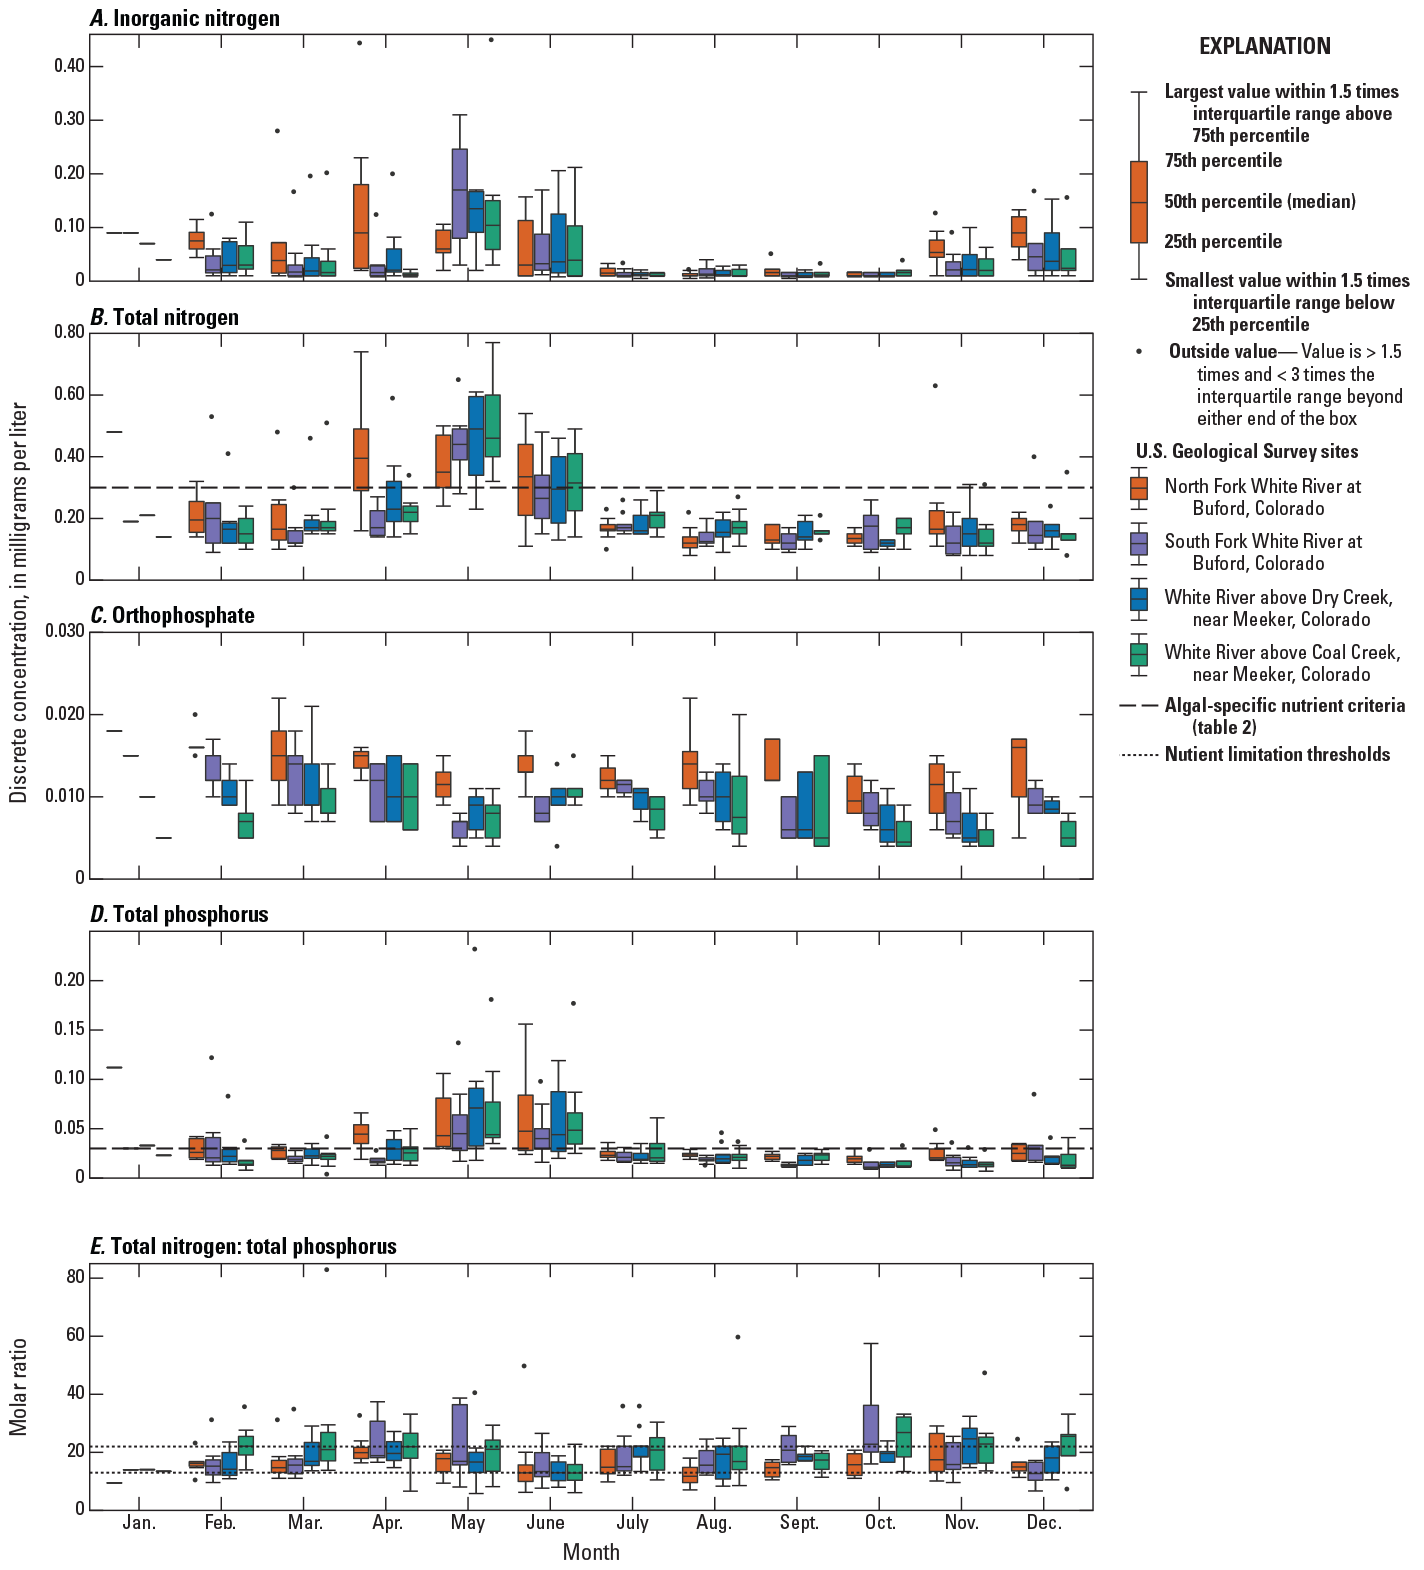
Discrete concentrations at four sites in the upper White River Basin, Colorado, for water years 2000–20: A, inorganic nitrogen; B, total nitrogen; C, orthophosphate; D, total phosphorus; and E, molar ratios of total nitrogen to total phosphorus (U.S. Geological Survey, 2021). Orthophosphate data are from water years 2009–20.
Median monthly total nitrogen concentrations were below algal-specific nutrient criteria (0.3 milligrams per liter [mg/L]) during summer months, July–September (fig. 5B). Median monthly total phosphorus concentrations were also below algal specific nutrient criteria (0.03 mg/L) during the same summer months (fig. 5D). However, discrete concentrations exceeded the criteria at all sites on multiple occasions during July–September. The algal-specific criteria are meant to apply seasonally, as low temperatures in winter and during high-streamflow events, such as spring runoff, can limit the effect of eutrophication (Suplee and Watson, 2013). However, during years when spring runoff occurs earlier, a longer growing season can result, where nutrient concentrations are relevant earlier, for example in June. Median monthly concentrations of total nitrogen exceeded the criteria at all but one site (South Fork White River at Buford) during June, and the median monthly concentration of total phosphorus exceeded the criteria for all sites in June (fig. 5B, D). Median monthly N:P ratios at each site generally fall within the range of values where algal growth is considered colimited by nitrogen and phosphorus, between 13 and 22 (fig. 5E), though nitrogen limiting (<13) and phosphorus limiting (>22) values were also measured. Mean annual concentrations were below CDPHE interim water-quality standards for nitrogen (1.25 mg/L) and phosphorus (0.11 mg/L) at all sites.
Temporal Trends in Nutrients and Comparison to Water-Quality Standards
Changes in land use, streamflow, and watershed management can contribute to changes in nutrient concentrations and loads over time (Murphy and Sprague, 2019; Stets and others, 2020). Long-term monitoring of water quality is essential for assessing the effect of natural and anthropogenic factors on water quality over an extended period of time. Identifying the causes of nutrient trends can aid land managers in designing nutrient-control strategies and can serve as ongoing measures of progress toward nutrient reduction. For this study, estimations of changes in nitrogen and phosphorus concentrations were used to assess if changes in concentrations have made water-quality conditions more favorable to algal growth.
Annual mean concentrations and annual total loads from 2000 to 2020 were generated by WRTDS models. Trends in concentrations and loads were calculated from streamflow-normalized annual mean concentrations, and annual total loads generated by the WRTDS models along with bootstrapped confidence intervals are displayed in figure 6. The WRTDS models were developed for inorganic nitrogen, total nitrogen, and total phosphorus at North Fork White River at Buford, South Fork White River at Buford, and White River above Coal Creek (site nos. 8, 12, 18, fig. 1; table 1); modeling of orthophosphate concentrations and loads was not possible due to a high number of censored values along with multiple changes in laboratory methodology and reporting limits (USGS, 2021), though discrete values from 2009 to 2020 are displayed in figures 5 and 7. Discrete concentrations of total nitrogen, total phosphorus, and N:P ratios are compared to algal-specific nutrient criteria and nutrient limitation thresholds in figure 7.
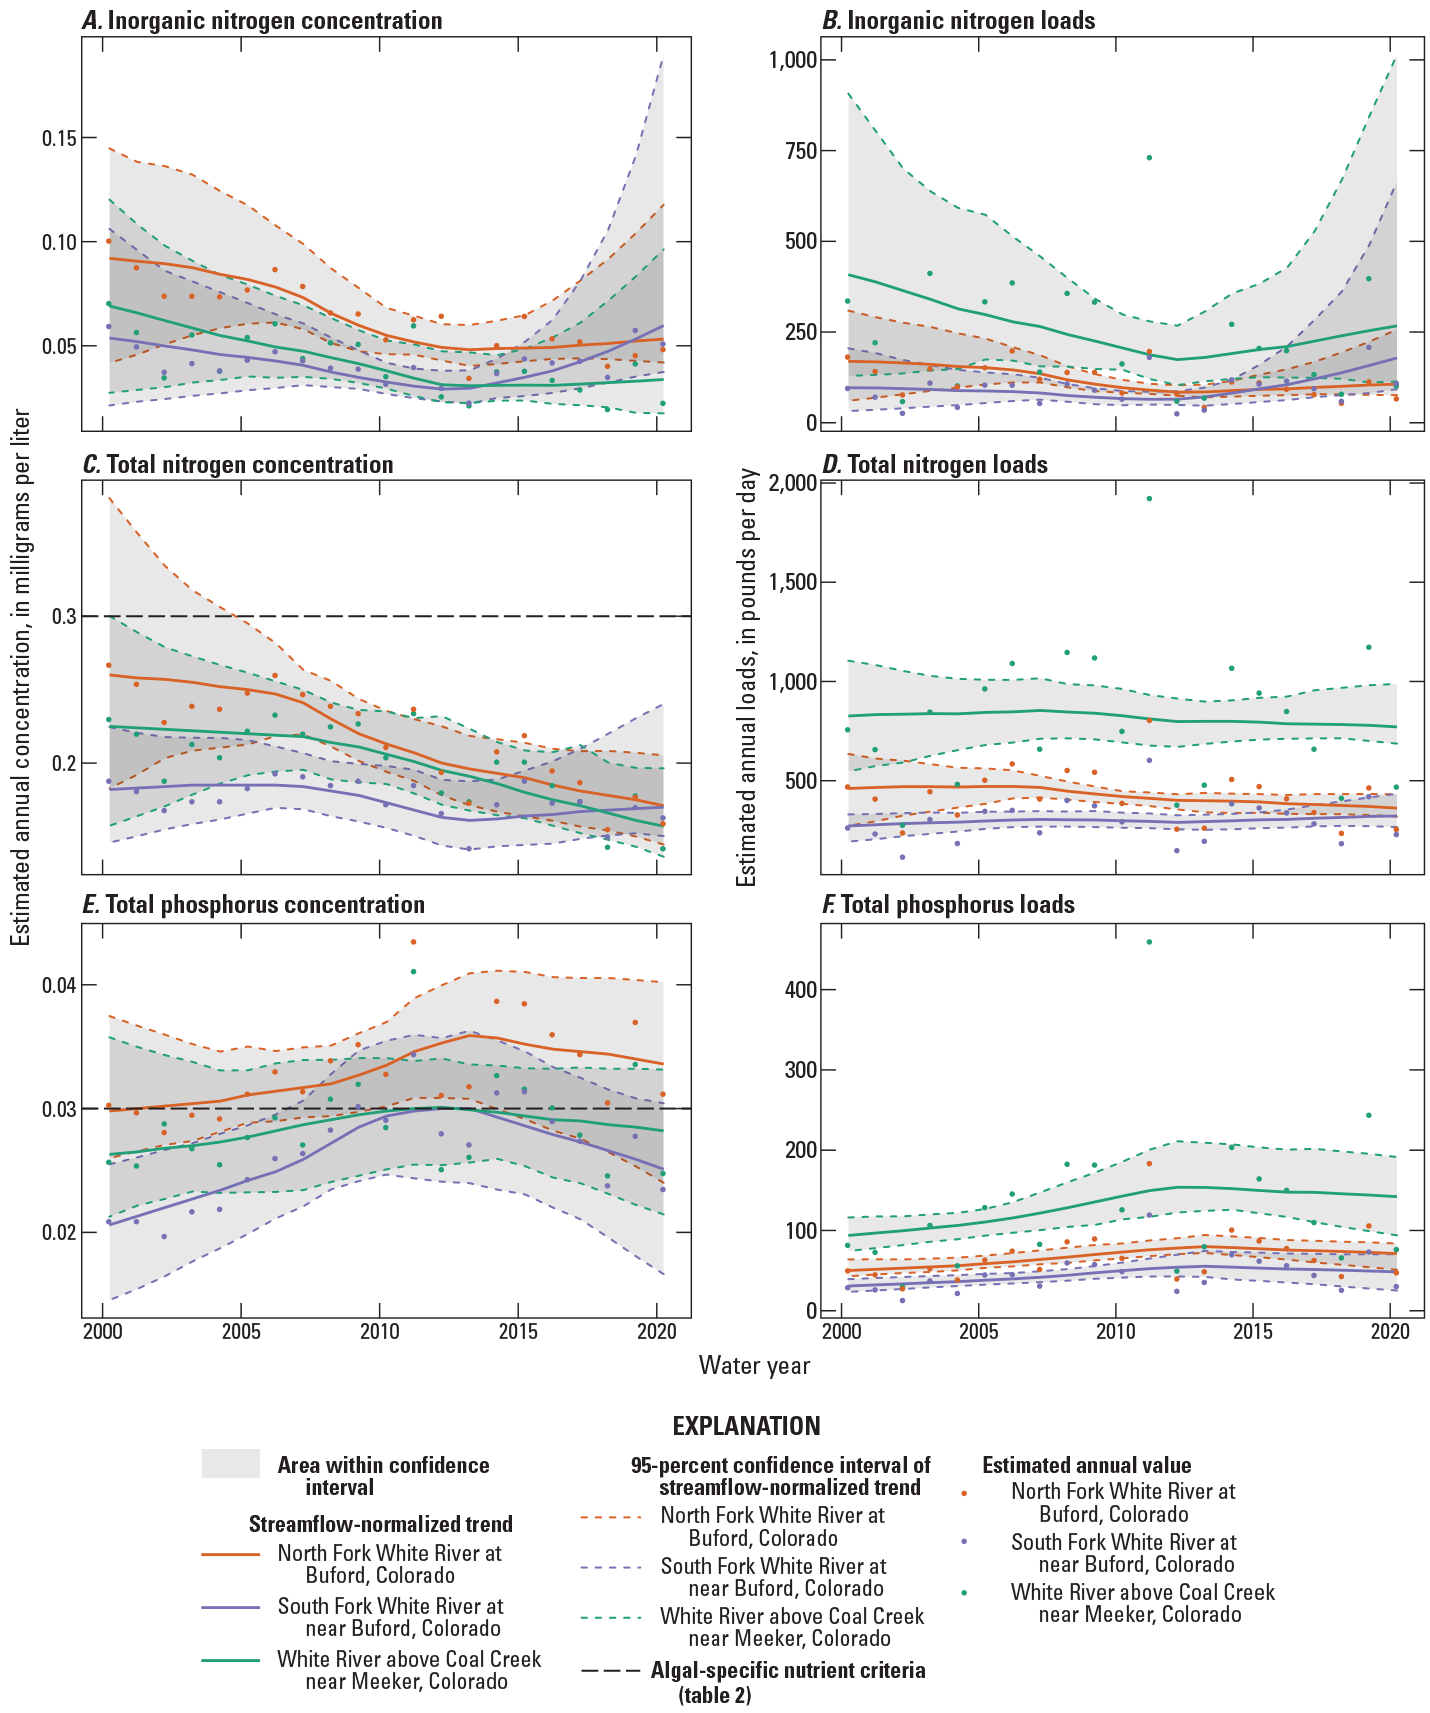
Annual concentrations and loads of inorganic nitrogen, total nitrogen, and total phosphorus estimated with the Weighted Regressions on Time, Discharge, and Season (Hirsch and De Cicco, 2015) method at North Fork White River at Buford, Colorado, South Fork White River at Buford, Colo., and White River above Coal Creek, near Meeker, Colo., water years 2000–20: A, C, E, estimated annual concentrations; B, D, F, estimated annual loads. Streamflow-normalized trends for estimated annual concentrations and loads of each constituent plotted with 95-percent confidence intervals. Data from U.S. Geological Survey (2021).
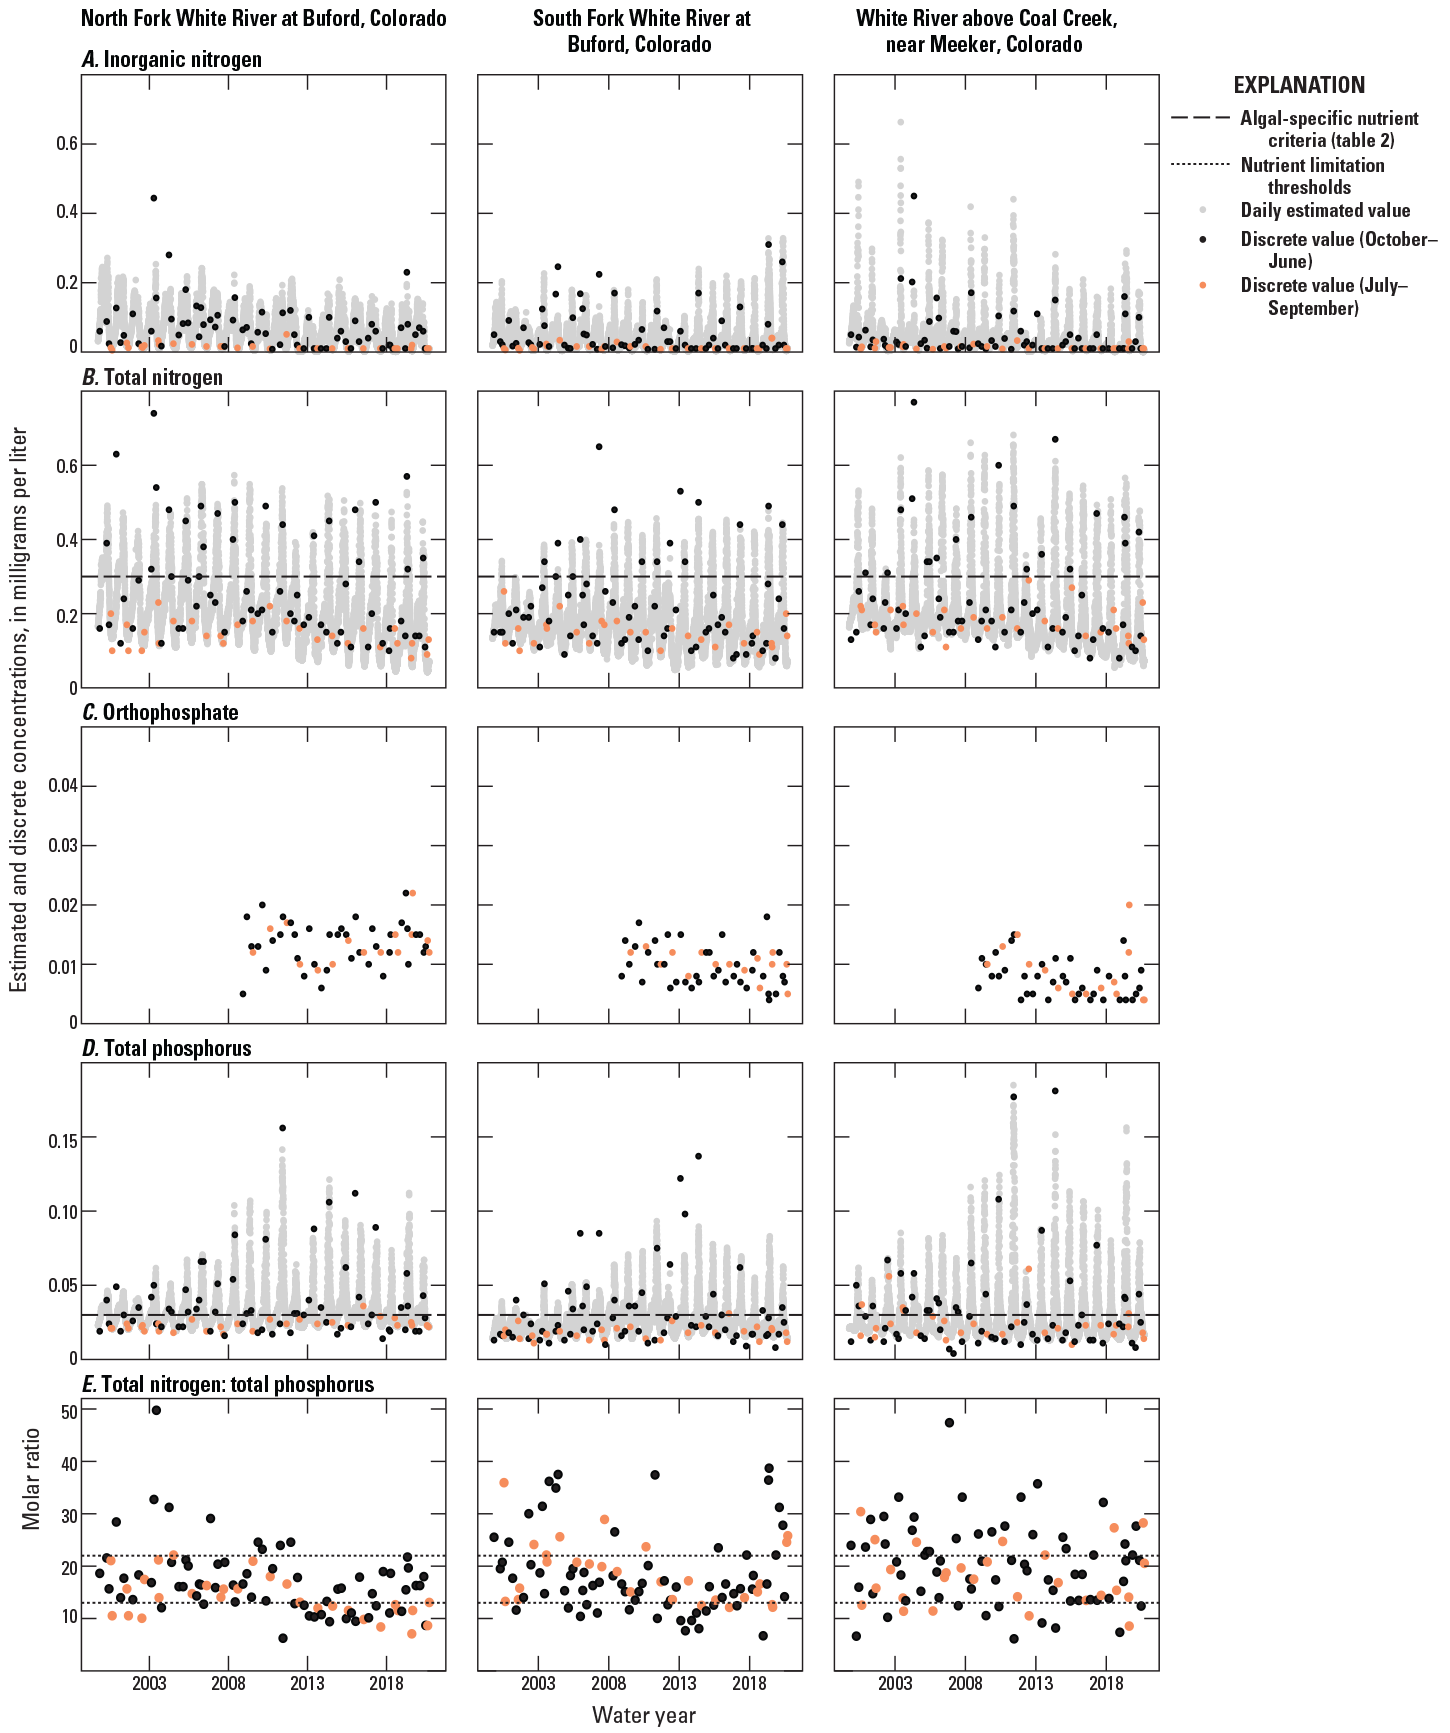
Daily concentrations estimated with the Weighted Regressions on Time, Discharge, and Season (Hirsch and De Cicco, 2015) method and discrete concentrations (U.S. Geological Survey, 2021) at North Fork White River at Buford, Colorado, South Fork White River at Buford, Colo., and White River above Coal Creek, near Meeker, Colo., for various water years: A, inorganic nitrogen; B, total nitrogen; C, orthophosphate; D, total phosphorus; and E, molar ratios of total nitrogen to total phosphorus.
The models used to predict streamflow normalized trends in nutrient concentrations and loads provided reasonable fits over the time period of analysis with load biases ranging from ± 0.1 for 9 out of 12 models (table 3). As described in the “Nutrient Trends” section, the load bias statistic provides an indication of how closely the estimated load values align with actual calculated load. The inorganic nitrogen and total phosphorus models at White River above Coal Creek had relatively high load biases, +0.248 and −0.351, respectively, indicating that interpretation of results from this site may need to be assessed with a higher degree of caution. Model fits and certainty of trends at all sites may improve with increased sampling frequency. Additional sampling during high-streamflow events may be especially useful for identifying concentration streamflow relations for constituents that increase substantially during high flows (Chanat and others, 2016). For the purposes of this report, the annual mean concentrations and loads and streamflow normalized trends in concentrations and loads from 2000 to 2020 can be used to give a general sense of mean conditions at sites in the upper White River Basin.
Table 3.
Results of weighted-regression trend analysis and regression statistics for streamflow-normalized annual concentrations and loads at North Fork White River at Buford, Colorado, South Fork White River at Buford, Colo., and White River above Coal Creek, near Meeker, Colo., for water years 2000–20 (U.S. Geological Survey, 2021).[Site numbers are shown on figure 1; no., number; USGS, U.S. Geological Survey; NWIS, National Water Information System; p-value, significance statistic; mg/L, milligram per liter; lb/d, pound per day; ≥, greater than or equal to; ≤, less than or equal to; < less than; >, greater than.]
Likelihood values and trend directions are computed from the two sided attained p-value and follow the pattern described in Hirsch and others (2015) where a range of likelihood values from ≥0.95 and ≤1.0 are considered “highly likely,” ≥0.90 and <0.95 is “very likely,” ≥0.66 and <0.90 is “likely,” >0.33 and <0.66 is “about as likely as not,” >0.1 and ≤0.33 is “unlikely,” >0.05 and ≤0.1 is “very unlikely,” and ≥0 to ≤0.05 is “highly unlikely.”
Nitrogen
The WRTDS model results indicate overall declines in inorganic and total nitrogen concentrations from 2000 to 2020 at North Fork White River at Buford and White River above Coal Creek. Steady decreases of inorganic nitrogen were observed from 2000 to about 2013, when concentrations appeared to stabilize, while total nitrogen concentrations continued to decline (fig. 6A, B). Inorganic nitrogen comprises less than half of the proportion of total nitrogen at these two sites, thus it can be inferred that the continued declines in total nitrogen are caused by decreases in organic nitrogen or ammonia. Declines in nitrogen concentrations at these two sites are apparent with simple visual inspection of discrete sample concentrations in figure 7A and 7B.
Steady declines in inorganic nitrogen concentrations were also observed at South Fork White River at Buford until about 2013, when a slight reversal in trends was observed (fig. 6A); however, trend magnitude and direction of total nitrogen at this site are less certain (table 3). As displayed in figure 6, the certainty of trends is generally lower at the beginning and end of a trend period. Although the WRTDS method incorporates methods to minimize this uncertainty (Hirsch and De Cicco, 2015), for this dataset, it is recommended to consider the reversal but understand that the addition of more data in subsequent years may help clarify the direction, magnitude, and certainty of trends, especially if sampling frequency is increased during seasons when the change is expected to occur.
Annual estimated concentrations of total nitrogen were below the algal-specific nutrient criteria at all sites and reflecting trends discussed for inorganic nitrogen, trended away from the criteria over time (fig. 6B). Across sites, discrete and daily estimated concentrations of total nitrogen exceeded the criteria in samples collected from October to June, whereas concentrations from samples collected during the growing season (July–September) were below the criteria (fig. 7B).
Mirroring trends in concentrations, annual loads of inorganic nitrogen showed overall declines of a similar magnitude from 2000 to 2020 at North Fork White River at Buford and White River above Coal Creek (fig. 6D; table 3). Annual loads of total nitrogen appear flatter than the concentration trends, but still show decreases during 2000–20 for North Fork White River at Buford and White River above Coal Creek (fig. 6E; table 3). Loads of inorganic nitrogen likely increased by 85 percent at South Fork White River at Buford, larger than the respective change in concentration of 11 percent (table 3). As mean loads are the product of concentration and streamflow integrated over time, the days of the greatest streamflow can strongly influence load trends. Thus, larger changes in loads than in concentrations can indicate that much of the change is occurring during greater streamflow periods (Hirsch and De Cicco, 2015). Causes of downward trends in nitrogen concentrations and loads is unknown, though research conducted in Loch Vale, a high-elevation watershed in the Colorado Front Range, reported decreases in stream nitrate concentrations starting in the mid-2000s, coincident with downward trends in nitrogen oxide emissions over the past decade (Mast and others, 2014).
Phosphorus
Upward trends in total phosphorus concentrations and loads were found at all three sites (table 3; fig. 6C, F). The magnitude of trends in phosphorus loads were generally greater than trends in concentrations across all sites, indicating that the largest changes in concentrations occurred during greater streamflow periods (table 3). Similar to the results for nitrogen, the phosphorous trends do not appear to be monotonic. Phosphorous concentrations increased until 2011, then decreased or stayed the same after 2011. In the upper White River Basin, the spring snowmelt runoff in 2011 was large compared to the water years proceeding and following it (fig. 4). Total precipitation accumulation at the Trappers Lake Snow Telemetry (SNOTEL) site in WY 2011 from December to April was about 13 inches greater than 2010 and 2012, which averaged around 14 inches (Natural Resources Conservation Service, 2021). The majority of the precipitation came during winter months, resulting in large spring runoff and a peak streamflow of 5,520 ft3/s, which was the third highest recorded peak at White River above Coal Creek (USGS, 2021). It is possible that this streamflow event had a flushing effect for total phosphorus in the basin, from stored phosphorus in soil and floodplains.
Annual estimated concentrations of total phosphorus were above the algal-specific nutrient criteria at North Fork White River at Buford from 2005 to 2020, indicating that phosphorus concentrations at this site likely promote algal growth (fig. 6C). Annual estimated concentrations exceeded nutrient criteria slightly later and less regularly at White River above Coal Creek and South Fork White River at Buford. Across sites, most exceedances of the criteria occurred in discrete and daily estimated concentrations from samples collected from October to June, though exceedances of discrete concentrations did occur at all three sites from samples collected during the growing season, July through September (fig.7D). Investigation of the causes of increases in phosphorus concentrations was out of the scope of this project, though possible sources based on related work is discussed in the “Synthesis” section.
Nitrogen to Phosphorus Ratios
Molar nitrogen to phosphorous (N:P) ratios were not computed from estimated values due to the high likelihood for error associated with computing the ratio of two estimated values. N:P ratios of discrete values are displayed over time to provide context for how nutrient limitation may have changed during the 20-year trend period (fig. 7E). In general, N:P ratios collected from July to September indicate movement from colimitation (10–22) to nitrogen-limited (<13) conditions at the North Fork White River at Buford (fig. 7E) starting in 2012. The shift to more nitrogen-limited conditions coincides with the estimated decreases in total nitrogen and increases in total phosphorus at this site. Ratios remained at or below the nitrogen limitation threshold throughout the study period. Similar shifts from colimited and phosphorus-limited conditions to more nitrogen-limited conditions were observed at the South Fork White River at Buford in discrete samples collected from July to September, though the degree of nitrogen limitation was less than that on the North Fork White River at Buford. Greater N:P ratios were measured in July to September of 2020 (fig. 7E). Nutrient limitation tended to be more colimited at White River above Coal Creek (fig. 7E).
Characterization of Short-Term Nutrient Data
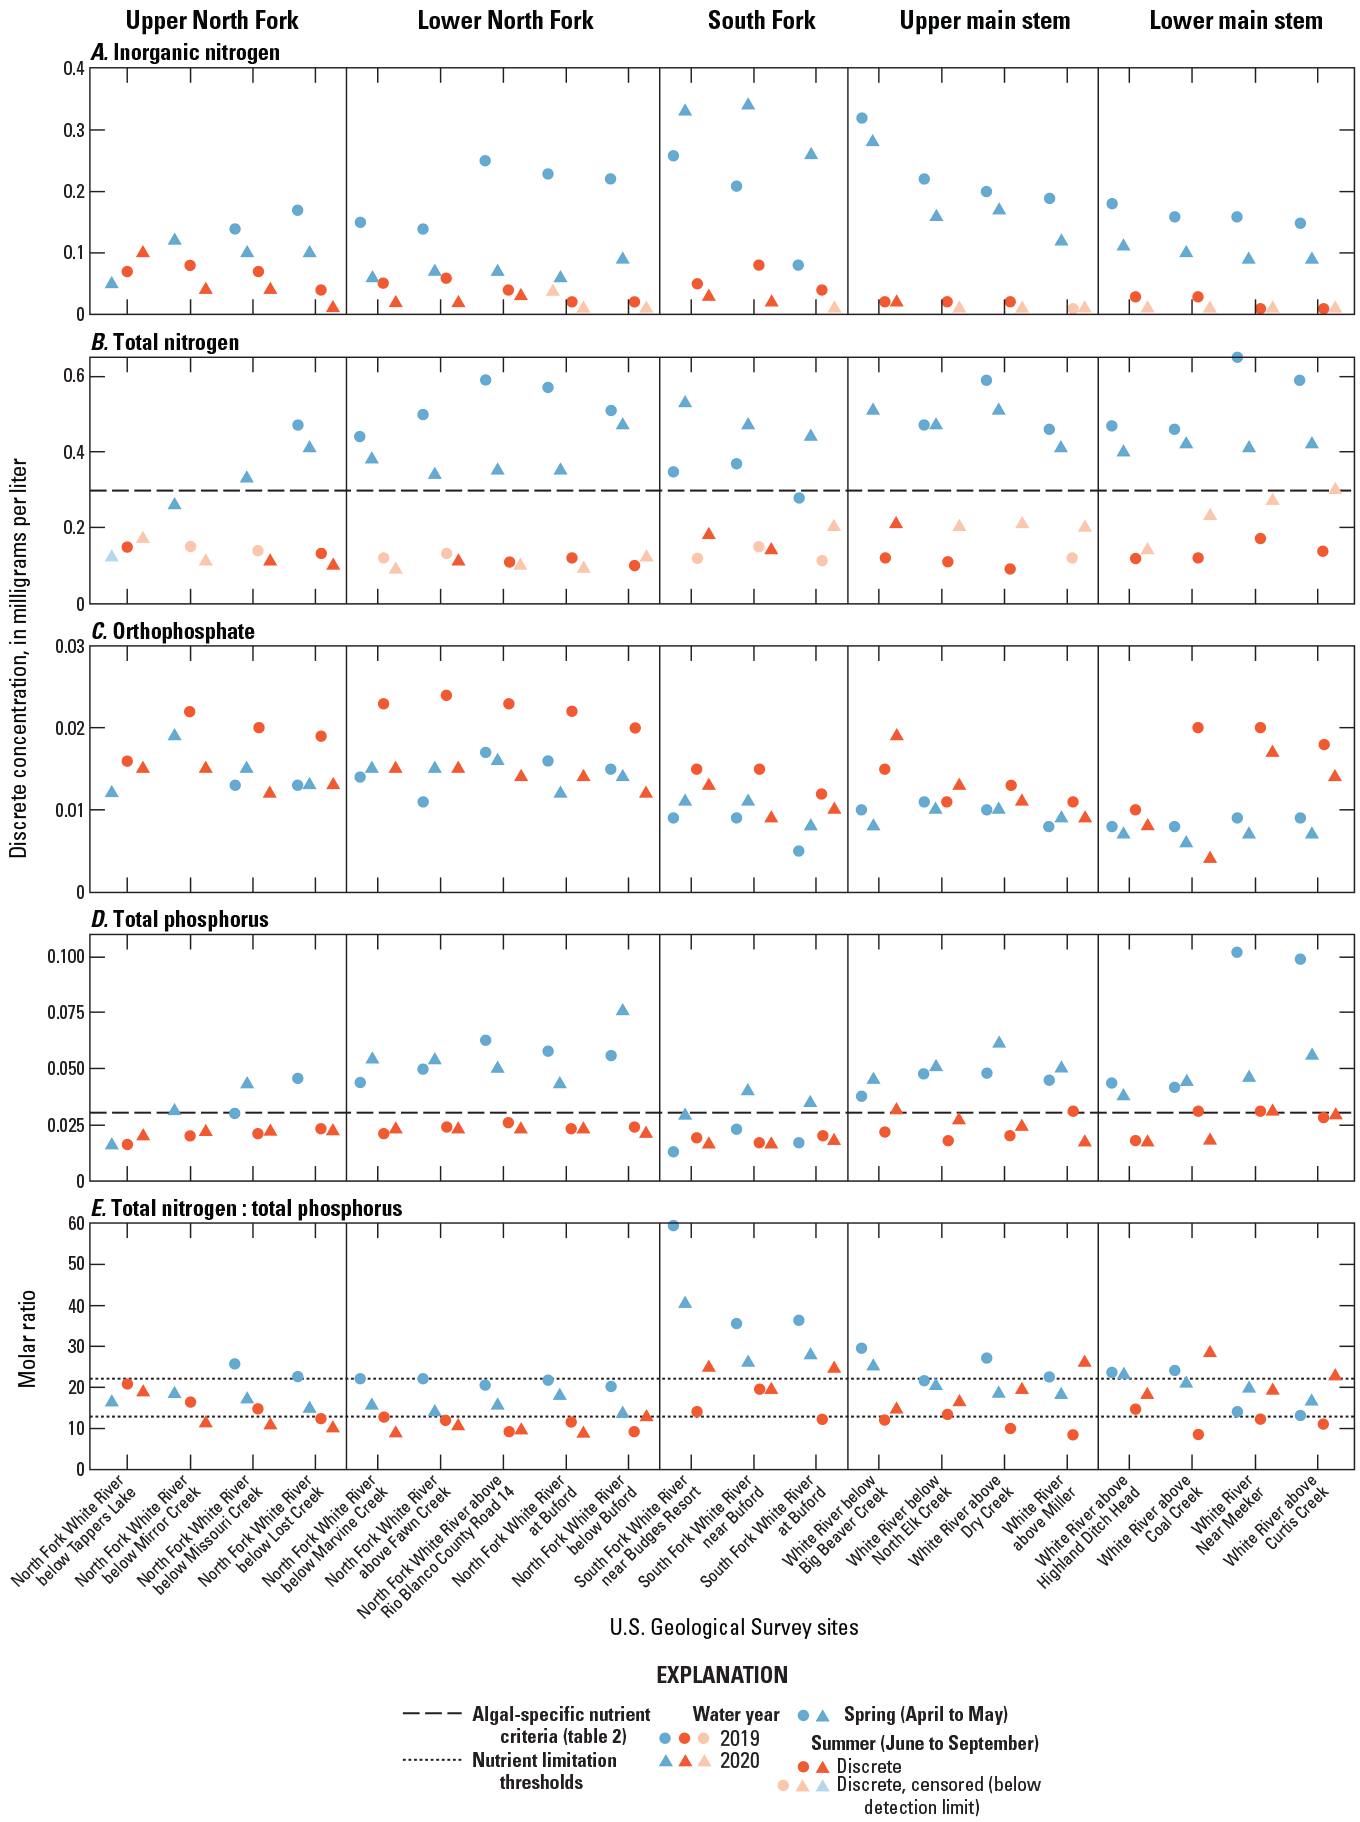
To better assess spatial differences in nutrient conditions across the upper White River Basin, quarterly sampling at four sites in the long-term monitoring program was supplemented with spring (April–May) and summer (July–September) sampling at an additional 16 sites (fig. 1; table 1) during 2019 and 2020. Spring and summer time periods were selected to improve understanding of nutrient concentrations when nutrient-source inputs were expected to dominate and to characterize nutrient concentrations later in the water year when the greatest level of biological activity was expected. Discrete concentrations and N:P ratios are displayed in figure 8. These data are used to assess variation in algal biomass across sites in Day and Henneberg (2023). Spring and summer samples are displayed as different colored symbols, and 2019 and 2020 samples are shown as different symbols. Censored data, which have concentrations below the reporting limit, are shown as faded. Concentrations and molar ratios are summarized by subbasin in table 4.
As observed in the long-term data, concentrations of inorganic nitrogen, total nitrogen, and total phosphorus were greater during spring sampling compared to summer, reflecting increased inputs from snowmelt runoff (fig. 8A, B, D). Seasonal variation in orthophosphate was comparatively less than differences in hydrology, though in only some basins.
Samples were collected during spring to characterize nutrient conditions when nutrient source inputs were expected to dominate. Mean concentrations of inorganic nitrogen in the South Fork compared to the North Fork subbasin were greatest during spring (table 4; fig. 8A), and the South Fork had the greatest among all subbasins. Total nitrogen concentrations were greatest in the lower North Fork subbasin compared to the South Fork subbasin. During spring, mean concentrations of orthophosphate and total phosphorus in the lower North Fork subbasin were nearly double those in the South Fork (table 4). Relative to other sites on the main stem, White River near Meeker and White River above Curtis Creek (site nos. 19, 20, fig. 1; table 1) had elevated concentrations of total nitrogen, orthophosphate, and total phosphorus during spring, predominately in 2019 (fig. 8B, C, D).
Discrete concentrations at 20 sites in the upper White River Basin, Colorado for the 5 subbasins in figure 1 during spring (April–May) and summer (June–September) for water years 2019–20: A, inorganic nitrogen; B, total nitrogen; C, orthophosphate; D, total phosphorus; and E, molar ratios of total nitrogen to total phosphorus (U.S. Geological Survey, 2021). Site names are abbreviated U.S. Geological Survey site names from table 1.
Table 4.
Mean values of nutrient concentrations and nitrogen to phosphorus molar ratios (U.S. Geological Survey, 2021) collected during spring (April–May) and summer (June–September) from sites located within five subbasins (fig. 1; table 1) in the upper White River Basin, Colorado, 2019–20.[mg/L, milligram per liter; N:P, molar ratio of total nitrogen to total phosphorus]
Connections between streamflow and nutrient concentrations were apparent during spring sampling across the distinct hydrographs observed during WYs 2019 and 2020 (fig. 2). Relatively high snowpack and cooler spring temperatures resulted in an extended duration of streamflow runoff in 2019. Peak streamflow occurred on June 21st, about 23 days later than the mean peak streamflow date (May 28th) from 1962 to 2020 (USGS, 2021). Streamflow remained within the 90th percentile through July and maintained at normal levels through the rest of the water year. Conversely, the streamflow peak in 2020 occurred closer to the mean peak streamflow date and was within the normal range as defined by data from the period of record. Streamflow quickly dropped off to below normal conditions, and streamflows were much below normal from July through September (fig. 2). Concentrations of inorganic nitrogen and total nitrogen were greater during the spring of 2019 compared to the spring of 2020 at most sites in North Fork and main stem White River, likely reflecting flushing of nutrients from soils because of increased runoff and groundwater inputs (fig. 8A, B). The two furthest downstream sites, White River near Meeker and White River above Curtis Creek (site nos. 19, 20; fig. 1, table 1), also had much greater concentrations of total nitrogen and total phosphorus in samples collected during spring of 2019, likely reflecting the influence of increased surface runoff on erosion and flushing of nutrients off the land surface.
During summer sampling, nutrient concentrations reflected the demand from biological uptake. Inorganic nitrogen concentrations were greatest in the upper North Fork subbasin (table 4), especially at the first site in the subbasin, North Fork White River below Trappers Lake (site no. 1, fig. 1; table 1; fig. 8A). Measurements indicate little variation in inorganic nitrogen among sites in other subbasins (fig. 8A). The overall lack of variation among sites is likely explained by rapid consumption of these constituents by aquatic organisms, including plants and algae, or other geochemical factors, including hyporheic zone processes (fig. 8A, C). Total nitrogen concentrations were greatest in the main stem subbasins, especially during 2020, and a notable dilution of total nitrogen likely occurred between White River above Miller Creek and White River above Highland Ditch Head (site nos. 16, 17, fig. 1; fig. 8B; tables 1, 4). Orthophosphate concentrations were greatest in the lower North Fork subbasin (table 4; fig. 8C). Total phosphorus concentrations were similar among subbasins in the North Fork and main stem but lower in the South Fork subbasin (table 4; fig. 8D). More elevated concentrations of orthophosphate and total phosphorus were observed at the furthest downstream sites in the lower main stem subbasin, White River near Meeker and White River above Curtis Creek (site nos. 19, 20, fig. 1; fig. 8C, 8D; table 1, 4). Interestingly, orthophosphate concentrations at sites in the North Fork subbasins and the furthest downstream sites were greater in 2019 than 2020 during summer sampling (fig. 8C).
Nutrient concentrations were compared to CDPHE interim water-quality standards and algal-specific nutrient criteria during summer sampling only, as nutrient conditions during the spring sampling do not necessarily represent conditions when algal growth occurs. They were all below the CDPHE standard. Total nitrogen concentrations were below benthic algae-specific criteria (0.30 mg/L) during summer sampling in the North and South Forks, whereas concentrations approached or met the criteria on the main stem in 2020 (fig. 8B). Relative to total nitrogen, total phosphorus concentrations were much closer to the algae criteria and exceeded the criteria directly below the confluence of the North and South Forks at White River below Big Beaver Creek and below the Coal Creek tributary at White River near Meeker, Colo. (site nos. 13, 19, fig. 1; fig. 8D; table 1). The N:P ratios during summer sampling indicated nitrogen-limiting conditions (<13) in the North Fork subbasins, whereas the South Fork subbasin tended to indicate more phosphorous-limiting conditions. The upper and lower main stem White River subbasins were more variable but remained mostly in the colimiting range of N:P ratios (fig. 8E). Samples from summer of 2019 tended to be more nitrogen-limited on the main stem, most likely resulting from dilution of total nitrogen concentrations by greater streamflow.
Isotope Source Tracking
To evaluate sources of nitrogen in the upper White River Basin, the isotopic ratios of nitrogen (δ15N) and oxygen (δ18O) of detected nitrate were compared across four sites (site nos. 4, 6, 7, 11, fig. 1; table 1). The isotopic results are expressed as parts per thousand (per mil) relative to the standard of mean ocean water (SMOW) for δ18O and to atmospheric nitrogen (N2) for δ15N. The dual isotopic composition of nitrogen has been used to identify the origin of nitrate in water because the isotopic compositions can be different among various sources, such as atmospheric nitrogen, soil nitrogen, chemical fertilizers, and manure (Xue and others, 2009; fig. 9). Nitrate concentration needs to be above a threshold concentration (0.06 mg/L) to analyze isotopes, so sample collection occurred in April, during spring runoff, when greater concentrations were expected. Only four sites had sufficient nitrate concentrations for an isotope analysis, three on the North Fork White River and one on the South Fork White River, limiting a broad spatial comparison of nitrate sources (fig. 9).
Isotopic ratios of both O and N were relatively similar across sites, with δ15N ranging from +4.20 to +5.70 per mil, and δ18O ranging from -1.70 to -3.96 per mil. The δ18O and δ15N values are shown on a dual isotope plot that also shows the expected ranges of δ18O and δ15N for several nitrogen sources (fig. 9; Kendall, 1998). The isotopic compositions of nitrate from this study are within the range typical of soil-derived nitrate, though the same values can also be derived from a mixture of fertilizer and rain and manure or septic sources (fig. 9). Samples were only collected during April, precluding the capture of seasonal variation in nitrate sources by this analysis.
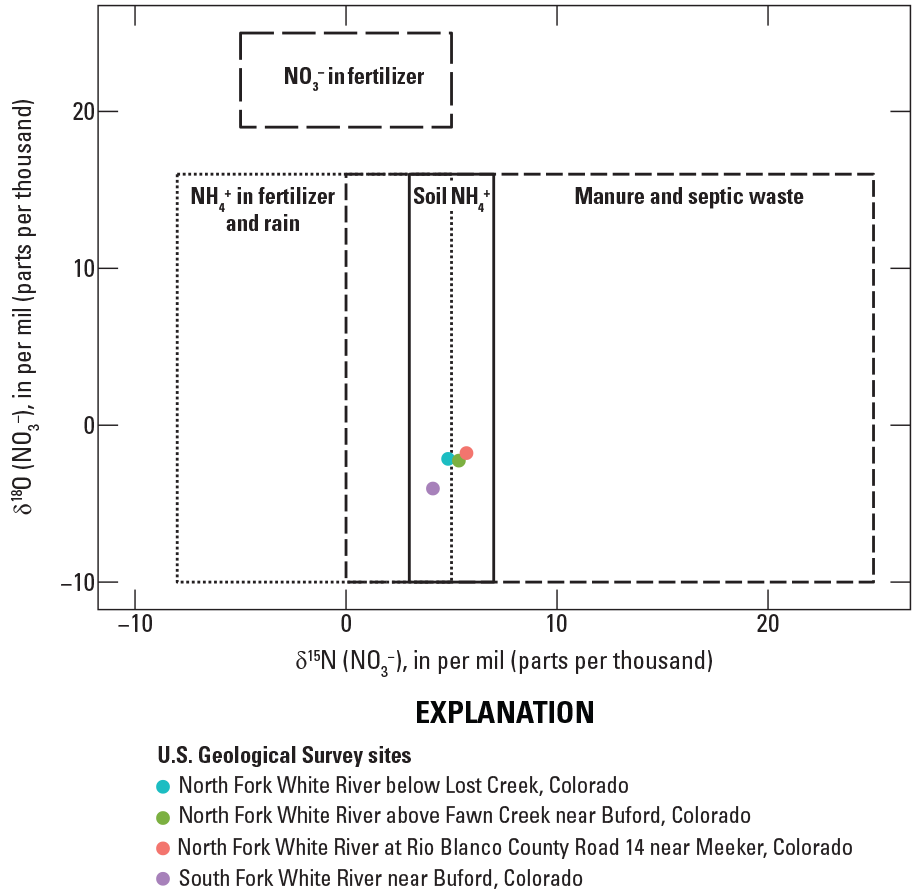
The isotopic ratios of nitrogen (δ15N) and oxygen (δ18O) of detected nitrate in water samples collected from four sites in the upper White River Basin, Colorado (U.S. Geological Survey, 2021), relative to possible sources from Kendall (1998). δ, delta; N, nitrogen; NO3-, nitrate; O, oxygen; NH4+, ammonium.
Synoptic Load and Yield Analysis
A synoptic-style sampling was conducted during base-flow conditions in 2020 to calculate loads and yields of nutrients across 20 sites and 5 subbasins in the upper White River Basin (fig. 1; table 1). Load calculations are useful for identifying the relative magnitude of inputs from various potential source areas. Comparisons of constituent loads among sites allow for the determination of river reaches that have elevated contributions of a given constituent. Streamflow is one of the two dominant factors that determines stream nutrient loads, and streamflow variability among sites is a function of the associated basin sizes and the amount of precipitation that falls within them. Calculating nutrient yields normalizes for the effects of differences in drainage area and streamflow among sites, and yields can be used to explore relations between basin attributes and stream nutrient export. Identifying areas with greater yields of a given constituent can help land managers target load-reduction strategies to specific areas. The synoptic sampling was done during base flow conditions when minimal irrigation withdrawals were expected; there may be other sources during different times of the year, especially spring runoff.
During the 2020 synoptic sampling event, streamflow generally increased from upstream to downstream on the North Fork and South Fork White River, reflecting inputs from groundwater and surface-water tributaries (fig. 10A; table 5). Losses of streamflow totaled 20 ft3/s between North Fork White River below Missouri Creek and North Fork White River below Lost Creek, and between multiple streamgages on the main stem of the White River (fig. 10A; table 5). Sampling was conducted in mid-October during a period of steady streamflow conditions; however, some streamflow loss may have occurred because of small, unidentified river diversions, losses to groundwater, and minor amounts of evapotranspiration.
Table 5.
Streamflow, nutrient concentration (U.S. Geological Survey, 2021), nutrient load, nutrient load error, and change in load between site and upstream site for the synoptic samples collected October 22, 2020, from 20 sites in the upper White River Basin, Colorado.[Bold font designates subbasin boundaries that represent the cumulative load of each subbasin. Site no., site number from figure 1; Subbasin, subbasin from figure 1; USGS; U.S. Geological Survey; ft3/s, cubic foot per second; mg/L, milligram per liter; lb/d, pound per day; NA, not applicable; <, less than.]
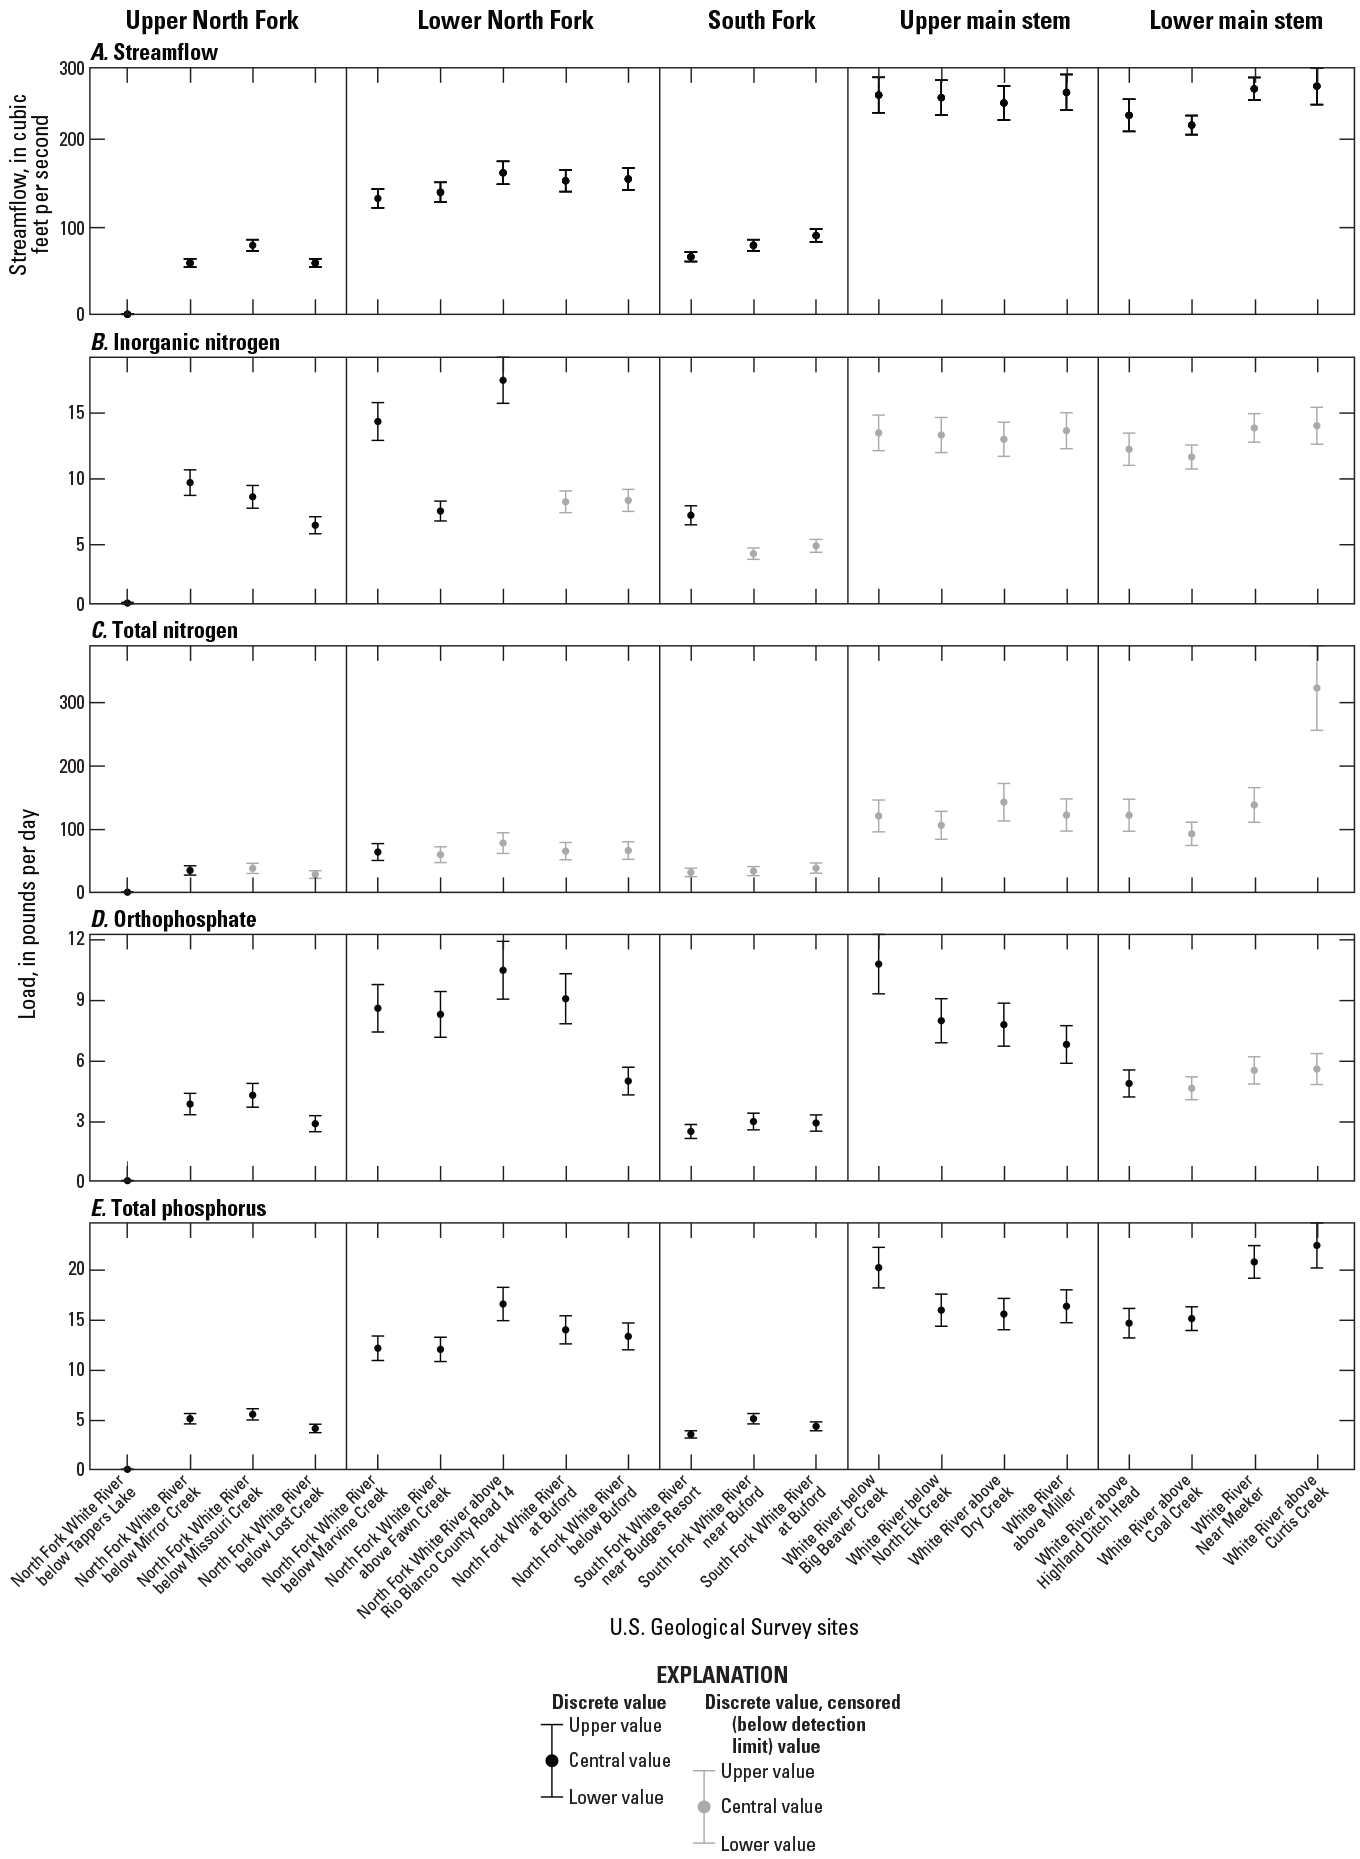
Streamflow (U.S. Geological Survey, 2021) and nutrient loads with total error bars (calculated by combining streamflow error and concentration error using error propagation as outlined in Taylor [1982] and Williams and Leib [2005]) at 20 sites in the upper White River Basin, Colorado, from October 22, 2020: A, streamflow; B, inorganic nitrogen loads; C, total nitrogen loads; D, orthophosphate loads; and E, total phosphorus loads. U.S. Geological Survey site names are from table 1.
Increases in streamflow and associated loads of all constituents were consistently measured downstream from surface-water tributaries. Multiple small tributaries and Mirror Creek enter between Trappers Lake and North Fork White River below Mirror Creek that may be sources of streamflow and nutrients (site nos. 1 and 2, fig. 1; table 1). At the time of sampling, the streamflow more than doubled below Marvine Creek and inputs of total phosphorus and orthophosphate increased by 23 and 66 percent, respectively. Concentrations of nutrients were not directly measured in Marvine Creek, though the relative increases in concentrations and streamflow below Marvine Creek indicate that concentrations within Marvine are greater than those in the North Fork White River. Streamflow input from Marvine Creek amounted to around 50 percent of the total streamflow measured at North Fork White River (table 5). Thus, a better understanding of nutrient sources in the Marvine Creek Basin could support management of nutrient loading, especially phosphorus, in the North Fork White River.
Minimal increases in streamflow (fig. 10A) and inorganic nitrogen (fig. 10B) occurred between the two sites furthest downstream, White River near Meeker and White River above Curtis Creek. A substantial increase in total nitrogen concentration and load (fig. 10C) were measured, thus, inputs of organic nitrogen are most likely responsible for the relatively high concentrations and loads of total nitrogen at the furthest site downstream. Organic forms of nitrogen are derived from plant material or organic contaminants including sewage effluent and runoff from land where manure has been applied or stored (Hem, 1985).
The streamflow in the lower North Fork subbasin comprised 63 percent of streamflow at the confluence of the North and South Forks (fig. 11A; table 6). Consistent with relative streamflow contributions, the cumulative load (or load at the most downstream site within a subbasin) of the lower North Fork subbasin contributed 63 percent of inorganic nitrogen, 63 percent of total nitrogen, 63 percent of orthophosphate, and 75 percent of total phosphorus to the load at the confluence of the North and South Forks (fig. 11C, E, G, I; table 6). Small increases in inorganic nitrogen and decreases in orthophosphate loads from the confluence to the bottom of the main stem White River (fig. 11C, G) likely represent biological uptake or sorption from other hyporheic zone processes occurring in the main stem White River. Inorganic nitrogen and orthophosphate are the most bioavailable forms, thus changes in concentration can be indicative of biological consumption. The elevated concentration of total nitrogen calculated at White River above Curtis Creek drives the elevated cumulative loads observed in the lower main stem subbasin (site no. 20, fig. 1; figs. 10C, 11E).
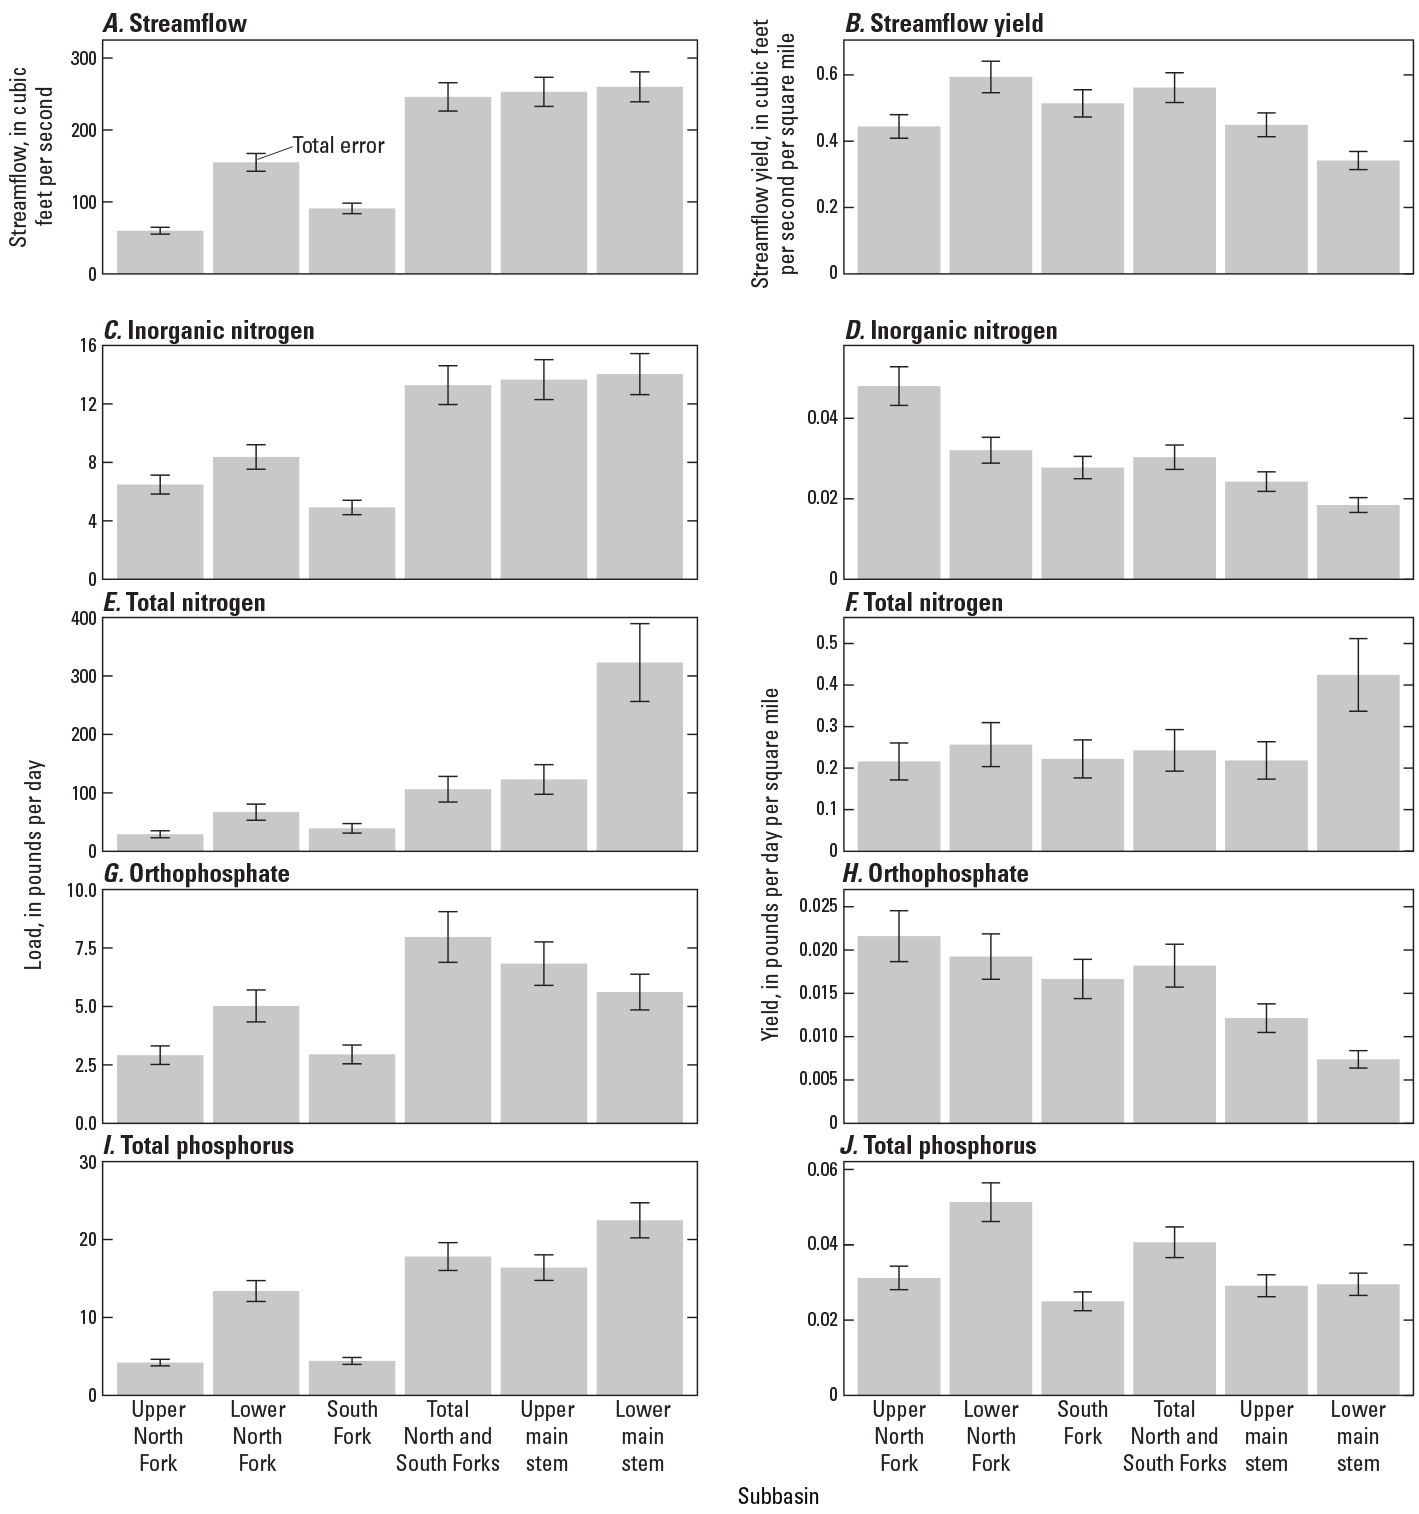
Cumulative streamflow (U.S. Geological Survey, 2021) and nutrient loads and yields with total error bars (calculated by combining streamflow error and concentration error using error propagation as outlined in Taylor [1982] and Williams and Leib [2005]) at subbasins (fig. 1) in the upper White River Basin, Colorado, on October 22, 2020: A, streamflow; B, streamflow yields; C, inorganic nitrogen loads; D, inorganic nitrogen yields; E, total nitrogen loads; F, total nitrogen yields; G, orthophosphate loads; H, orthophosphate yields; I, total phosphorus loads; J, total phosphorus yields. Subbasin boundary designations are shown in figure 1 and cumulative values represent the streamflow, load, or yield of the most downstream site within a subbasin.
Table 6.
Basin area, cumulative streamflow (U.S. Geological Survey, 2021), streamflow yield, nutrient load, and nutrient yields for the synoptic samples collected October 22, 2020, from five subbasins (fig. 1; table 1) in the upper White River Basin, Colorado.[Subbasin, subbasin from figure 1 and table 1; mi2, square mile; ft3/s, cubic foot per second; (ft3/s)/mi2, cubic foot per second per square mile; N, nitrogen; lb/d; pound per day; (lb/d)/mi2, pound per day per square mile; P, phosphorous]
The greatest yields of inorganic nitrogen and orthophosphate were measured in the upper North Fork subbasin (fig. 11D, H; table 6). Yields of total nitrogen were similar except in the lower main stem subbasin (fig. 11F; table 6), indicating that this subbasin has larger contribution per square mile for total nitrogen than other subbasins. Total phosphorus yield was greatest in the lower North Fork subbasin, likely due to streamflow and nutrient inputs from tributaries including Marvine and Fawn Creeks (figs. 1, 9; table 5).
Synthesis
This assessment was designed to characterize timing, sources, and potential changes in nutrient occurrence and streamflow conditions that may influence nutrient occurrence and other habitat characteristics relevant to algal growth and proliferation. A better understanding of these factors is useful for identifying potential causes of nuisance levels of benthic filamentous algae in the upper White River Basin.
Long-Term Changes in the Basin
An assessment of existing long-term data indicates that streamflow and nutrient conditions have become more favorable to benthic algae over varying timescales. Significant decreases in daily mean and 7-day minimum streamflow statistics were observed at White River above Coal Creek from 1980 to 2020 (fig. 4). Seasonal low streamflows are the flows that occur in the absence of precipitation and are generated from storage discharge from surface water, including lakes and reservoirs, and groundwater discharge (Smakhtin, 2001). Reductions in low streamflows during summer months can have large effects on other abiotic factors including temperature, dissolved oxygen, light availability, and dilution potential (Rolls and others, 2012), where, in the absence of scouring streamflows, biomass can accrue rapidly. Further, the effect of nutrients on algal production may be more pronounced in aquatic ecosystems with prolonged periods of stable low streamflows (Chételat and others, 1999; Biggs, 20003). Algal growth rates generally increase with increasing water temperature (Dodds, 1991) and light availability can often correlate with algal biomass (Hill, 1996). Continuous long-term water temperature records do not exist in the upper White River Basin, though increases in air temperature across the State of Colorado (Frankson and others, 2017) in combination with decreases in streamflow likely correspond to increases in water temperatures. The influence of water temperature and light availability on algal biomass in the upper White River Basin is discussed further by Day and Henneberg (2023).
Basin-wide increases in phosphorus were observed, and the magnitude of trends in phosphorus loads were generally greater than trends in concentrations across all sites (table 3), indicating that the largest changes in concentrations occurred during high streamflow periods. The relatively uniform increase and decrease in total phosphorus starting around 2012 across tributaries indicates that the controlling factors may be regional in scope. Similar increases in phosphorus loads of around 40 percent were found across a similar time period (1999–2018) at Yampa River at Steamboat Springs (USGS site number 09239500; USGS, 2021), located in a nearby basin (Day, 2021). Observations of long-term nutrient data at four sites in the basin show that inputs of nutrients occur primarily during spring runoff (fig. 5); therefore, changes in the character of snowmelt runoff may influence nutrient inputs. A decrease in maximum streamflow at White River above Coal Creek indicates changes in the timing, magnitude, and duration of snowmelt, a phenomenon occurring across the Western United States, primarily linked to changes in climate (Udall and Bates, 2007). Less streamflow during spring snowmelt runoff could lead to decreased dilution of nutrients and result in higher concentrations during spring runoff, a response that is commonly observed during droughts (Mosley, 2015).
In addition to decreases in streamflow, increases in nutrient inputs, especially those acting on a basin- or regional-scale, may contribute to the increasing trends in phosphorus concentrations and loads. In the upper Yampa River Basin, total phosphorus concentrations were strongly correlated to suspended sediment concentrations (Day, 2021). Suspended sediment is not regularly sampled by the USGS in the upper White River Basin. Changes in any activity influencing suspended sediment mobilization near or within the stream channels may contribute to greater phosphorus mobilization into streams. Legacy phosphorus, which is phosphorous accumulated from historical fertilizer and manure applications, can be remobilized by land disturbance activities such as grazing and development and contribute to elevated surface-water phosphorus (Stackpoole and others, 2019). Increases in deposition of phosphorous-rich dust (Stoddard and others, 2016), phosphorus release from soils caused by changes in soil pH due to reduced acidity of precipitation (Corman and others, 2018), and warming associated with climate change (Conant and others, 2011) are potential contributors to remobilization of legacy phosphorous. Targeted research could support determination of whether the increases in phosphorus are a result of within-basin land use and management activities, like increased land disturbance or changes in fertilizer application, or if more regional factors, including increases in atmospheric deposition, and changes in the timing and magnitude of water delivery, are contributing to the increases in phosphorus concentrations and loads.
Increases in total phosphorus concentrations and loads observed from 2000 to 2020 have resulted in conditions closer to or in exceedance of algal-specific phosphorus criteria (figs. 6, 7). Exceedances of the criteria are especially common in the North Fork White River. Concomitant decreases in nitrogen concentrations have led to changes in nutrient limitation, where the North Fork White River and to a smaller degree, the South Fork White River, are generally nitrogen limited during summer months. Algal assemblages are often comprised of many different species, each with different nitrogen and phosphorus requirements, and shifting nutrient limitation can change the dominant species present (Stevenson and others, 2012). Elevated phosphorus concentrations from either atmospheric deposition or soil weathering have been implicated in the shifts toward chlorophyte-dominated algal assemblages in Colorado alpine lakes (Oleksy and others, 2020). Studies on the Clark Fork and Madison Rivers in Montana (Dodds and others, 1997) found that filamentous algae blooms were nitrogen limited and that reductions in total phosphorus below saturation breakpoints can maintain benthic algal biomass at levels acceptable to humans for recreational purposes (Suplee and others, 2012). Nutrient reduction efforts on the Clark Fork River were mainly attributable to reductions from point sources including wastewater facility changes and a ban on phosphate laundry detergent (Suplee and others, 2012). Nutrient reductions from nonpoint sources can be more difficult to implement and there may be a lag between implementation of management practices and stream nutrient response (Sprague and Gronberg, 2012).
Site-Scale Resolution of Nutrient Occurrence
Nutrient concentrations and loads measured across an expanded spatial scale identified differences in nutrient conditions across 20 sites, including specific areas of concern for elevated algal growth and potential nutrient source areas. Comparing nutrient concentrations across sites is relevant from an algal perspective because algae are directly affected by concentrations of nutrients in the water. Phosphorus concentrations were close to or exceeded algal-specific criteria at sites on the North Fork White River and main stem White River during summer sampling (June–September), and the three most downstream sites had high nitrogen and phosphorus concentrations during either spring, summer, or the synoptic sampling (fig. 9B, D; fig. 10C, E). Algal biomass is controlled by a combination of resource and disturbance factors (Biggs, 1996), where resource availability, including nutrients and light, determines biomass gains by regulating growth rates, whereas disturbance factors, like high streamflow events, lead to biomass loss through physical removal. Thus, establishing causal relationships between nutrients and algal biomass may be complicated by the influence of other factors on algal biomass. A multivariate approach was used to identify the potential role of different drivers, including physical and chemical factors, on algal biomass in the upper White River Basin, including relationships between site-specific nutrient concentrations and algal biomass in Day and Henneberg (2023).
Identifying areas with greater nutrient loads and yields can help target nutrient reduction efforts. Results from a synoptic-style sampling identified the lower North Fork subbasin as having greater yields of phosphorus compared to other downstream subbasins. Large increases in phosphorus loads were observed below Marvine Creek, a major tributary draining a basin underlain by basalt (fig. 3). Basins with volcanic lithologies tend to yield waters with relatively high phosphorus concentration (Olson and Hawkins, 2013; Smith and others, 2019). Synoptic samples and samples collected during spring and summer of 2019 and 2020 also showed increases in total nitrogen, orthophosphate, and total phosphorus loads and concentrations occurring at sites below Coal Creek in the lower main stem subbasin. This area has a high density of irrigated lands (fig. 1) and is downstream from Coal Creek, a basin underlain by highly erodible Cretaceous marine shales (fig. 3). Disturbance to land surface can increase contributions of sediment and nutrients to the river (Kenney and others, 2009), especially from areas with nutrient-rich geologies (Knox, 2001). Other basin-specific factors, including development-related inputs (for example, septic systems or golf courses), fish feeding, stream channel configuration activities, pesticides, and agricultural ponds, could contribute to the high loads and yields from these areas, though insufficient data exist to make these correlations.
Data Gaps and Next Steps
Increases in nutrient sampling frequency at existing sites and targeted sampling during spring runoff and storm events could improve understanding of the causes behind upward trends in phosphorus concentrations across the basin. Further investigation into the potential influence of dust deposition and changes in phosphorus release from soils related to changing pH and temperatures may also help identify sources of phosphorus. Future examination of potential source areas identified during the synoptic sampling, including those in Marvine Creek and lower main stem subbasin, could include more frequent sampling and expanded investigation of geologic and land-use characteristics. Nutrient reduction strategies targeting a reduction in filamentous algae growth rely on an established understanding of the relation between nutrient concentrations and algal biomass, as well as source contributions (Suplee and others, 2012). Relations between nutrient concentrations and algal biomass are discussed more in Day and Henneberg (2023) as part of a broader discussion, including other abiotic factors like temperature and streamflow, that influence algal growth in the upper White River Basin. At a minimum, continued monitoring of algal biomass and nutrients will support increased understanding of their relationships in the upper White River Basin.
Summary
In 2016, the Colorado Parks and Wildlife (CPW) identified filamentous algae collected from the main stem White River as Cladophora glomerata, a pervasive nuisance aquatic alga. Excessive levels of filamentous algae can compromise aesthetic quality, limit recreational activities, and can have negative effects on aquatic life including strong fluctuations in dissolved oxygen levels and a reduction in overall biodiversity. To increase understanding of the biology of the upper White River Basin, identify potential factors promoting or limiting nuisance algal abundance, and outline information needs to aid in the understanding and protection of water resources, the U.S. Geological Survey (USGS), in cooperation with the White River and Douglas Creek Conservation Districts and the White River Algae Technical Advisory Group, initiated a study to collect and analyze physical, chemical, and biological information for the upper White River Basin. The upper White River Basin, as defined in this report, is the area of land drained by the White River from its headwaters in the Flat Tops, a mountain range in Garfield County, to near Meeker, Colorado. This report (1) assesses long-term changes in streamflow and nutrient concentrations and loads at sites in the water-quality monitoring program; (2) describes spatial variation in nutrient abundance from 20 sites across the basin; (3) identifies possible nutrient sources at a subset of sites through isotope sampling; (4) identifies subbasins with higher nutrient loads and yields through synoptic sampling; and (5) discusses how nutrient conditions, including concentrations and ratios of concentrations, compare to standard values related to algal growth.
An assessment of existing long-term data indicates that streamflow and nutrient conditions have become more favorable to benthic algae over varying timescales. At White River above Coal Creek, near Meeker, Colo., significant downward trends in streamflow were found in August and September for mean streamflow (15 and 14 percent per decade, respectively) and 7-day minimum streamflows (23 and 22 percent per decade, respectively). Significant downward trends in annual, 7-day minimum streamflows of 24 percent per decade, or 66 percent over the 40-year period of analysis, were also observed. Alteration of the annual hydrograph can influence factors that influence algae including nutrient input and dilution potential, water temperature, dissolved oxygen, light availability, and physical disturbance.
Seasonal patterns in inorganic nitrogen, total nitrogen, and total phosphorus concentrations were observed at the four long-term monitoring sites during the period 2000–20. The highest median concentrations of inorganic nitrogen, total nitrogen, and total phosphorus occurred during spring (April–May). Spring snowmelt and rainfall transport nutrients and some sediments that have accumulated on the land surface over the winter into waterbodies, creating increased nutrient concentrations during these months. Seasonal patterns in orthophosphate concentrations were less distinct.
Weighted-regression model results indicated overall declines in inorganic and total nitrogen concentrations from 2000 to 2020 at North Fork White River at Buford, Colo., and White River above Coal Creek, near Meeker, Colo. Steady decreases of inorganic nitrogen were observed from 2000 to around 2013, when concentrations appeared to stabilize, while total nitrogen concentrations continued to decline. Steady declines in inorganic nitrogen concentrations were also observed at South Fork White River at Buford, Colo., until around 2013, when a slight reversal in trends was observed; however, trend magnitude and direction of total nitrogen at this site are less certain. Annual estimated concentrations of total nitrogen were below the algal-specific nutrient criteria at all sites and reflecting trends discussed previously, trended away from the criteria over time.
Mirroring trends in concentrations, annual loads of inorganic nitrogen showed overall declines of a similar magnitude from 2000 to 2020 at North Fork White River at Burford, Colo., and White River above Coal Creek, near Meeker, Colo. Loads of inorganic nitrogen likely increased by 85 percent at South Fork White River at Buford, Colo., a larger increase than the respective change in concentration of 11 percent. As mean loads are the product of concentration and streamflow integrated over time, the days of the greatest streamflow can strongly influence load trends. Thus, larger changes in loads than in concentrations can indicate that much of the change is occurring during greater streamflow periods.
Upward trends in total phosphorus concentrations and loads were found at North Fork White River at Buford, Colo., South Fork White River, Colo., and White River above Coal Creek, near Meeker, Colo. The magnitude of trends in phosphorus loads were generally greater than trends in concentrations across all sites. Similar to nitrogen, the trends do not appear to be monotonic. Concentrations increased until 2011, then decreased or stayed the same after 2011. In the upper White River Basin, the spring 2011 snowmelt runoff was large compared to the proceeding and following water years, and it may have had a flushing effect for stored phosphorus in soil and floodplains. Annual estimated concentrations of total phosphorus were above the algal-specific nutrient criteria at North Fork White River at Buford, Colo., from 2005 to 2020, indicating that phosphorus concentrations at this site likely promote algal growth.
Total nitrogen to total phosphorus molar ratios (N:P) of discrete values were calculated from long-term data to provide context for how nutrient limitation may have changed during the 20-year trend period. In general, N:P ratios collected from July to September indicate movement from colimitation (10–22) to nitrogen limited (less than [<] 13) conditions at the North Fork White River at Buford, Colo., starting in 2012. Similar shifts from colimited and phosphorus limited conditions to more nitrogen limited conditions were observed at the South Fork White River at Buford, Colo., in discrete samples collected from July to September, though the degree of nitrogen limitation was less than that on the North Fork White River at Buford, Colo. Nutrient limitation tended to be more colimited at White River above Coal Creek, near Meeker, Colo.
To better assess spatial differences in nutrient conditions across the upper White River Basin, quarterly sampling at four sites in the long-term monitoring program was supplemented with spring (April–May) and summer (July–September) sampling at an additional 16 sites during 2019 and 2020. During spring sampling, mean concentrations of inorganic nitrogen were greater in the South Fork compared to the North Fork subbasin. Total nitrogen concentrations were greatest in the lower North Fork subbasin compared to the South Fork subbasin, though concentrations were more similar across subbasins than for inorganic nitrogen. Mean concentrations of orthophosphate and total phosphorus in the lower North Fork subbasin were nearly double those in the South Fork. Relative to other sites on the main stem, White River near Meeker, Colo., and White River above Curtis Creek near Meeker, Colo., had elevated concentrations of total nitrogen, orthophosphate, and total phosphorus during spring, predominately in 2019.
Nutrient concentrations were compared to algal-specific nutrient criteria during summer sampling only, as spring nutrient conditions do not necessarily represent conditions during algal growth. Total nitrogen concentrations were below benthic algae-specific criteria (0.30 milligrams per liter) during summer sampling in the North and South Forks, whereas concentrations approached or met the criteria on the main stem White River in 2020. Relative to total nitrogen, total phosphorus concentrations were much closer to the algae criteria and exceeded the criteria directly below the confluence of the North and South Forks at White River below Big Beaver Creek, Colo., and below the Coal Creek tributary at White River near Meeker, Colo. N:P ratios during summer sampling indicated nitrogen-limiting conditions (<13) in the North Fork subbasins, whereas the South Fork subbasin tended to indicate more phosphorous limiting conditions. The upper and lower main stem subbasins were more variable but remained mostly in the colimiting range of N:P ratios.
To evaluate sources of nitrogen in the upper White River Basin, the dual (δ15N and δ18O) isotopic composition of nitrogen and oxygen in nitrate were compared across four sites. The isotopic compositions of nitrate were all within the range typical of soil derived nitrate, the same values can also be derived from a mixture agricultural and manure or septic sources.
Results from a synoptic-style sampling identified the lower North Fork subbasin as a large source of phosphorus to the downstream system. Large increases in phosphorus loads were observed below Marvine Creek. Synoptic samples and samples collected during spring and summer of 2019 and 2020 also show large increases in total nitrogen, orthophosphate, and total phosphorus occurring around the farthest three downstream sites on the White River.
References Cited
Bardini, L, Boana, F., Cardenas, M.B., Revelli, R., and Ridolfi, L., 2012, Nutrient cycling in bedform induced hyporheic zones: Geochimica et Cosmochimica Acta, v. 84, p. 47–61, accessed September 2021, at https://doi.org/10.1016/j.gca.2012.01.025.
Biggs, B.J.F., 2000, Eutrophication of streams and rivers—dissolved nutrient-chlorophyll relationships for benthic algae: Journal of the North American Benthological Society, v. 19, p. 17–31, accessed June 2021, at https://doi.org/10.2307/1468279.
Chanat, J.G., Moyer, D.L., Blomquist, J.D., Hyer, K.E., and Langland, M.J., 2016, Application of a weighted regression model for reporting nutrient and sediment concentrations, fluxes, and trends in concentration and flux for the Chesapeake Bay Nontidal Water-Quality Monitoring Network, results through water year 2012: U.S. Geological Survey Scientific Investigations Report 2015–5133, 76 p., accessed June 2021, at https://doi.org/10.3133/sir20155133.
Chételat, J., Pick, F.R., Morin, A., and Hamilton, P.B., 1999, Periphyton biomass and community composition in rivers of different nutrient status: Canadian Journal of Fisheries and Aquatic Sciences, v. 56, no. 4, p. 560–569, accessed June 2021, at https://doi.org/10.1139/f98-197.
Clow, D.W., 2010, Changes in the timing of snowmelt and streamflow in Colorado—A response to recent warming: Journal of Climate, v. 23, no. 9, p. 2293–2306, accessed June 2021, at https://doi.org/10.1175/2009JCLI2951.1.
Colorado Decision Support Systems, 2020, Division 5 irrigated lands: Colorado’s Decision Support Systems website, accessed June 2021, at https://cdss.colorado.gov/gis-data/division-5-colorado.
Colorado Department of Public Health and Environment [CDPHE], 2017, Water Quality Control Commission, Regulation No. 31—The Basic Standards and Methodologies for Surface Water: Colorado Water Quality Control Commission, 230 p., accessed September 3, 2019, at https://www.sos.state.co.us/CCR/GenerateRulePdf.do?ruleVersionId=9874&fileName=5 CCR 1002-31.
Colorado Parks and Wildlife [CPW], 2017, White River algae report on 2016 data: Colorado Parks and Wildlife White River Algae Report, 22 p., accessed September 5, 2018, at https://wrcd-dccd.colorado.gov/sites/wrcd-dccd/files/documents/final_2016_white_river_report_1.pdf.
Colorado Water Conservation Board, 2016, White River Basin water resources planning model user’s manual: Colorado Water Conservation Board website, accessed November 2020, at https://dnrweblink.state.co.us/cwcb/0/doc/200076/Electronic.aspx?searchid=d8eca6f8-7cfe-4ddf-9788-5886fd932c8c.
Conant, R.T., Ryan, M.G., Ågren, G.I., Birge, H.E., Davidson, E.A., Eliasson, P.E., Evans, S.E., Frey, S.D., Giardina, C.P., Hopkins, F.M., Hyvonen, R., Kirschbaum, M.U.F., Lavalee, J.M., Leifeld, J., Parton, W.J., Steinweg, J.M., Wallenstein, M.D., Wetterstedt, J.A.M., and Bradford, M.A., 2011, Temperature and soil organic matter decomposition rates - synthesis of current knowledge and a way forward: Global Change Biology, v. 17, p. 3392–3404, accessed September 2021, at https://doi.org/10.1111/j.1365-2486.2011.02496.x.
Coplen, T.B., Qi, H., Révész, K., Casciotti, K., and Hannon, J.E., 2007, Determination of the δ15N and δ18O of nitrate in water; RSIL lab code 2900 in Révész, K., and Coplen, T.B., eds., Methods of the Reston Stable Isotope Laboratory (ver. 1.1, September 2012): U.S. Geological Survey Techniques and Methods, book 10, chap. C17, 35 p., accessed September 2021, at https://doi.org/10.3133/tm10C17.
Corman, J.R., Bertolet, B.L., Casson, N.J, Sebestyen, S.D., Kolka, R.K., and Stanley, E.H., 2018, Nitrogen and Phosphorus Loads to Temperate Seepage Lakes Associated With Allochthonous Dissolved Organic Carbon Loads: Geophysical Research Letters, v. 45, no. 11, p. 5481–5490, accessed September 2021, at https://doi.org/10.1029/2018GL077219.
Day, N.K., 2021, Input and output data from streamflow and water-quality regression models used to characterize streamflow and water-quality conditions in the Upper Yampa River Basin, Colorado, from 1992 to 2018: U.S. Geological Survey data release, accessed August 2021, at https://doi.org/10.5066/P9L7S3NQ.
Day, N.K., and Henneberg, M.F., 2023, Investigation of potential factors controlling benthic algae in the upper White River Basin, Colorado, 2018–21: U.S. Geological Survey Scientific Investigations Report 2023-5009, 30 p., https://doi.org/10.3133/sir20235009.
Day, N.K., Gidley, R.G., and Henneberg, M.F., 2023, Channel characteristics and benthic algae data and input and ouput data from streamflow and water-quality regression models for selected sites in the upper White River Basin, Colorado, 2018–21: U.S. Geological Survey data release, https://doi.org/10.5066/P9E82RMQ.
Dodds, W.K., 1991, Factors associated with dominance of the filamentous green alga Cladophora glomerata: Water Research, v. 25, no. 11, p. 1325–1332, accessed July 2021, at https://doi.org/10.1016/0043-1354(91)90110-C.
Dodds, W.K., 2003, Misuse of inorganic N and soluble reactive P concentrations to indicate nutrient status of surface waters: Journal of the North American Benthological Society, v. 22, no. 2, p. 171–181, accessed July 2021, at https://doi.org/10.2307/1467990.
Dodds, W.K., and Gudder, D.A., 1992, The ecology of Cladophora: Journal of Phycology, v. 28, no. 4, p. 415–427, accessed April 2022, at https://doi.org/10.1111/j.0022-3646.1992.00415.x.
Dodds, W.K., and Welch, E.B., 2000, Establishing nutrient criteria in streams: Journal of the North American Benthological Society, v. 19, no. 1, p. 186–196, accessed January 2020, at https://doi.org/10.2307/1468291.
Dodds, W.K., Smith, V.H., and Zander, B., 1997, Developing nutrient targets to control benthic chlorophyll levels in streams—A case study of the Clark Fork River: Water Research, v. 31, no. 7, p. 1738–1750, accessed June 2021, at https://doi.org/10.1016/S0043-1354(96)00389-2.
Dodds, W.K., Smith, V.H., and Lohman, K., 2002, Nitrogen and phosphorus relationships to benthic algal biomass in temperate streams: Canadian Journal of Fisheries and Aquatic Sciences, v. 59, no. 5, p. 865–874, accessed January 2020, at https://doi.org/10.1139/f02-063.
Fishman, M.J., 1993, Methods of analysis by the U.S. Geological Survey National Water Quality Laboratory-Determination of inorganic and organic constituents in water and fluvial sediments: U.S. Geological Survey Open-File Report 93–125, 217 p., accessed June 2021, at https://doi.org/10.3133/ofr93125.
Foreman, W.T., Williams, T.L., Furlong, E.T., Hemmerle, D.M., Stetson, S.K., Noriega, M.C., Jha, V.K., Decess, J.A., Reed-Parker, C., and Sandstrom, M.W., 2021, Comparison of detection limits estimated using single- and multi-concentration spike-based and blank-based procedures: Talanta, v. 228, p. 122139, accessed February 2021, at https://doi.org/10.1016/j.talanta.2021.122139.
Frankson, R., Kunkel, K., Stevens, L., and Easterling, D., 2017, Colorado State Climate Summary 2022: NOAA Technical Report NESDIS 150-CO, 5 p., accessed June 10, 2021, at https://statesummaries.ncics.org/chapter/co/.
Grimm, N.B. and Fisher, S.G., 1989, Stability of periphyton and macroinvertebrates to disturbance by flash floods in a desert stream: Journal of North American Benthological Society, v. 8, no. 4, p. 293–307, accessed October 2021, at https://doi.org/10.2307/1467493.
Grobler, D.C., and Silberbauer, M.J., 1985, The combined effect of geology, phosphate sources and runoff on phosphate export from drainage basins: Water Research, v. 19, no. 8, p. 975–981, accessed March 2022, at https://doi.org/10.1016/0043-1354(85)90365-3.
Hem, J.D., 1985, Study and interpretation of the chemical characteristics of natural water, 3d. ed.: U.S. Geological Survey Water-Supply Paper 2254, accessed February 2020, at https://doi.org/10.3133/wsp2254.
High Plains Regional Climate Center, 2020, Monthly Summarized Data: Lincoln, Nebr., High Plains Regional Climate Center web page, accessed January 2021, at http://climod.unl.edu/.
Hillebrand, H. and Sommer, U., 1999, The nutrient stoichiometry of benthic microalgal growth—Redfield proportions are optimal: Limnology and Oceanography, v. 44, no. 2, p. 440–446, accessed June 2021, at https://doi.org/10.4319/lo.1999.44.2.0440.
Hirsch, R.M., 1979, An evaluation of some record reconstruction techniques: Water Resources Research, v. 15, no. 6, p. 1781–1790, accessed July 2021, at https://doi.org/10.1029/WR015i006p01781.
Hirsch, R.M., 2011, A perspective on nonstationary and water management: Journal of the American Water Resources Association, v. 47, no. 3, p. 436–446, https://doi.org/10.1111/j.1752-1688.2011.00539.x.
Hirsch, R.M., and De Cicco, L.A., 2015, User guide to Exploration and Graphics for RivEr Trends (EGRET) and dataRetrieval—R packages for hydrologic data (version 2.0, February 2015): U.S. Geological Survey Techniques and Methods, book 4, chapter A10, 93 p., accessed January 1, 2018, at https://doi.org/10.3133/tm4A10.
Hirsch, R.M., Archfield, S.A., and De Cicco, L.A., 2015, A bootstrap method for estimating uncertainty of water quality trends: Environmental Modelling & Software, v. 73, p. 148–166, accessed April 2021, at https://doi.org/10.1016/j.envsoft.2015.07.017.
HydroSolutions, 2017, Upper White River watershed assessment: Elk Creek Ranch, Meeker, Colo., prepared by HydroSolutions, Helena, Mont., 175 p., accessed September 20, 2018, at https://wrcd-dccd.colorado.gov/sites/wrcd-dccd/files/documents/UpperWhiteRiverWatershedAssessment_20171121.pdf.
Jordan, T.E., Correl, D.L., and Weller, D.E., 1997, Relating nutrient discharges from watersheds to land use and streamflow variability: Water Resources Research, v. 33, p. 2579–2590, accessed May 2021, at https://doi.org/10.1029/97WR02005.
Kendall, C., 1998, Tracing nitrogen sources and cycling in catchments, chap. 16 of Kendall, C., and McDonnell, J.J., eds., Isotope Tracers in Catchment Hydrology: Elsevier, p. 519–576, accessed June 2021, at https://doi.org/10.1016/B978-0-444-81546-0.50023-9.
Kenney, T.A., Gerner, S.J., Buto, S.G., and Spangler, L.E., 2009, Spatially referenced statistical assessment of dissolved-solids load sources and transport in streams of the Upper Colorado River Basin: U.S. Geological Survey Scientific Investigations Report 2009-5007, 50 p., accessed January 2021, at https://doi.org/10.3133/sir20095007.
Knox, J.C., 2001, Agricultural influences on landscape sensitivity in the Upper Mississippi River Valley: CATENA, v. 42, no. 2–4, p. 193–224, accessed February 2021, at https://doi.org/10.1016/S0341-8162(00)00138-7.
Kohn, M.S., Oden, J.H., and Arnold, L.R., 2019, Water-budget analysis of the Upper Big Sandy Designated Groundwater Basin alluvial aquifer, Elbert, El Paso, and Lincoln Counties, Colorado, 2016: U.S. Geological Survey Scientific Investigations Report 2019-5049, 25 p., accessed March 2021, at https://doi.org/10.3133/sir20195049.
Lopez, C.B., Jewett, E.B., Dortch, Q., Walton, B.T., and Hudnell, H.K., 2008, Scientific assessment of freshwater harmful algal blooms: Washington, D.C., Joint Subcommittee on Ocean Science and Technology, Interagency Working Group on Harmful Algal Blooms, Hypoxia and Human Health, 65 p., accessed June 2020, at https://www.whoi.edu/fileserver.do?id=41023&pt=10&p=19132.
Mast, M.A., Clow, D.W., Baron, J.S., and Wetherbee, G.A., 2014, Links between N deposition and nitrate export from a high-elevation watershed in the Colorado Front Range, Environmental Science and Technology, v. 48, p. 14258–14265, accessed March 1, 2022, at https://doi.org/10.1021/es502461k.
Mikkelson, K.M., Bearup, L.A., Maxwell, R.M., Stednick, J.D., McCray, J.E., and Sharp, J.O., 2013, Bark beetle infestation impacts on nutrient cycling, water quality and interdependent hydrological effects: Biogeochemistry, v. 115, p. 1–21, accessed April 2022, at https://doi.org/10.1007/s10533-013-9875-8.
Miller, W.P., and Piechota, T.C., 2008, Regional analysis of trend and step changes observed in hydroclimatic variables around the Colorado River basin: Journal of Hydrometeorology, v. 9, no. 5, p. 1020–1034, accessed April 2021, at https://doi.org/10.1175/2008JHM988.1.
Monteith, D.T., Stoddard, J.L., Evans, C.D., de Wit, H.A., Forsious, M., Hogasen, T., Wilander, A., Skelkvale, B.L., Jeffries, D.S., Vuorenmaa, J., Keller, B., Kopacek, J., and Vesely, J., 2007, Dissolved organic carbon trends resulting from changes in atmospheric deposition chemistry: Nature, v. 450, p. 537–540, accessed January 2022, at https://doi.org/10.1038/nature06316.
Mosley, L.M., 2015, Drought impacts on the water quality of freshwater systems—Review and integration: Earth-Science Reviews, v. 140, p. 203–214, accessed January 2021, at https://doi.org/10.1016/j.earscirev.2014.11.010.
Mueller, D.K., Hamilton, P.A., Helsel, D.R., Hitt, K.J., and Ruddy, B.C., 1995, Nutrients in ground water and surface water of the United States; an analysis of data through 1992: U.S. Geological Survey Water-Resources Investigations Report 95-4031, 74 p., accessed March 2021, at https://doi.org/10.3133/wri954031.
Mueller, D.K., Schertz, T.L., Martin, J.D., and Sandstrom, M.W., 2015, Design, analysis, and interpretation of field quality-control data for water-sampling projects: U.S. Geological Survey Techniques and Methods, book 4, chap. C4, 54 p., accessed Jan 20, 2020, at https://doi.org/10.3133/tm4C4.
Murphy, J., and Sprague, L., 2019, Water-quality trends in US rivers—Exploring effects from streamflow trends and changes in watershed management: Science of the Total Environment, v. 656, p. 645–658, accessed March 2021, at https://doi.org/10.1016/j.scitotenv.2018.11.255.
Natural Resources Conservation Service, 2021, Report Generator 2.0: U.S. Department of Agriculture National Water and Climate Center website, accessed September 2021, at https://wcc.sc.egov.usda.gov/reportGenerator/.
Novak, C.E., 1985, WRD data reports preparation guide: U.S. Geological Survey Open-File Report 85-480, 331 p. [Also available at https://doi.org/10.3133/ofr85480.]
Oleksy, I.A., Baron, J.S., Leavitt, P.R., and Spaulding, S.A., 2020, Nutrients and warming interact to force mountain lakes to unprecedented ecological states: Proceedings of the Royal Society B—Biological Sciences, v. 287, accessed April 2021, at https://doi.org/10.1098/rspb.2020.0304.
Oleksy, I.A., Baron, J.S., and Beck, W.S., 2021, Nutrients and warming alter mountain lake benthic algal structure and function: Freshwater Science, v. 40, no. 1, accessed March 2021, at https://doi.org/10.1086/713068.
Olson, J.R., and Hawkins, C.P., 2013, Developing site-specific nutrient criteria from empirical models: Freshwater Science, v. 32, no. 3, p. 719–740, accessed June 2021, at https://doi.org/10.1899/12-113.1
Patton, C.J., and Truitt, E.P., 2000, Methods of analysis by the U.S. Geological Survey National Water Quality Laboratory-Determination of ammonium plus organic nitrogen by a Kjeldahl digestion method and an automated photometric finish that includes digest cleanup by gas diffusion: U.S. Geological Survey Open-File Report 2000-170, 31 p., accessed June 2021, at https://doi.org/10.3133/ofr00170.
Patton, C.J., and Kryskall, J.R., 2011, Colorimetric determination of nitrate plus nitrite in water by enzymatic reduction, automated discrete analyzer methods: U.S. Geological Survey Techniques and Methods, book 5, chap. B8, 34 p., accessed September 2021, at https://doi.org/10.3133/tm5B8.
Power, M.E. and Stewart, A.J., 1987, Disturbance and recovery of an algal assemblage following flooding in an Oklahoma stream: The American Midland Naturalist, v. 117, no. 2, p. 333–345, accessed August 2021, at https://doi.org/10.2307/2425975.
R Core Team, 2021, R—A language and environment for statistical computing, ver. 3.6.1: R Foundation for Statistical Computing website, accessed April 2021, at https://www.R-project.org/.
Rolls, R.J., Leigh, C., and Sheldon, F., 2012, Mechanistic effects of low-flow hydrology on riverine ecosystems—ecological principles and consequences of alteration: Freshwater Science, v. 31, no. 4, p. 1163–1186, accessed April 2021, at https://doi.org/10.1899/12-002.1.
Skibo, A.Z., 2018, White River headwaters algae dataset evaluation, 2016: Amaruq Environmental Services Report-AES-2017-0003. [Also available at https://wrcd-dccd.colorado.gov/sites/wrcd-dccd/files/documents/white_river_headwaters_algae_dataset_evaluation-2016_amaruqes_1.pdf.]
Smakhtin, V.U., 2001, Low flow hydrology—a review: Journal of Hydrology, v. 240, no. 3–4, p. 147–186, accessed April 2021, at https://doi.org/10.1016/S0022-1694(00)00340-1.
Smith, H.G., Sheridan, G.J., Lane, P.N.J., Nyman, P., and Haydon, S., 2011, Wildfire effects on water quality in forest catchments—A review with implications for water supply: Journal of Hydrology, v. 396, nos. 1–2, p. 170–192, accessed January 2022, at https://doi.org/10.1016/j.jhydrol.2010.10.043.
Smith, D.B., Solano, F., Woodruff, L.G., Cannon, W.F., and Ellefsen, K.J., 2019, Geochemical and mineralogical maps, with interpretation, for soils of the conterminous United States: U.S. Geological Survey Scientific Investigations Report 2017-5118, accessed February 2021, at https://doi.org/10.3133/sir20175118.
Sprague, L.A., and Gronberg, J.M., 2012, Relating management practices and nutrient export in agricultural watersheds of the United States: Journal of Environmental Quality, v. 41, no. 6, p. 1939–1950, accessed June 2021, at https://doi.org/10.2134/jeq2012.0073.
Stackpoole, S.M., Stets, E.G., and Sprague, L.A., 2019, Variable impacts of contemporary versus legacy agricultural phosphorus on US river water quality: PNAS, v. 116, no. 41, p. 20562–20567, accessed August 2021, at https://doi.org/10.1073/pnas.1903226116.
Stets, E.G., Sprague, L.A., Oelsner, G.P., Johnson, H.M., Murphy, J.C., Ryberg, K., Vecchia, A.V., Zuellig, R.E., Falcone, J.A., and Riskin, M.L., 2020, Landscape drivers of dynamic change in water quality of US rivers: Environmental Science & Technology. v. 54, no. 7, p. 4336–4343, accessed August 2021, at https://doi.org/10.1021/acs.est.9b05344.
Stevenson, R.J., Bennett, B.J., Jordan, D.N., and French, R.D., 2012, Phosphorus regulates stream injury by filamentous green algae, DO, and pH with thresholds in responses: Hydrobiologia, v. 695, p. 25–42, accessed August 2021, at https://doi.org/10.1007/s10750-012-1118-9.
Stoddard, J.L., Van Sickle, J., Herlihy, A.T., Brahney, J., Paulsen, S., Peck, D.V., Mitchell, R., and Pollard, A.I., 2016, Continental-scale increase in lake and stream phosphorus—Are oligotrophic systems disappearing in the United States?: Environmental Science and Technology, v. 50, no. 7, p. 3409–3415, accessed September 2021, at https://doi.org/10.1021/acs.est.5b05950.
Suplee, M.W., and Watson, V., 2013, Scientific and technical basis of the numeric nutrient criteria for Montana’s wadeable streams and rivers: Montana Department of Environmental Quality website, accessed April 2020, at https://deq.mt.gov/files/water/wqpb/standards/pdf/sciencetech2013fnlcom.pdf.
Suplee, M.W., Watson, V., Dodds, W.K., and Shirley, C., 2012, Response of algal biomass to large‐scale nutrient controls in the Clark Fork River, Montana, United States: Journal of the American Water Resources Association, v. 48, no. 5, p. 1008–1021, accessed September 2021, at https://doi.org/10.1111/j.1752-1688.2012.00666.x.
Tobin, R.L., 1993, Sediment transport and water-quality characteristics and loads, White River, Northwestern Colorado, water years 1975-88: U.S. Geological Survey Water-Resources Investigations Report 92-4031, accessed August 2018, at https://doi.org/10.3133/wri924031.
Turnipseed, D.P., and Sauer, V.B., 2010, Discharge measurements at gaging sites: U.S. Geological Survey Techniques and Methods book 3, chap. A8, 87 p., accessed March 4, 2020, at https://doi.org/10.3133/tm3A8.
Tweto, O., 1979, MI-16 geologic map of Colorado: Denver, Colo., Colorado Geological Survey, Department of Natural Resources, 1 plate, scale 1:500,000, accessed August 2020, at https://coloradogeologicalsurvey.org/publications/tweto-geologic-map-colorado-1979/.
Udall, B., and Bates., G., 2007, Climatic and hydrologic trends in the western U.S.—A Review of recent peer-reviewed research: Western Water Assessment website, accessed June 2021, at https://wwa.colorado.edu/sites/default/files/2021-09/IWCS_2007_Jan_feature.pdf.
Udall, B., and Overpeck, J., 2017, The twenty-first century Colorado River hot drought and implications for the future: Water Resources Research, v. 53, no. 3, p. 2404–2418. [Also available at https://doi.org/10.1002/2016WR019638.]
Ulén, B.Bechmann, M., Folster, J., Jarvie, H.P., Tunney, H., 2007, Agriculture as a phosphorus source for eutrophication in the north-west European countries, Norway, Sweden, United Kingdom and Ireland—a review: Soil Use and Management, v. 23, p. 5–15. [Also available at https://doi.org/10.1111/j.1475-2743.2007.00115.x.]
Urquhart, J., 2012, Trappers Lake - 10 years after the fire: The Aspen Times, September 7, 2012, accessed August 2021, at https://www.aspentimes.com/news/trappers-lake-10-years-after-the-fire/.
U.S. Geological Survey [USGS], 2000, Data from: National Water-Quality Assessment (NAWQA) Program of the United States Geological Survey: Summary of nutrient concentrations from streams and ground water, accessed June 1, 2021, at https://water.usgs.gov/nawqa/nutrients/datasets/nutconc2000/.
U.S. Geological Survey [USGS], 2020, Inorganic blind sample project (BSP): U.S. Geological Survey Quality Systems Branch website, accessed June 2021, at https://bqs.usgs.gov/ibsp/.
U.S. Geological Survey [USGS], 2021, USGS water data for the Nation: U.S. Geological Survey National Water Information System database, accessed March 20, 2021, at https://doi.org/10.5066/F7P55KJN.
U.S. Geological Survey [USGS], [variously dated], National field manual for the collection of water-quality data: U.S. Geological Survey Techniques of Water-Resources Investigations, book 9, chaps. A1–A9, accessed June 15, 2018, at https://doi.org/10.3133/twri09.
Vadeboncoeur, Y., Moore, M.V., Stewart, S.D., Chandra, S., Atkins, K.S., Baron, J.S., Bouma-Gregson, K., Brothers, S., Francoer, S.N., Genzoli, L., Higgins, S.N., Hilt, S., Katona, L.R., Kelly, D., Oleksy, I.A., Ozersky, T., Power, M.E., Roberts, D., Smits, A.P., Timoshkin, O., Tromboni, F., Vander Zanden, M.J., Volkova, E.A., Waters, S., Wood, S.A., and Yamamuro, M., 2021, Blue waters, green bottoms—Benthic filamentous algal blooms are and emerging threat to clear lakes worldwide: BioScience, v. 71, no. 10, p. 1011–1027, accessed July 2022, at https://doi.org/10.1093/biosci/biab049.
Wheeler, K., Kuhn, E., Bruckerhoff, L., Udall, B., Wang, J., Gilbert, L., Goeking, S., Kasprak, A., Mihalevich, B., Neilson, B., Salehabadi, H., and Schmidt, J., 2021, Alternative management paradigms for the future of the Colorado and Green Rivers: Center for Colorado River Studies, Utah State University, white paper no. 6, accessed September 2021, at https://qcnr.usu.edu/files/news/alternative-management-paradigms-colorado-river.pdf.
Williams, C.A., and Leib, K.J., 2005, Using tracers to evaluate streamflow gain-loss characteristics of Terror Creek, in the vicinity of a mine-permit area, Delta County, Colorado, water year 2003: U.S. Geological Survey Scientific Investigations Report 2005-5018, 27 p., accessed June 2021, at https://doi.org/10.3133/sir20055018.
Xue, D., Botte, J., De Baets, B., Accoe, F., Nestler, A., Taylor, P., Van Cleemput, O., Berglund, M., and Boeckx, P., 2009, Present limitations and future prospects of stable isotope methods for nitrate source identification in surface- and groundwater: Water Research, v. 43, no. 5, p. 1159–1170, accessed June 2021, at https://doi.org/10.1016/j.watres.2008.12.048.
Conversion Factors
U.S. customary units to International System of Units
Temperature in degrees Celsius (°C) may be converted to degrees Fahrenheit (°F) as follows: °F = (1.8 × °C) + 32.
Datum
Vertical coordinate information is referenced to the North American Vertical Datum of 1988.
Horizontal coordinate information is referenced to the North American Datum of 1983.
Elevation, as used in this report, refers to distance above the vertical datum.
Supplemental Information
Concentrations of chemical constituents in water are given in milligrams per liter (mg/L).
Streamflow is given in cubic feet per second (ft3/s).
“Water year” is the 12-month period from October 1 through September 30. The water year is designated by the year in which it ends.
Abbreviations
CDPHE
Colorado Department of Public Health and Environment
CO
Colorado, in USGS site names
CPW
Colorado Parks and Wildlife
MOVE.2
Maintenance of Variance Extension Type 2
NWIS
National Water Information System
R2
coefficient of determination
N:P
total nitrogen to total phosphorus molar ratio
USGS
U.S. Geological Survey
WRTDS
Weighted Regressions on Time, Discharge, and Season
WY
water year
<
less than
>
greater than
≤
less than or equal to
≥
greater than or equal to
Suggested Citation
Day, N.K., 2023, Characterization of streamflow and nutrient occurrence in the upper White River Basin, Colorado, 1980–2020: U.S. Geological Survey Scientific Investigations Report 2022–5112, 37 p., https://doi.org/10.3133/sir20225112.
ISSN: 2328-0328 (online)
Study Area
| Publication type | Report |
|---|---|
| Publication Subtype | USGS Numbered Series |
| Title | Characterization of streamflow and nutrient occurrence in the upper White River Basin, Colorado, 1980–2020 |
| Series title | Scientific Investigations Report |
| Series number | 2022-5112 |
| DOI | 10.3133/sir20225112 |
| Year Published | 2023 |
| Language | English |
| Publisher | U.S. Geological Survey |
| Publisher location | Reston, VA |
| Contributing office(s) | Colorado Water Science Center, Southwest Biological Science Center |
| Description | Report: vi, 37 p.; Data Release: 2 |
| Country | United States |
| State | Colorado |
| Other Geospatial | Upper White River Basin |
| Online Only (Y/N) | Y |
| Google Analytic Metrics | Metrics page |