

Survey of Fish Communities in Tributaries to the Mohawk River, New York, 2019
Links
- Document: Report (5.87 MB pdf) , HTML , XML
- Data Release: USGS data release - Fish community and substrate data from tributaries to the Mohawk River
- Download citation as: RIS | Dublin Core
Acknowledgments
This research was funded in part by the Mohawk River Basin Program of the New York State Department of Environmental Conservation. The authors extend their appreciation to Scott Wells and other colleagues with the region 4 fisheries unit of the New York State Department of Environmental Conservation, Andrea Conine of the Mohawk River Basin Program of the New York State Department of Environmental Conservation, Jeremy Wright and Bryan Weatherwax of the New York State Museum Ichthyology Laboratory, staff from the Capital Region Partnership for Regional Invasive Species Management, and Michael deMoulpied, Raymond Nellis, Kyle Olivencia, and Yvonne Baevsky of the U.S. Geological Survey for their contributions to the field work and data analysis of this project.
Abstract
Fish communities of the Mohawk River and associated sections of the New York State Canal System have been well documented but little information is available regarding the status of fish communities in the extensive network of tributaries that feed the Mohawk River. This lack of information is problematic because changes in species distributions or general ecosystem health may go unnoticed in the absence of baseline data. The need for baseline information has been made particularly urgent by the recent establishment of a high-profile invasive fish species in the mainstem of the Mohawk River, the round goby (Neogobius melanostomus). Round goby can adversely affect aquatic ecosystems in numerous ways and are able to colonize streams in addition to large rivers and lakes. This potential threat to the aquatic ecosystem, therefore, has created an urgent need to quantify the distribution and abundance of fish species inhabiting tributaries to the Mohawk River before round goby can begin colonizing these habitats. In response, the U.S. Geological Survey and the Mohawk River Basin Program of the New York State Department of Environmental Conservation initiated a study in 2019 to collect quantitative information on fish communities and stream habitats in tributaries to the Mohawk River that could be used in the future to determine the effects of round goby on local fish assemblages and identify substrate and other habitat characteristics that facilitate or inhibit colonization by round goby.
Fish communities were surveyed at 20 sites on tributaries to the Mohawk River during summer 2019, using three-pass depletion backpack electrofishing surveys. The resulting data were used to produce quantitative estimates of fish population density and biomass for all species at each site. A total of 11,794 individual fish and 37 species were captured during the 20 surveys. Longnose dace (Rhinichthys cataractae), white sucker (Catostomus commersonii), blacknose dace (Rhinichthys atratulus), fantail darter (Etheostoma flabellare), and creek chub (Semotilus atromaculatus) were the most frequently encountered species, occurring at 18, 18, 17, 17, and 16 of the 20 sites, respectively. Six darter species, small bottom-dwelling fish that are highly vulnerable to displacement by round goby, were captured during the surveys, and at least one darter species was captured at all but one of the sites. Round goby were only captured at one site, Ninemile Creek near Rome, New York, where they occurred at a low density. Overall, the results indicated that round goby had not extensively colonized tributaries to the Mohawk River as of 2019, and the suite of data collected in this project should serve as a valuable baseline for future assessments of the effects of round goby and other stressors on aquatic ecosystems.
Introduction
The Mohawk River is approximately 257 kilometers (km) long (McBride, 1994) and flows south from its headwaters near Boonville, New York, to Rome, where it turns and flows eastward, joining the Hudson River just north of Albany. The Mohawk River and New York State Canal System run together as a series of permanent and seasonal impoundments for most of the distance between Rome and Albany. Fish communities of the Mohawk River and associated sections of the New York State Canal System have been well documented (McBride, 1994, 2009; Carlson, 2015; George and others, 2016), but until 2019, comparatively less information was available regarding the status of fish communities in the extensive network of tributaries that feed the Mohawk River. This information gap was problematic because long-term shifts in species distributions or abundances from climate change or other anthropogenic stressors may go unnoticed in the absence of baseline data. In recognition of this, the 2012–16 Mohawk River Basin Action Agenda identified “expanding the river-wide fisheries survey to the tributaries” as a research priority for the watershed (New York State Department of Environmental Conservation, 2012).
The lack of information on the status of fish communities in tributaries to the Mohawk River has been made increasingly urgent by the approach of a high-profile invasive fish species, the round goby (Neogobius melanostomus). The species was first documented in North America in the 1990s in the Great Lakes region and was identified in the New York State Canal System near Utica in 2014 (U.S. Geological Survey, 2021a). Introductions of round goby have had profound effects on fish communities in the Great Lakes and other areas (Kornis and others, 2012). Round goby can outcompete native benthic fish species, reduce the recruitment of desirable gamefish through egg predation, and increase biomagnification of contaminants to higher trophic levels (Corkum and others, 2004). They can also carry the viral hemorrhagic septicemia virus (VHSV), which has been linked to significant fish kills in parts of New York (Farrell and others, 2017; Getchell and others, 2019), and some evidence indicates round goby are an important vector in avian botulism outbreaks (Ruffing, 2004; Hannett and others, 2011). Round goby are also an abundant food source for predators, however, and their establishment has been linked to increased health and growth rate of smallmouth bass (Micropterus dolomieu; Steinhart and others, 2004; Crane and others, 2015; Crane and Einhouse, 2016).
The effects of round goby on ecosystems in small and medium sized streams have not been investigated as thoroughly, and the overall effect of the species in lotic habitats remains poorly understood (Šlapanský and others, 2017). A number of studies have identified the theoretical potential for adverse effects on native fish assemblages through studies of diet overlap or other criteria (Poos and others, 2010; Abbett and others, 2013; Firth and others, 2021), yet few studies have attempted to directly quantify the ecological effects of round goby in streams. There is some circumstantial evidence indicating that round goby have displaced native benthic fish or altered the composition of macroinvertebrate communities (Krakowiak and Pennuto, 2008; Abbett and others, 2013; Raab and others, 2018), but a larger subset of research has shown subtle or negligible effects of round goby in lotic habitats (Kornis and others, 2013; Janáč and others, 2016; Šlapanský and others, 2017; Krabbenhoft, 2019). The relative abundance of round goby in streams appears highly variable, with estimates ranging from less than 10 percent to as high as approximately 80 percent of the entire fish community (Phillips and others, 2003; Krakowiak and Pennuto, 2008; Kornis and others, 2013). There is also mounting evidence that in some systems round goby exhibit seasonal migrations in and out of stream habitats (Pennuto and others, 2010; Blair and others, 2019), potentially further complicating efforts to assess population abundance and ecological effects. Thus, the high degree of uncertainty surrounding the effects of round goby in stream habitats, recent establishment of round goby in the Mohawk River watershed, and the lack of information on fish communities in streams of this region have created an urgent need to quantify the distribution and abundance of fishes in tributaries to the Mohawk River so that the effects of round goby invasion can be assessed and understood.
In response, the U.S. Geological Survey (USGS) and the New York State Department of Environmental Conservation, through its Mohawk River Basin Program, initiated a study in 2019 to characterize fish communities in tributaries to the Mohawk River. The objective of this study was to collect quantitative baseline information on fish communities and stream habitats, which could be used in the future to determine the effects of round goby on local fish assemblages, identify substrate and other habitat characteristics that facilitate or inhibit colonization by round goby, and evaluate the effects of other stressors or changes in watershed management. Obtaining information on the current distribution and abundance of darter species (Percidae: Etheostomatinae) was of particular interest. Darters are small bottom-dwelling fish (fig. 1) that have been shown to be highly vulnerable to displacement by round goby (Lauer and others, 2004; Kornis and others, 2012).
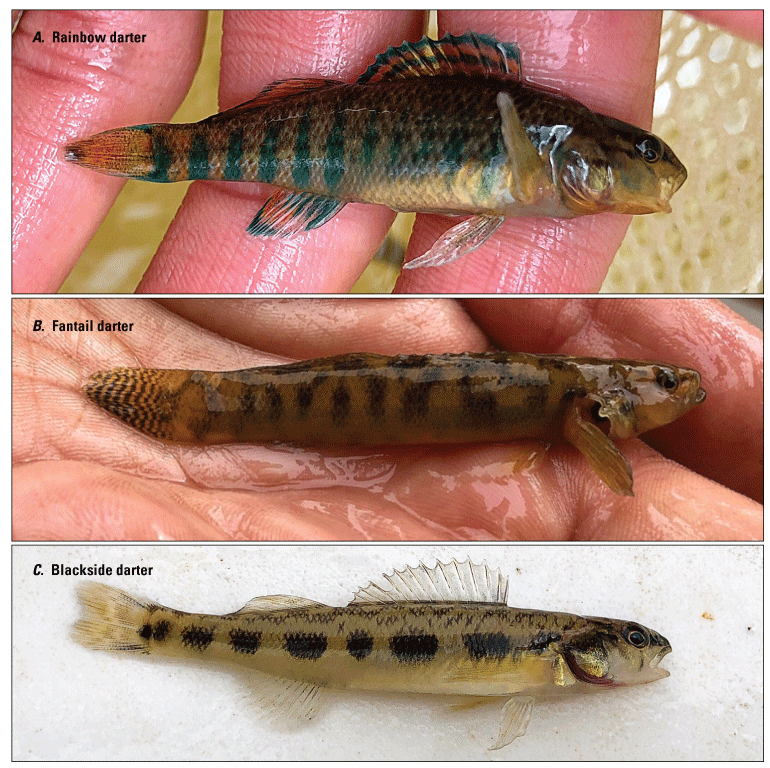
Examples of three darter species commonly encountered on tributaries to the Mohawk River: A, rainbow darter (Etheostoma caeruleum), B, fantail darter (Etheostoma flabellare), and C, blackside darter (Percina maculata); photographs by Kyle Olivencia, U.S. Geological Survey.
Equipment and Methods
Fish communities were surveyed at 19 tributaries to the Mohawk River between June and August 2019 (fig. 2; table 1). A single study reach was sampled on each tributary, with the exception of the Schoharie Creek where, because of its large size, two separate study reaches were sampled, for a total of 20 study reaches. Reaches ranged from 33 to 79 meters (m) in length and typically contained one or two complete geomorphic channel-unit sequences (Simonson and others, 1994; Fitzpatrick and others, 1998; Meador and others, 2003). Reaches were usually downstream from any major barriers and within the downstream-most 5 km of each stream (table 1) in order to collect data from areas that were at high risk for round goby colonization. The entire stream width was sampled during all surveys, with the exception of Cayadutta Creek, Ninemile Creek, West Canada Creek, and the two reaches on Schoharie Creek where the channel width and stream discharge were prohibitively large. At the Cayadutta Creek, Ninemile Creek, Schoharie Creek near Wellsville, and West Canada Creek sites, a braided section of the channel was surveyed in which the entire width could be sampled, and at the Schoharie Creek at Burtonsville site, a single near-shore reach was isolated using three blocking seines.
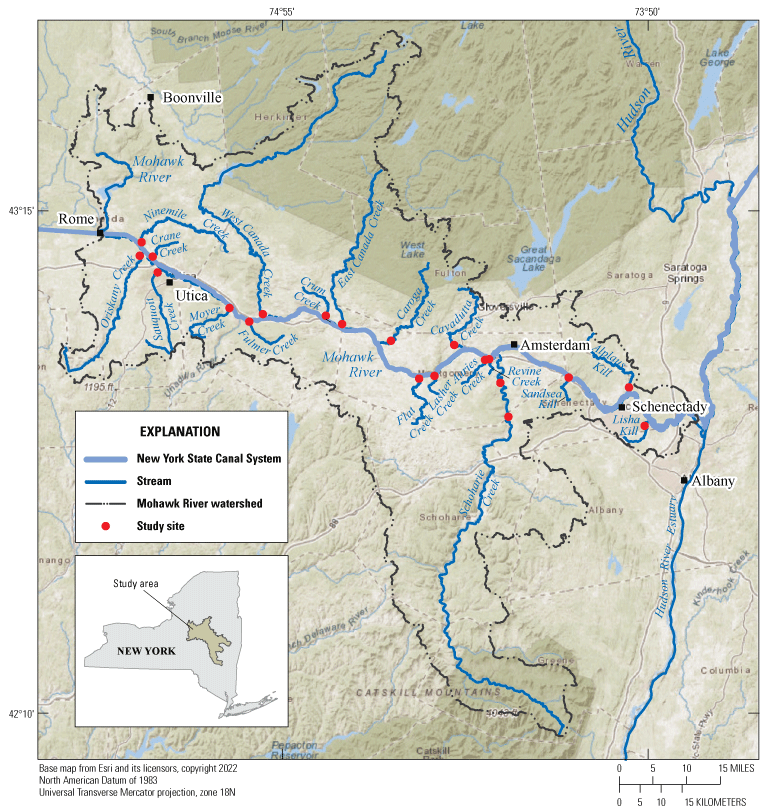
Location of 20 study sites on tributaries to the Mohawk River between Rome and Albany, New York, where fish communities were surveyed in 2019.
Table 1.
Location and characteristics of 20 study sites on tributaries to the Mohawk River between Rome and Albany, New York, where fish communities were surveyed in 2019.[U.S. Geological Survey (USGS) station names and station numbers are from the National Water Information System (U.S. Geological Survey, 2021c). Drainage areas were calculated using StreamStats (U.S. Geological Survey, 2021b). Latitude and longitude are provided in decimal degrees and represent the downstream end of each sampled reach. ID, identification number; km2, square kilometer; m, meter; m2, square meter; km, kilometer; Cr, Creek; Rd, Road; nr, near; NYS, New York State]
Fish communities were sampled using multipass depletion electrofishing surveys. During each survey, fish were collected from seine-blocked reaches in three consecutive passes, with one person operating a Smith-Root LR–24 backpack electrofisher and three to five people netting fish. All fish were identified to species, measured for total length, weighed, and returned to the stream after all passes were completed. For some small and highly abundant species, lengths and weights were recorded from a subsample of 30 fish across their length distribution, after which mean length and pooled weights were recorded in batches of up to 30 fish.
Information on the dimensions and substrate composition of the sampled reaches was also collected during each survey. The total length of the reach and the widths of 10 evenly spaced transects were measured and used to calculate mean reach width and total area sampled. Substrate size was characterized using a reach-averaged, modified Wolman pebble count (Wolman, 1954) in which 10 particles were measured across each of the 10 perpendicular transects (100 total particles). The intermediate axis or “b-axis” of each particle was measured to the nearest millimeter using a meter stick. Fine particles less than 2 millimeters (mm) in size were not measured and instead were classified as sand if they were grainy to the touch or as silt if they were smooth to the touch. Bedrock or boulders with an intermediate axis greater than (>) 1 m were classified as >1,000 mm. The pebble count data were used to estimate commonly reported measures of substrate size, including the 16th percentile (D16), 50th percentile or median (D50), and 84th percentile (D84), using linear interpolation with the PERCENTILE.INC function in Microsoft Excel. All data from the fish surveys and habitat characterization are available in George and others (2021b).
The number of fish captured during each pass was used to generate population estimates, with associated 95 percent confidence intervals for each species at each site, using the Carle-Strub method (Carle and Strub, 1978) with the FSA package (Ogle and others, 2021) in R (R Core Team, 2021). Population estimates and associated confidence intervals were standardized by the area of the sampled reach to produce estimates of fish density per 1,000 square meters (m2) of stream. Estimates of population biomass and associated 95 percent confidence intervals were generated by multiplying the density estimates and associated confidence intervals by the mean weight for each species at each site. In rare instances where the lower bound of the confidence interval around an estimate was less than zero, the negative value was replaced with a zero. Estimates of total density and biomass for the entire community (all species combined) were also generated for each site using the same process described above. Additionally, the diversity of the community was assessed for each site using two indices: species richness and Shannon’s index of diversity (Shannon, 1948). Species richness was calculated as the total number of species captured at a site and Shannon’s index of diversity was calculated as:
where S is the number of species and pi is the proportion of the total sample represented by the ith species (Kwak and Peterson, 2007).Results
A total of 11,794 individual fish and 37 fish species were captured during the 20 surveys. Longnose dace (Rhinichthys cataractae), white sucker (Catostomus commersonii), blacknose dace (Rhinichthys atratulus), fantail darter (Etheostoma flabellare), and creek chub (Semotilus atromaculatus) were the most frequently encountered species, occurring at 18, 18, 17, 17, and 16 of the 20 sites, respectively (table 2). Eight species were present at more than half the sites, whereas the remaining 29 species were encountered infrequently, occurring at less than half the sites. Species richness ranged from 3 at Sandsea Kill to 19 at Oriskany Creek, and Shannon’s index of diversity ranged from 0.33 at Sandsea Kill to 2.61 at Sauquoit Creek. The total density of all fish species (community density) ranged from 162 fish per 1,000 m2 at Sauquoit Creek to 7,182 fish per 1,000 m2 at Crane Creek (fig. 3), and the total biomass of all fish species (community biomass) ranged from 498 grams per 1,000 m2 at Revine Creek to 10,588 grams per 1,000 m2 at Crane Creek (fig. 4; table 3).
Table 2.
Common name, scientific name, and the number of study sites present for all species captured during fish community surveys at 20 study sites on tributaries to the Mohawk River between Rome and Albany, New York, in 2019.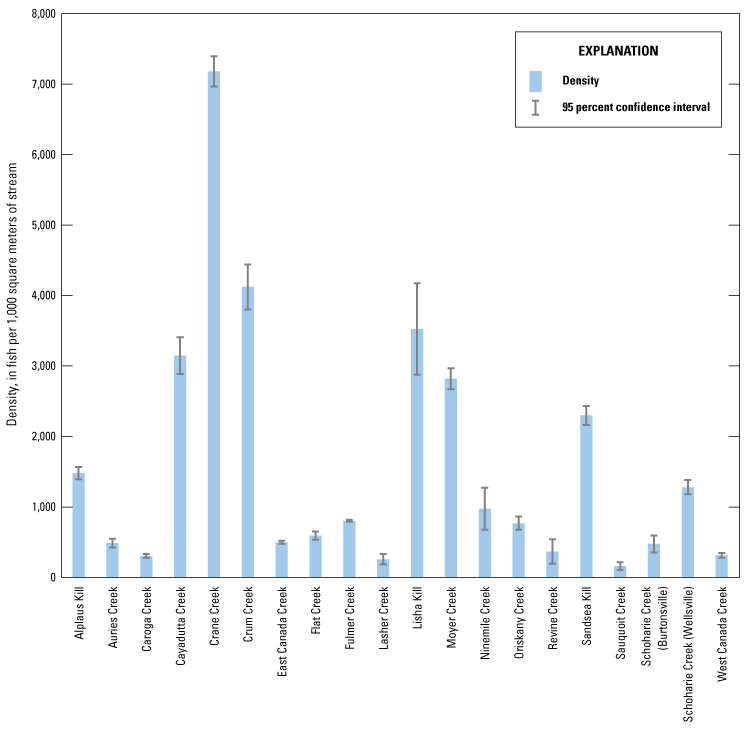
Total fish community density for 20 sites on tributaries to the Mohawk River between Rome and Albany, New York, where fish communities were surveyed in 2019.
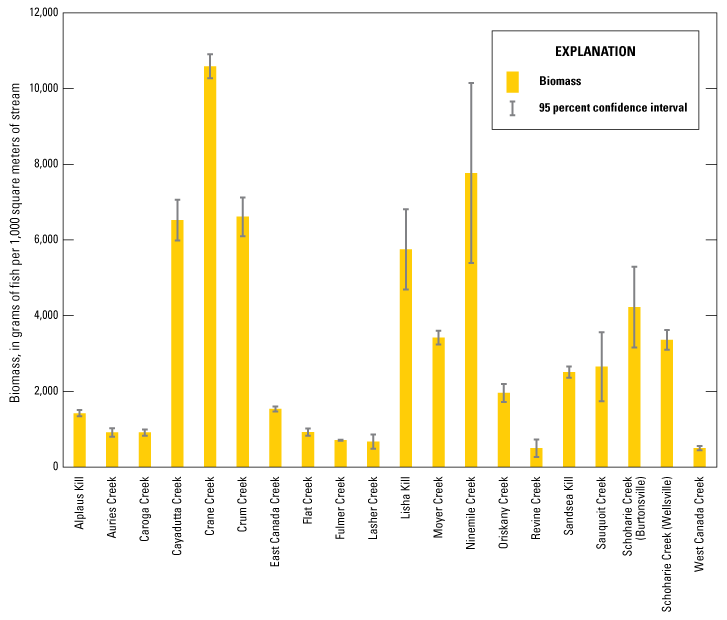
Total fish community biomass for 20 sites on tributaries to the Mohawk River between Rome and Albany, New York, where fish communities were surveyed in 2019.
Table 3.
Fish metrics from 20 study sites on tributaries to the Mohawk River between Rome and Albany, New York, where fish communities were surveyed in 2019.[USGS, U.S. Geological Survey; no, number; m2, square meter; mm, millimeter; D16, 16th percentile; D50, 50th percentile or median; D84, 84th percentile; Cr, Creek; Rd, Road; nr, near; NYS, New York State]
Six darter species were captured during the 20 surveys, and at least one darter species was captured at every site except for Sandsea Kill. Fantail darter was the most frequently encountered darter, found at 17 of the 20 sites, followed by tessellated darter (Etheostoma olmstedi) at 11 sites, rainbow darter (Etheostoma caeruleum) and logperch (Percina caprodes) each at 9 sites, blackside darter (Percina maculata) at 4 sites, and greenside darter (Etheostoma blennioides) at 3 sites (table 2). Fantail darter was widely distributed throughout the watershed, while tessellated darter and logperch were found less commonly but were also widely distributed (fig. 5). Rainbow darter was concentrated exclusively at the eastern end of the study area, occurring at 9 of the 10 easternmost sites. In contrast, blackside darter was found exclusively at the western end of the study area, occurring at four of the six westernmost sites. No discernable pattern was evident in the distribution of greenside darter, as the species was found at only three sites that were geographically distant from one another.
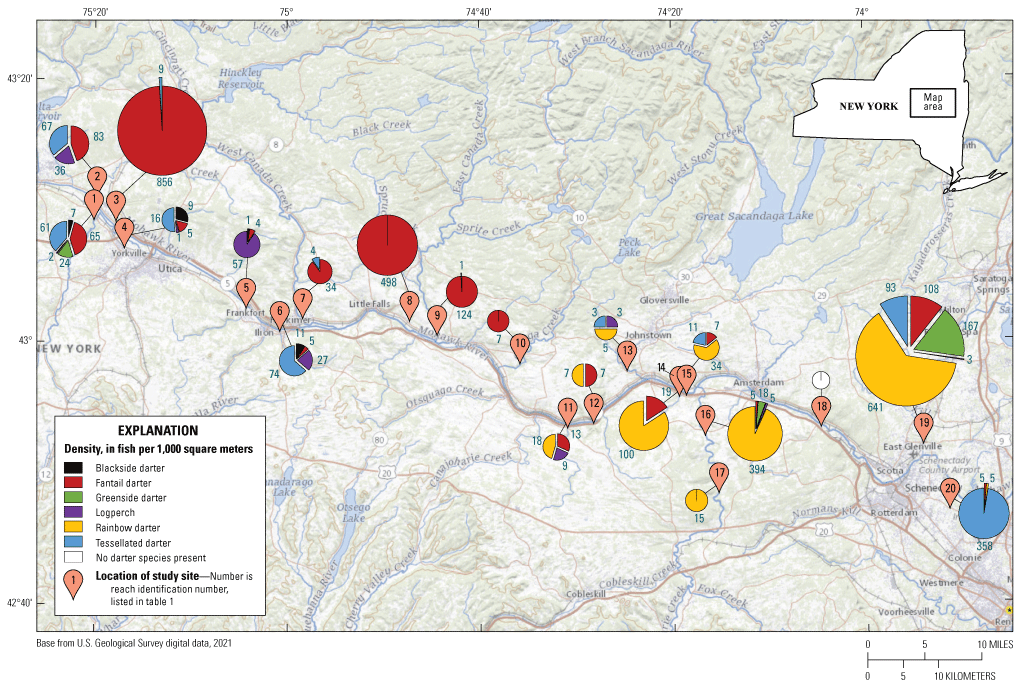
Map showing the distribution and density of all darter species for 20 sites on tributaries to the Mohawk River between Rome and Albany, New York, where fish communities were surveyed in 2019. Distribution and density are shown as pie charts proportionally sized to the total density of all darter species.
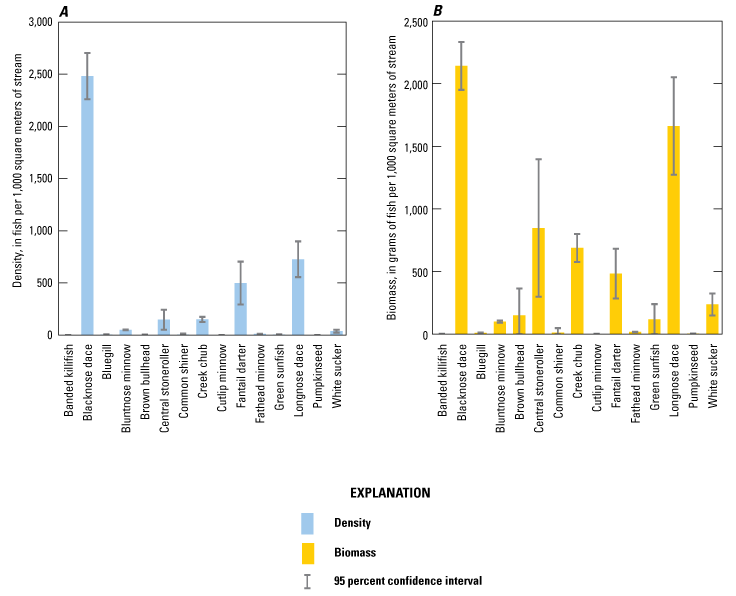
Alplaus Kill at Glenridge, N.Y
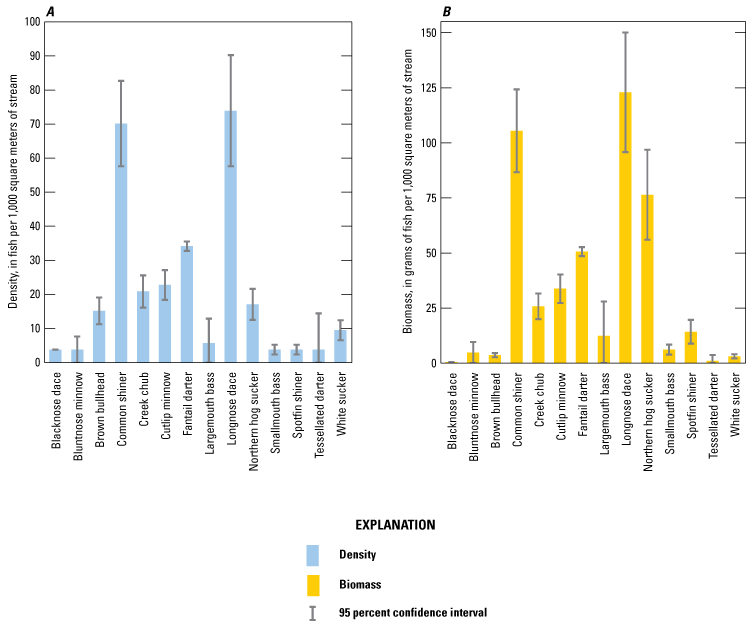
There were 12 fish species present at the Alplaus Kill site (fig. 6). The total community density was 1,482 fish per 1,000 m2, and rainbow darter was the most abundant species, composing 43 percent of the community. The total community biomass was 1,423 grams per 1,000 m2, and smallmouth bass had the greatest biomass, composing 43 percent of the community. There were five darter species present—fantail darter, greenside darter, logperch, rainbow darter, and tessellated darter—which together composed 68 and 47 percent of the community density and biomass, respectively. The pebble count yielded a particle size distribution with a D16 of 31 mm, D50 of 64 mm, and D84 of 122 mm (table 3).
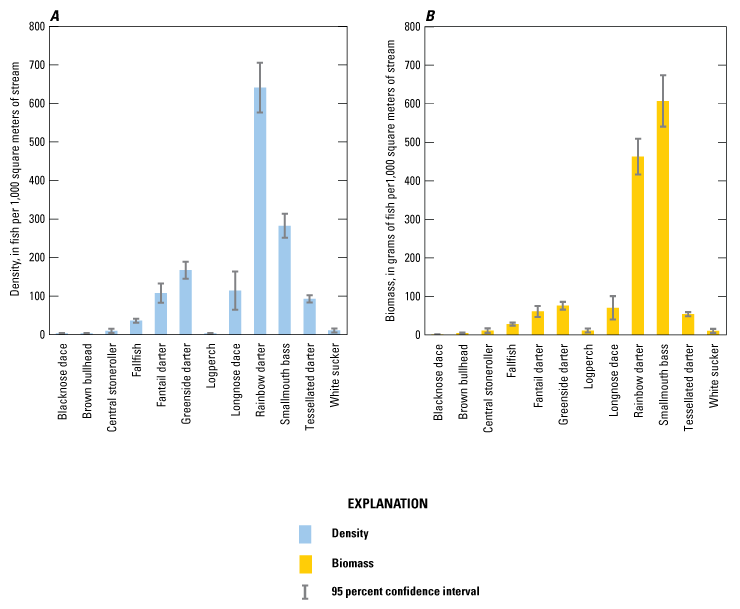
Population density and biomass of each fish species captured at the Alplaus Kill at Glenridge, New York, site.
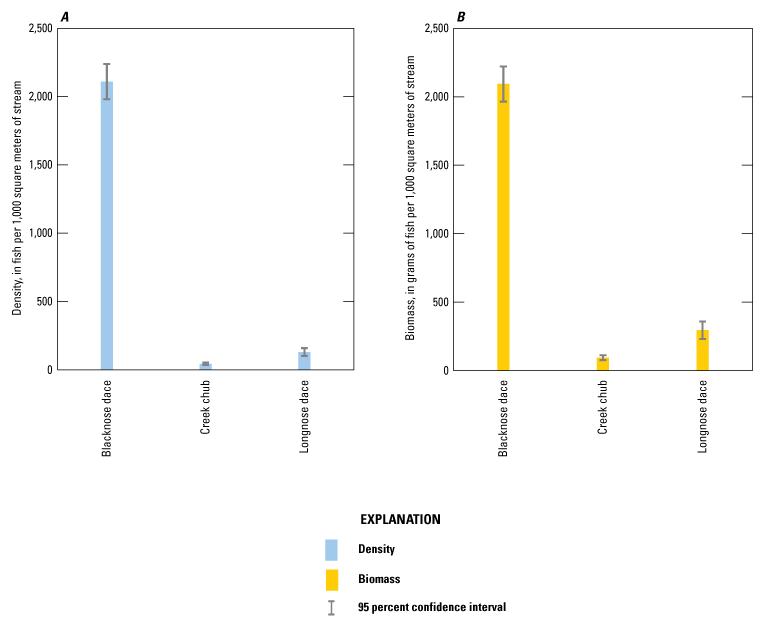
Auries Creek at Auriesville, N.Y
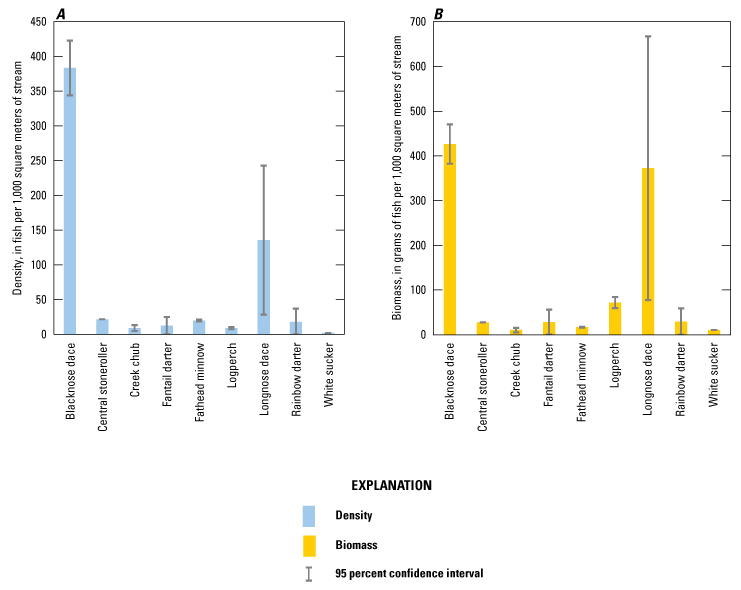
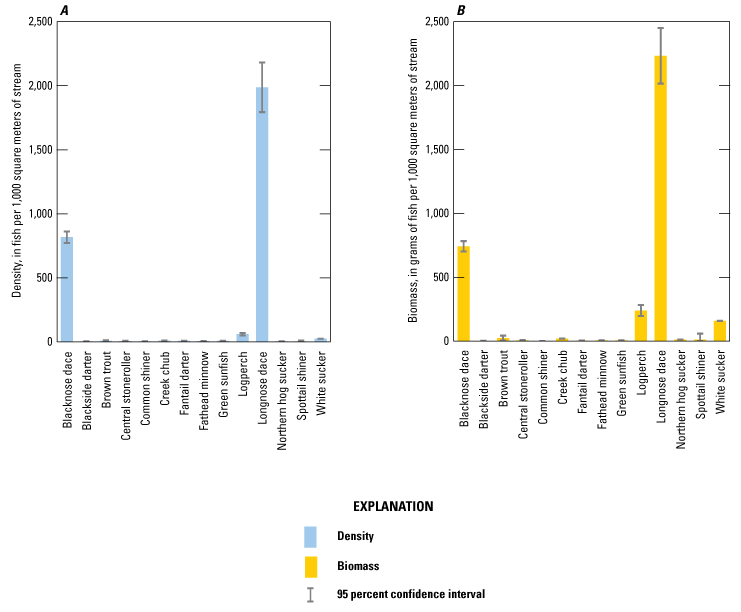
There were nine fish species present at the Auries Creek site (fig. 7). The total community density was 488 fish per 1,000 m2, and blacknose dace was the most abundant species, composing 40 percent of the community. The total community biomass was 915 grams per 1,000 m2, and blacknose dace had the greatest biomass, composing 34 percent of the community. There were two darter species present—fantail darter and rainbow darter—which together composed 24 and 20 percent of the community density and biomass, respectively. The pebble count yielded a particle size distribution with a D16 of 20 mm, D50 of 79 mm, and D84 of 210 mm (table 3).
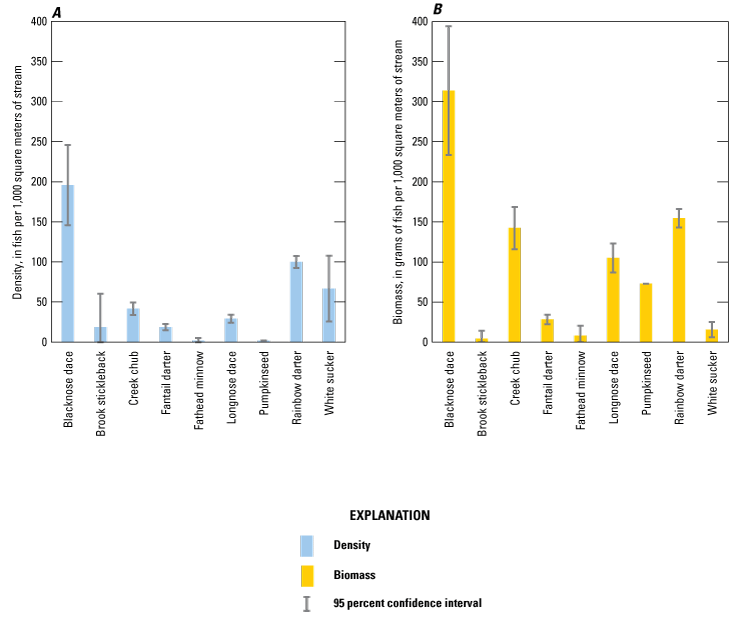
Population density and biomass of each fish species captured at the Auries Creek at Auriesville, New York, site.
Caroga Creek Near Fort Plain, N.Y
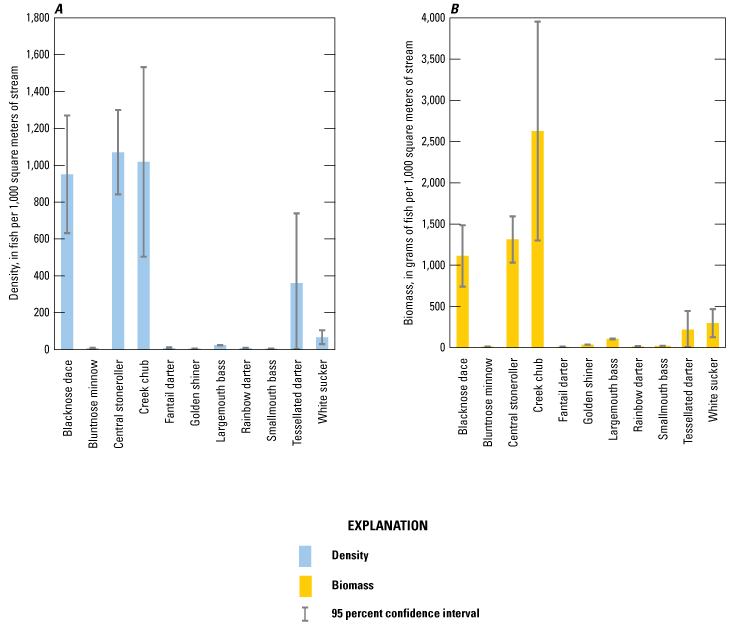
There were 12 fish species present at the Caroga Creek site (fig. 8). The total community density was 305 fish per 1,000 m2, and longnose dace was the most abundant species, composing 28 percent of the community. The total community biomass was 913 grams per 1,000 m2, and brown bullhead (Ameiurus nebulosus) had the greatest biomass, composing 16 percent of the community. Fantail darter was the only darter species present, which composed 2 and less than 1 percent of the community density and biomass, respectively. The pebble count yielded a particle size distribution with a D16 of 51 mm, D50 of 118 mm, and D84 of 314 mm (table 3).
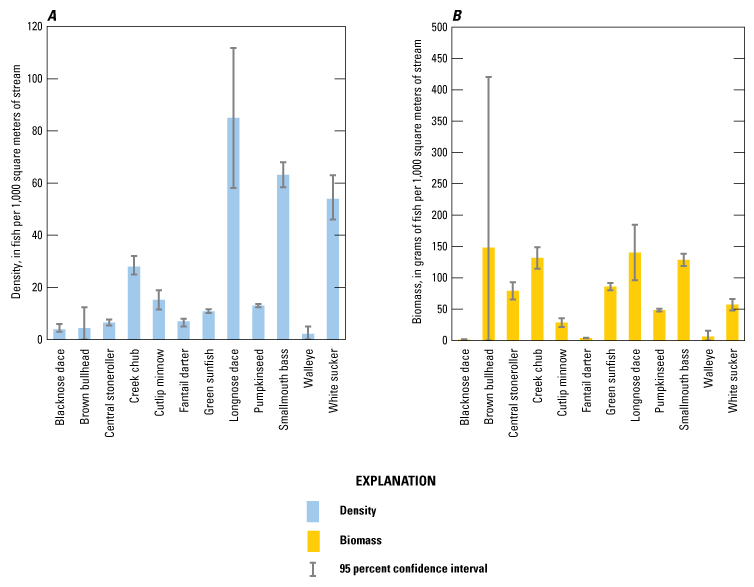
Population density and biomass of each fish species captured at the Caroga Creek near Fort Plain, New York, site.
Cayadutta Creek Below Commons Road at Berryville, N.Y
There were 14 fish species present at the Cayadutta Creek site (fig. 9). The total community density was 3,149 fish per 1,000 m2, and longnose dace was the most abundant species, composing 78 percent of the community. The total community biomass was 6,525 grams per 1,000 m2, and longnose dace had the greatest biomass, composing 57 percent of the community. There were three darter species present—logperch, rainbow darter, and tessellated darter—which together composed less than 1 percent of both the community density and biomass. The pebble count yielded a particle size distribution with a D16 of 38 mm, D50 of 97 mm, and D84 of 215 mm (table 3).
Population density and biomass of each fish species captured at the Cayadutta Creek below Commons Road at Berryville, New York, site.
Crane Creek Below Old River Road at Careys Corners, N.Y
There were 10 fish species present at the Crane Creek site (fig. 10). This site was noteworthy because it produced the greatest estimates of community density and community biomass in the entire study. The total community density was 7,182 fish per 1,000 m2, and blacknose dace was the most abundant species, composing 72 percent of the community. The total community biomass was 10,588 grams per 1,000 m2, and blacknose dace had the greatest biomass, composing 59 percent of the community. There were two darter species present—fantail darter and tessellated darter—which together composed 12 and 10 percent of the community density and biomass, respectively. The pebble count yielded a particle size distribution with a D16 of 27 mm, D50 of 50 mm, and D84 of 113 mm (table 3).
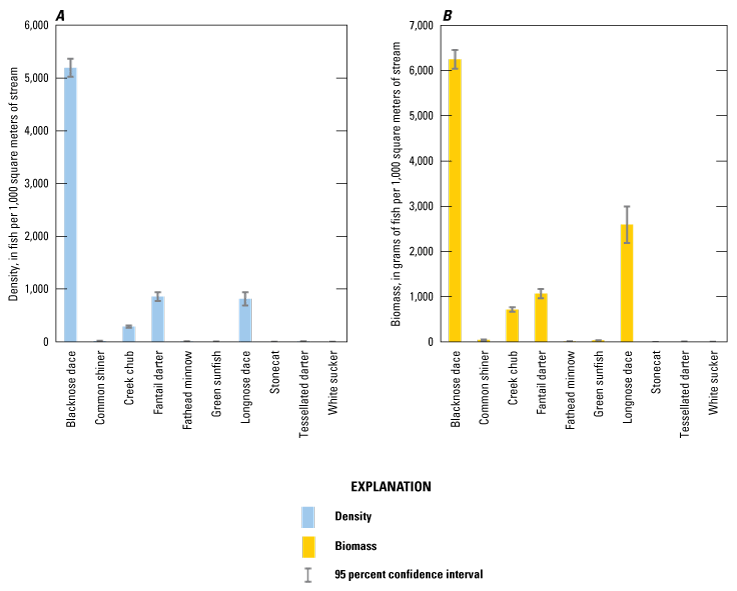
Population density and biomass of each fish species captured at the Crane Creek below Old River Road at Careys Corners, New York, site.
Crum Creek Near Indian Castle, N.Y
There were 15 fish species present at the Crum Creek site (fig. 11). The total community density was 4,123 fish per 1,000 m2, and blacknose dace was the most abundant species, composing 60 percent of the community. The total community biomass was 6,614 grams per 1,000 m2, and blacknose dace had the greatest biomass, composing 32 percent of the community. Fantail darter was the only darter species present, which composed 12 and 7 percent of the community density and biomass, respectively. The pebble count yielded a particle size distribution with a D16 of 41 mm, D50 of 85 mm, and D84 of 173 mm (table 3).
Population density and biomass of each fish species captured at the Crum Creek near Indian Castle, New York, site.
East Canada Creek Near St. Johnsville, N.Y
There were eight fish species present at the East Canada Creek site (fig. 12). The total community density was 499 fish per 1,000 m2, and longnose dace was the most abundant species, composing 44 percent of the community. The total community biomass was 1,534 grams per 1,000 m2, and stonecat (Noturus flavus) had the greatest biomass, composing 39 percent of the community. There were two darter species present—fantail darter and tessellated darter—which together composed 25 and 19 percent of the community density and biomass, respectively. The pebble count yielded a particle size distribution with a D16 of 67 mm, D50 of 126 mm, and D84 of 220 mm (table 3).
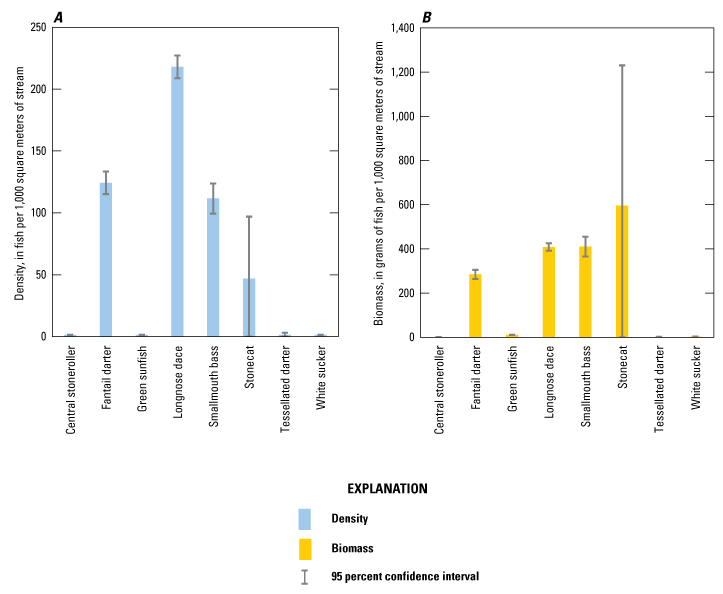
Population density and biomass of each fish species captured at the East Canada Creek near St. Johnsville, New York, site.
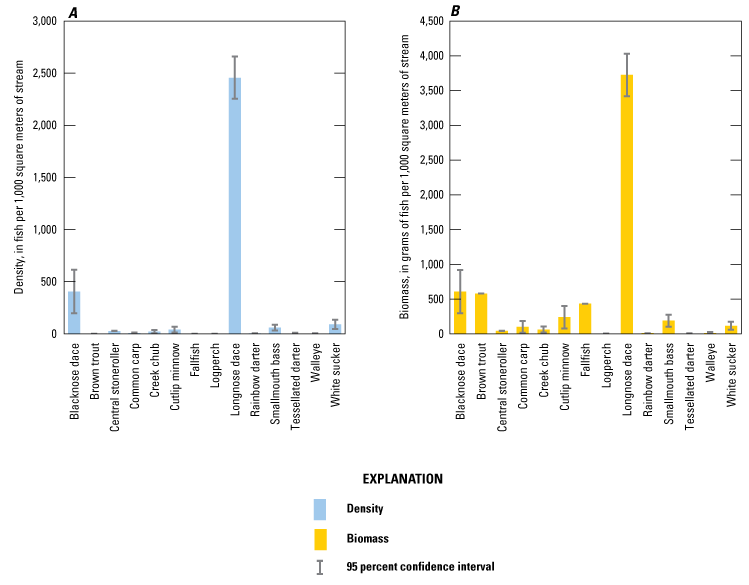
Flat Creek at Sprakers, N.Y
There were nine fish species present at the Flat Creek site (fig. 13). The total community density was 595 fish per 1,000 m2, and blacknose dace was the most abundant species, composing 64 percent of the community. The total community biomass was 925 grams per 1,000 m2, and blacknose dace had the greatest biomass, composing 46 percent of the community. There were three darter species present—fantail darter, logperch, and rainbow darter—which together composed 7 and 14 percent of the community density and biomass, respectively. The pebble count yielded a particle size distribution with a D16 of 17 mm, D50 of 85 mm, and D84 of >1,000 mm (table 3).
Population density and biomass of each fish species captured at the Flat Creek at Sprakers, New York, site.
Fulmer Creek at Mohawk, N.Y
There were eight fish species present at the Fulmer Creek site (fig. 14). The total community density was 803 fish per 1,000 m2, and white sucker was the most abundant species, composing 62 percent of the community. The total community biomass was 708 grams per 1,000 m2, and longnose dace had the greatest biomass, composing 30 percent of the community. There were four darter species present—blackside darter, fantail darter, logperch, and tessellated darter—which together composed 15 and 43 percent of the community density and biomass, respectively. The pebble count yielded a particle size distribution with a D16 of 16 mm, D50 of 43 mm, and D84 of 94 mm (table 3).
Population density and biomass of each fish species captured at the Fulmer Creek at Mohawk, New York, site.
Lasher Creek at Mouth Near Randall, N.Y
There were 12 fish species present at the Lasher Creek site (fig. 15). The total community density was 258 fish per 1,000 m2, and longnose dace was the most abundant species, composing 19 percent of the community. The total community biomass was 673 grams per 1,000 m2, and white sucker had the greatest biomass, composing 46 percent of the community. There were two darter species present—fantail darter and rainbow darter—which together composed 5 and 3 percent of the community density and biomass, respectively. The pebble count yielded a particle size distribution with a D16 of 11 mm, D50 of 33 mm, and D84 of 141 mm (table 3).
Population density and biomass of each fish species captured at the Lasher Creek at Mouth near Randall, New York, site.
Lisha Kill Northwest of Niskayuna, N.Y
There were 11 fish species present at the Lisha Kill site (fig. 16). The total community density was 3,525 fish per 1,000 m2, and central stoneroller (Campostoma anomalum) was the most abundant species, composing 30 percent of the community. The total community biomass was 5,755 grams per 1,000 m2, and creek chub had the greatest biomass, composing 46 percent of the community. There were three darter species present—fantail darter, rainbow darter, and tessellated darter—which together composed 10 and 4 percent of the community density and biomass, respectively. The pebble count yielded a particle size distribution with a D16 of 6 mm, D50 of 25 mm, and D84 of 46 mm (table 3).
Population density and biomass of each fish species captured at the Lisha Kill northwest of Niskayuna, New York, site.
Moyer Creek at Mouth at Frankfort, N.Y
There were 14 fish species present at the Moyer Creek site (fig. 17). The total community density was 2,819 fish per 1,000 m2, and longnose dace was the most abundant species, composing 70 percent of the community. The total community biomass was 3,422 grams per 1,000 m2, and longnose dace had the greatest biomass, composing 65 percent of the community. There were three darter species present—blackside darter, fantail darter, and logperch—which together composed 2 and 7 percent of the community density and biomass, respectively. The pebble count yielded a particle size distribution with a D16 of 23 mm, D50 of 63 mm, and D84 of 125 mm (table 3).
Population density and biomass of each fish species captured at the Moyer Creek at mouth at Frankfort, New York, site.
Ninemile Creek Near Oriskany, N.Y
There were 15 fish species present at the Ninemile Creek site (fig. 18). The total community density was 974 fish per 1,000 m2, and longnose dace was the most abundant species, composing 49 percent of the community. The total community biomass was 7,769 grams per 1,000 m2, and smallmouth bass had the greatest biomass, composing 46 percent of the community. There were three darter species present—fantail darter, logperch, and tessellated darter—which together composed 19 and 3 percent of the community density and biomass, respectively. Additionally, round goby were present in the study reach with an estimated density of 20 fish per 1,000 m2 and biomass of 68 grams per 1,000 m2 (fig. 19). The pebble count yielded a particle size distribution with a D16 of 28 mm, D50 of 51 mm, and D84 of 81 mm (table 3).
Population density and biomass of each fish species captured at the Ninemile Creek near Oriskany, New York, site.

A round goby captured during the fish community survey at the Ninemile Creek near Oriskany, New York, site. Photograph by Kyle Olivencia, U.S. Geological Survey.
Oriskany Creek Near Ballfield at Oriskany, N.Y
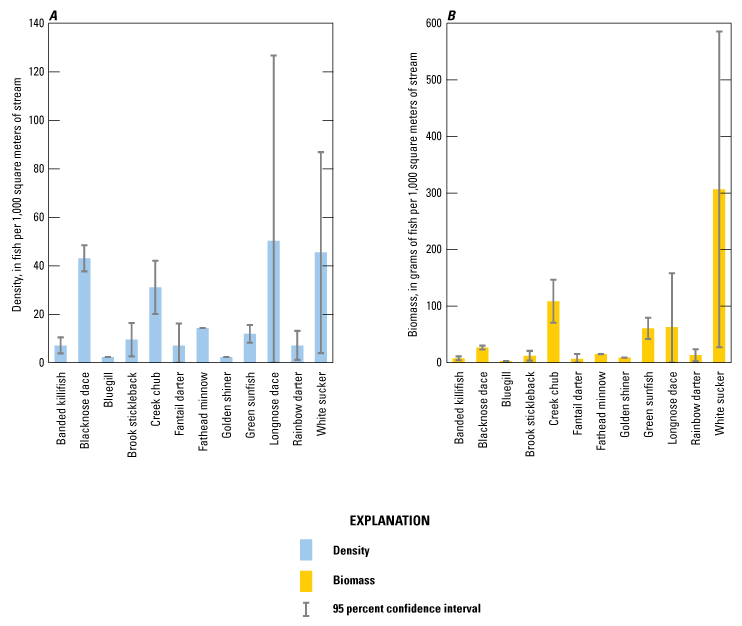
There were 19 fish species present at the Oriskany Creek site (fig. 20). The total community density was 769 fish per 1,000 m2, and longnose dace was the most abundant species, composing 34 percent of the community. The total community biomass was 1,959 grams per 1,000 m2, and green sunfish (Lepomis cyanellus) had the greatest biomass, composing 27 percent of the community. There were five darter species present—blackside darter, fantail darter, greenside darter, logperch, and tessellated darter—which together composed 21 and 9 percent of the community density and biomass, respectively. The pebble count yielded a particle size distribution with a D16 of 24 mm, D50 of 51 mm, and D84 of 84 mm (table 3).
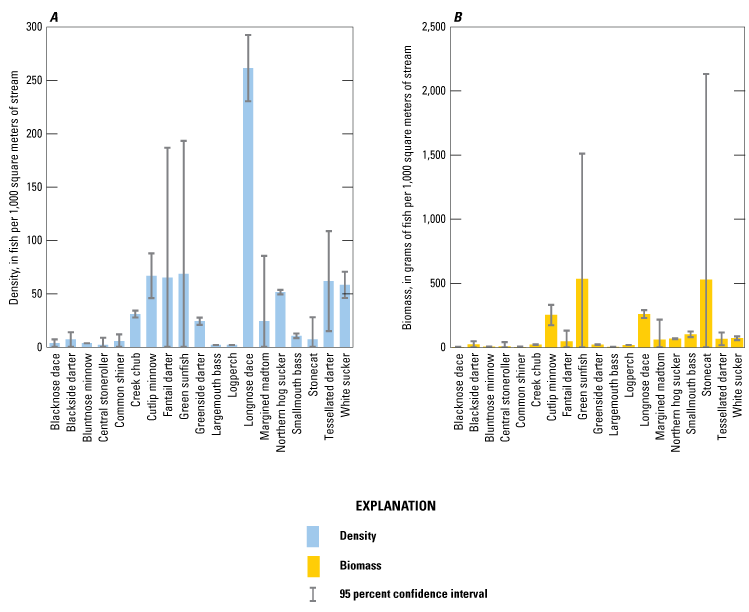
Population density and biomass of each fish species captured at the Oriskany Creek near Ballfield at Oriskany, New York, site.
Revine Creek at New York State Thruway at Auriesville, N.Y
There were eight fish species present at the Revine Creek site (fig. 21). The total community density was 369 fish per 1,000 m2, and white sucker was the most abundant species, composing 21 percent of the community. The total community biomass was 498 grams per 1,000 m2, and creek chub had the greatest biomass, composing 23 percent of the community. There were three darter species present—fantail darter, rainbow darter, and tessellated darter—which together composed 14 and 15 percent of the community density and biomass, respectively. The pebble count yielded a particle size distribution with a D16 of 12 mm, D50 of 40 mm, and D84 of 99 mm (table 3).
Population density and biomass of each fish species captured at the Revine Creek at the New York State Thruway at Auriesville, New York, site.
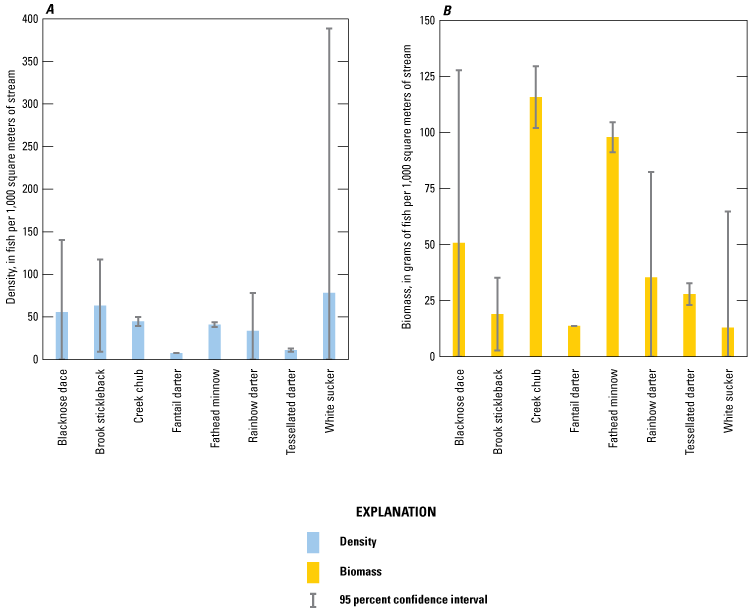
Sandsea Kill at Pattersonville, N.Y
There were three fish species present at the Sandsea Kill site (fig. 22). The total community density was 2,298 fish per 1,000 m2, and blacknose dace was the most abundant species, composing 92 percent of the community. The total community biomass was 2,510 grams per 1,000 m2, and blacknose dace had the greatest biomass, composing 83 percent of the community. There were no darter species present. The pebble count yielded a particle size distribution with a D16 of 30 mm, D50 of 70 mm, and D84 of 170 mm (table 3).
Population density and biomass of each fish species captured at the Sandsea Kill at Pattersonville, New York, site.
Sauquoit Creek at Yorkville, N.Y
There were 18 fish species present at the Sauquoit Creek site (fig. 23). The total community density was 162 fish per 1,000 m2, and longnose dace was the most abundant species, composing 12 percent of the community. A single brown trout (Salmo trutta) with a length of 448 mm and mass of 1,214 grams, the largest fish captured in the entire study, was responsible for nearly half of the biomass in the study reach (fig. 24). The total community biomass was 2,652 grams per 1,000 m2, and brown trout had the greatest biomass, composing 46 percent of the community. There were four darter species present—blackside darter, fantail darter, logperch, and tessellated darter—which together composed 19 and 3 percent of the community density and biomass, respectively. The pebble count yielded a particle size distribution with a D16 of 4 mm, D50 of 21 mm, and D84 of 71 mm (table 3).
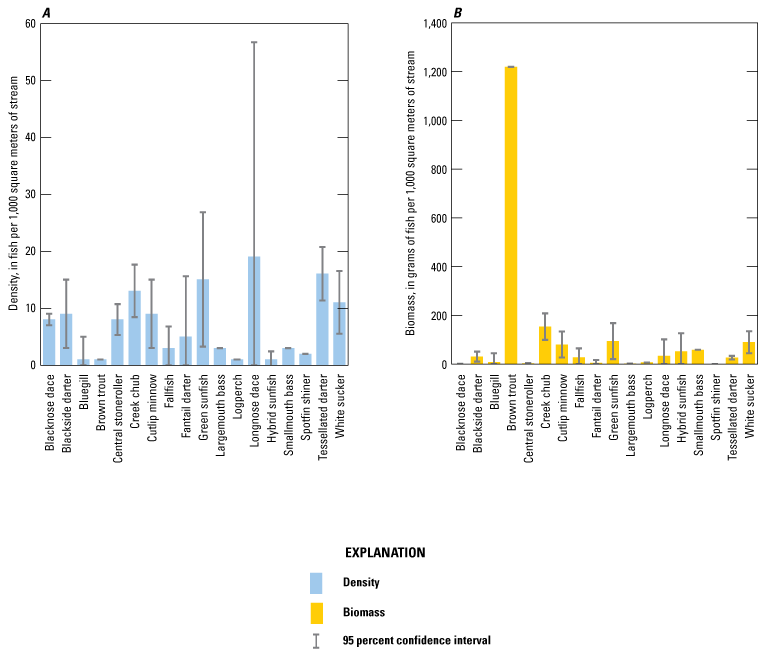
Population density and biomass of each fish species captured at the Sauquoit Creek at Yorkville, New York, site.
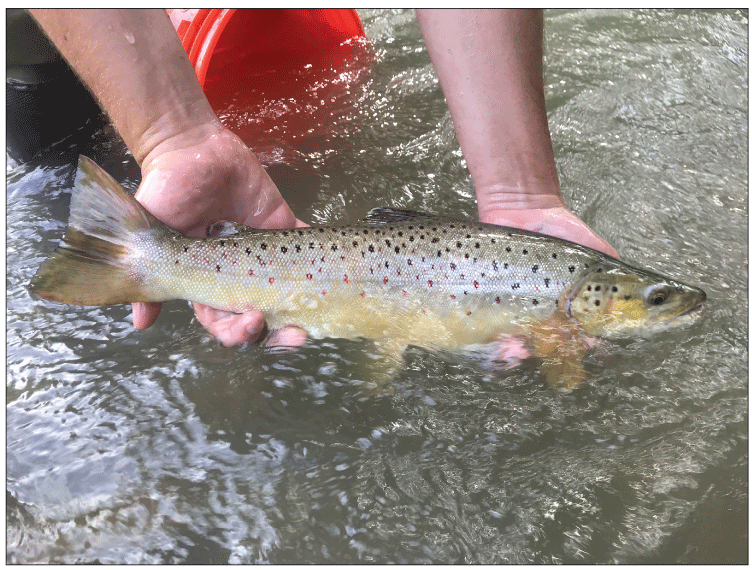
A large brown trout captured during the fish community survey at the Sauquoit Creek at Yorkville, New York, site. Photograph by Dylan Winterhalter, U.S. Geological Survey.
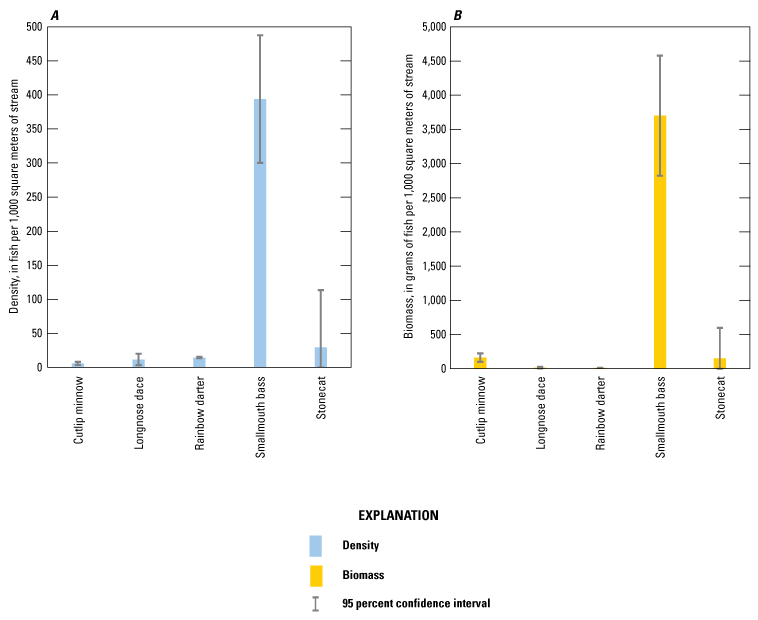
Schoharie Creek Below Bridge at Burtonsville, N.Y
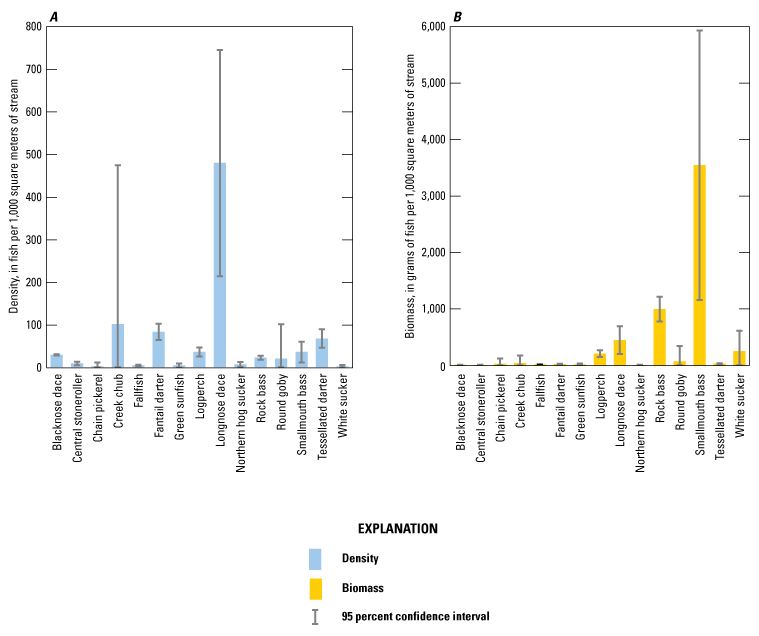
There were five fish species present at the Schoharie Creek at Burtonsville site (fig. 25). The total community density was 476 fish per 1,000 m2, and smallmouth bass was the most abundant species, composing 83 percent of the community. The total community biomass was 4,227 grams per 1,000 m2, and smallmouth bass had the greatest biomass, composing 88 percent of the community. Rainbow darter was the only darter species present, which composed 3 and less than 1 percent of the community density and biomass, respectively. The pebble count yielded a particle size distribution with a D16 of 47 mm, D50 of 178 mm, and D84 of 575 mm (table 3).
Population density and biomass of each fish species captured at the Schoharie Creek below bridge at Burtonsville, New York, site.
Schoharie Creek Near Wellsville, N.Y
There were 14 fish species present at the Schoharie Creek near Wellsville site (fig. 26). The total community density was 1,281 fish per 1,000 m2, and smallmouth bass was the most abundant species, composing 51 percent of the community. The total community biomass was 3,360 grams per 1,000 m2, and smallmouth bass had the greatest biomass, composing 61 percent of the community. There were four darter species present—fantail darter, greenside darter, logperch, and rainbow darter—which together composed 33 and 18 percent of the community density and biomass, respectively. The pebble count yielded a particle size distribution with a D16 of 56 mm, D50 of 111 mm, and D84 of 300 mm (table 3).

Population density and biomass of each fish species captured at the Schoharie Creek near Wellsville, New York, site.
West Canada Creek at Herkimer, N.Y
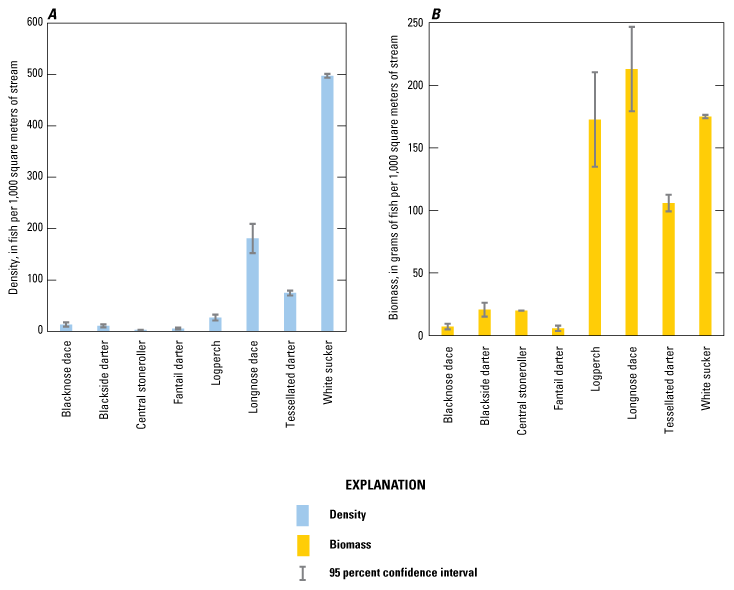
There were 14 fish species present at the West Canada Creek site (fig. 27). The total community density was 313 fish per 1,000 m2, and longnose dace was the most abundant species, composing 24 percent of the community. The total community biomass was 500 grams per 1,000 m2, and longnose dace had the greatest biomass, composing 25 percent of the community. There were two darter species present—fantail darter and tessellated darter—which together composed 12 and 10 percent of the community density and biomass, respectively. The pebble count yielded a particle size distribution with a D16 of 21 mm, D50 of 56 mm, and D84 of 154 mm (table 3).
Population density and biomass of each fish species captured at the West Canada Creek at Herkimer, New York, site.
Findings and Conclusions
The findings from this study have several important implications. First, it appears that round goby had not extensively colonized tributaries to the Mohawk River at the time the reaches were surveyed in summer 2019. Round goby were only captured in one tributary, and the density of that population was low. The near absence of round goby from tributaries to the Mohawk River in 2019 was expected given the existing information on the sparse distribution of round goby in the mainstem of the Mohawk River at that time. At the end of 2019, the easternmost capture of round goby was near Utica, although environmental DNA data suggested the species may have been present further east than fish capture records indicate (George and others, 2021a). Overall, this information indicates that fish communities in tributaries to the Mohawk River remained largely unaffected by round goby in 2019, and the data described in this report represent the preinvasion baseline condition, thus fulfilling a primary objective of this project.
Second, although fish communities were generally dominated by minnow species such as blacknose dace and longnose dace, darters were an important component of communities, averaging 15 and 12 percent of the density and biomass, respectively. The distribution and abundance of darter species were of particular interest in this study because darters and round goby occupy similar niches, and darter populations are often negatively affected by the presence of round goby. The darter community in tributaries to the Mohawk River comprised six species: blackside darter, fantail darter, greenside darter, logperch, rainbow darter, and tessellated darter, and some evidence indicates the distribution and abundance of these species may be changing. Of this group, fantail darter, greenside darter, and tessellated darter are believed to be native to the Mohawk River watershed, blackside darter and rainbow darter are believed to be nonnative to the Mohawk River watershed, and there is not a consensus regarding the status of logperch (Carlson and others, 2016a; U.S. Geological Survey, 2022). Rainbow darter, for example, is only native to the western portion of New York State and was first identified in the Mohawk River watershed in 2009 in Fox Creek, a tributary to Schoharie Creek (Carlson and others, 2016a). The surveys described in this report, which were conducted only 10 years later (2019), indicated that rainbow darter were present in nine tributaries in the eastern half of the study area and was the dominant darter species at most of these locations. This suggests that the species has expanded rapidly since its recent introduction to the Mohawk River watershed and may be outcompeting other resident darter species.
Lastly, data from future fish community surveys in tributaries to the Mohawk River could be compared with the 2019 data provided in this report to address a number of important research and management questions. First, it would be instructive to determine if round goby indiscriminately colonizes all the tributaries included in this study or if the species shows affinity for certain habitat characteristics, such as substrate size or water velocity. In turn, this information could be used to predict the invasion susceptibility of streams in other adjacent watersheds, such as those in the lower Hudson River and Lake Champlain. It would also be valuable to obtain estimates of how quickly round goby populations are expanding upstream in tributaries to the Mohawk River. A few studies have estimated rates of upstream expansion in tributaries to the Great Lakes and other areas with values ranging from 0.5 to 4 kilometers per year (Bronnenhuber and others, 2011; Kornis and others, 2012; Šlapanský and others, 2017), but it is not known if these estimates are applicable to streams in central and eastern New York. Most importantly, future fish community data could be used to evaluate the effects of established round goby populations on the composition of resident fish assemblages. In particular, future analyses could compare quantitative estimates of darter population density and biomass to determine if round goby have extirpated some of these species, reduced their density, restricted their distribution, or caused no discernable effect. Similarly, future studies might assess changes in populations of stonecat, a small native catfish species that was present at five of the study sites and may also be adversely affected by round goby (Poos and others, 2010; Kornis and others, 2012). Finally, temporal changes in streams of this watershed during the past century could be analyzed more in depth using historical data from the New York State Fish Atlas Database (Carlson and others, 2016b). Thus, it may be prudent to repeat fish community surveys at the same locations and using the same methods 5 to 10 years after the surveys described in this report. Together, this new information and the information from the 2019 surveys could be used to identify the ecological effects of round goby in tributaries to the Mohawk River and to project future effects on aquatic ecosystems in adjacent watersheds.
References Cited
Abbett, R., Waldt, E.M., Johnson, J.H., McKenna, J.E., Jr., and Dittman, D.E., 2013, Interactions between invasive round gobies (Neogobius melanostomus) and fantail darters (Etheostoma flabellare) in a tributary of the St. Lawrence River, New York, USA: Journal of Freshwater Ecology, v. 28, no. 4, p. 529–537, accessed December 20, 2021, at https://doi.org/10.1080/02705060.2013.794165.
Blair, S.G., May, C., Morrison, B., and Fox, M.G., 2019, Seasonal migration and fine‐scale movement of invasive round goby (Neogobius melanostomus) in a Great Lakes tributary: Ecology Freshwater Fish, v. 28, no. 2, p. 200–208, accessed December 20, 2021, at https://doi.org/10.1111/eff.12443.
Bronnenhuber, J.E., Dufour, B.A., Higgs, D.M., and Heath, D.D., 2011, Dispersal strategies, secondary range expansion and invasion genetics of the nonindigenous round goby, Neogobius melanostomus, in Great Lakes tributaries: Molecular Ecology, v. 20, no. 9, p. 1845–1859, accessed December 20, 2021, at https://doi.org/10.1111/j.1365-294X.2011.05030.x.
Carle, F.L., and Strub, M.R., 1978, A new method for estimating population size from removal data: Biometrics, v. 34, no. 4, p. 621–630, accessed December 20, 2021, at https://doi.org/10.2307/2530381.
Carlson, D.M., Daniels, R.A., and Wright, J.J., 2016a, Atlas of inland fishes of New York: New York State Museum Record 7, 362 p., accessed December 20, 2021, at http://www.nysm.nysed.gov/common/nysm/files/atlasofinlandfishes.pdf.
Carlson, D.M., Daniels, R.A., and Wright, J.J., 2016b, Fish atlas maps of New York: New York State Department of Environmental Conservation database, accessed December 20, 2021, at https://www.dec.ny.gov/animals/84622.html.
Corkum, L.D., Sapota, M.R., and Skora, K.E., 2004, The round goby, Neogobius melanostomus, a fish invader on both sides of the Atlantic Ocean: Biological Invasions, v. 6, no. 2, p. 173–181, accessed December 20, 2021, at https://doi.org/10.1023/B:BINV.0000022136.43502.db.
Crane, D.P., and Einhouse, D.W., 2016, Changes in growth and diet of smallmouth bass following invasion of Lake Erie by the round goby: Journal of Great Lakes Research, v. 42, no. 2, p. 405–412, accessed December 20, 2021, at https://doi.org/10.1016/j.jglr.2015.12.005.
Crane, D.P., Farrell, J.M., Einhouse, D.W., Lantry, J.R., and Markham, J.L., 2015, Trends in body condition of native piscivores following invasion of Lakes Erie and Ontario by the round goby: Freshwater Biology, v. 60, no. 1, p. 111–124, accessed December 20, 2021, at https://doi.org/10.1111/fwb.12473.
Farrell, J.M., Getchell, R.G., Kapuscinski, K.L., and LaPan, S.R., 2017, Long‐term trends of St. Lawrence River muskellunge: Effects of viral hemorrhagic septicemia and round goby proliferation creates uncertainty for population sustainability, in Kapuscinski, K., Simonson, T., Crane, D., Kerr, S., Diana, J., and Farrell, J., eds., Muskellunge management—Fifty years of cooperation among anglers, scientists, and fisheries biologists—85th American Fisheries Society Symposium: American Fisheries Society proceedings, p. 275–301, accessed July 23, 2022, at https://doi.org/10.47886/9781934874462. [Conference paper directly accessible at https://fisheries.org/doi/9781934874462-ch29.]
Firth, B., Poesch, M., Koops, M., Drake, D., and Power, M., 2021, Diet overlap of common and at-risk riverine benthic fishes before and after round goby (Neogobius melanostomus) invasion: Biological Invasions, v. 23, no. 1, p. 221–234, accessed December 20, 2021, at https://doi.org/10.1007/s10530-020-02366-7.
Fitzpatrick, F.A., Waite, I.R., D’Arconte, P.J., Meador, M.R., Maupin, M.A., and Gurtz, M.E., 1998, Revised methods for characterizing stream habitat in the National Water-Quality Assessment Program: U.S. Geological Survey Water Resources Investigations Report 98–4052, 67 p. [Also available at https://doi.org/10.3133/wri984052.]
George, S.D., Baldigo, B.P., Rees, C.B., Bartron, M.L., and Winterhalter, D., 2021a, Eastward expansion of round goby in New York—Assessment of Detection methods and current range: Transactions of the American Fisheries Society, v. 150, no. 2, p. 258–273, accessed December 20, 2021, at https://doi.org/10.1002/tafs.10290.
George, S.D., Baldigo, B.P., and Wells, S.M., 2016, Effects of seasonal drawdowns on fish assemblages in sections of an impounded river-canal system in upstate New York: Transactions of the American Fisheries Society, v. 145, no. 6, p. 1348–1357, accessed December 20, 2021, at https://doi.org/10.1080/00028487.2016.1223751.
George, S.D., Baldigo, B.P., and Winterhalter, D.R., 2021b, Fish community and substrate data from tributaries to the Mohawk River: U.S. Geological Survey data release, https://doi.org/10.5066/P9ZRRG3T.
Getchell, R.G., First, E.J., Bogdanowicz, S.M., Andrés, J.A., Schulman, A.T., Kramer, J., Eckerlin, G.E., Farrell, J.M., and Marquis, H., 2019, Investigation of round goby viral haemorrhagic septicaemia outbreak in New York: Journal of Fish Diseases, v. 42, no. 7, p. 1023–1033, accessed December 20, 2021, at https://doi.org/10.1111/jfd.13003.
Hannett, G.E., Stone, W.B., Davis, S.W., and Wroblewski, D., 2011, Biodiversity of Clostridium botulinum type E associated with a large outbreak of botulism in wildlife from Lake Erie and Lake Ontario: Applied and Environmental Microbiology, v. 77, no. 3, p. 1061–1068, accessed December 20, 2021, at https://doi.org/10.1128/AEM.01578-10.
Janáč, M., Valová, Z., Roche, K., and Jurajda, P., 2016, No effect of round goby Neogobius melanostomus colonisation on young-of-the-year fish density or microhabitat use: Biological Invasions, v. 18, no. 8, p. 2333–2347, accessed December 20, 2021, at https://doi.org/10.1007/s10530-016-1165-7.
Kornis, M., Mercado‐Silva, N., and Vander Zanden, M., 2012, Twenty years of invasion—A review of round goby Neogobius melanostomus biology, spread and ecological implications: Journal of Fish Biology, v. 80, no. 2, p. 235–285, accessed December 20, 2021, at https://doi.org/10.1111/j.1095-8649.2011.03157.x.
Kornis, M.S., Sharma, S., and Vander Zanden, M.J., 2013, Invasion success and impact of an invasive fish, round goby, in Great Lakes tributaries: Diversity and Distributions, v. 19, no. 2, p. 184–198, accessed December 20, 2021, at https://doi.org/10.1111/ddi.12001.
Krakowiak, P.J., and Pennuto, C.M., 2008, Fish and macroinvertebrate communities in tributary streams of eastern Lake Erie with and without round gobies (Neogobius melanostomus, Pallas 1814): Journal of Great Lakes Research, v. 34, no. 4, p. 675–689, accessed December 20, 2021, at https://doi.org/10.1016/S0380-1330(08)71610-1.
Kwak, T.J., and Peterson, J.T., 2007, Community indices, parameters, and comparisons, in Guy, C.S., and Brown, M.L., eds., Analysis and interpretation of freshwater fisheries data: American Fisheries Society, p. 677–764, accessed June 23, 2022, at https://doi.org/10.47886/9781888569773.
Lauer, T.E., Allen, P.J., and McComish, T.S., 2004, Changes in mottled sculpin and johnny darter trawl catches after the appearance of round gobies in the Indiana waters of Lake Michigan: Transactions of the American Fisheries Society, v. 133, no. 1, p. 185–189, accessed December 20, 2021, at https://doi.org/10.1577/T02-123.
McBride, N.D., 2009, Lower Mohawk River fisheries, in 2009 Mohawk watershed symposium, Schenectady, N.Y., March 27, 2009, Proceedings: New York State Department of Environmental Conservation, p. 51–54, accessed June 23, 2022, at https://minerva.union.edu/garverj/mohawk/symposium/2009_Mohawk_symposium.html.
Meador, M.R., McIntyre, J.P., and Pollock, K.H., 2003, Assessing the efficacy of single-pass backpack electrofishing to characterize fish community structure: Transactions of the American Fisheries Society, v. 132, no. 1, p. 39–46. [Also available at https://doi.org/10.1577/1548-8659(2003)132<0039:ATEOSP>2.0.CO;2.]
New York State Department of Environmental Conservation, 2012, Mohawk River basin action agenda—2012–2016: New York State Department of Environmental Conservation, 31 p., accessed August 5, 2022, at https://wri.cals.cornell.edu/sites/wri.cals.cornell.edu/files/shared/documents/MohawkRiverActionAgenda2012-2016.pdf.
Ogle, D.H., Wheeler, P., and Dinno, A., 2021, FSA—Simple fisheries stock assessment methods: R Foundation for Statistical Computing R package version 0.8.32, accessed February 2021 at https://cran.r-project.org/web/packages/FSA/index.html.
Pennuto, C., Krakowiak, P., and Janik, C., 2010, Seasonal abundance, diet, and energy consumption of round gobies (Neogobius melanostomus) in Lake Erie tributary streams: Ecology Freshwater Fish, v. 19, no. 2, p. 206–215, accessed December 20, 2021, at https://doi.org/10.1111/j.1600-0633.2010.00405.x.
Phillips, E.C., Washek, M.E., Hertel, A.W., and Niebel, B.M., 2003, The round goby (Neogobius melanostomus) in Pennsylvania tributary streams of Lake Erie: Journal of Great Lakes Research, v. 29, no. 1, p. 34–40, accessed December 20, 2021, at https://doi.org/10.1016/S0380-1330(03)70413-4.
Poos, M., Dextrase, A.J., Schwalb, A.N., and Ackerman, J.D., 2010, Secondary invasion of the round goby into high diversity Great Lakes tributaries and species at risk hotspots—Potential new concerns for endangered freshwater species: Biological Invasions, v. 12, no. 5, p. 1269–1284, accessed December 20, 2021, at https://doi.org/10.1007/s10530-009-9545-x.
R Core Team, 2021, R—A language and environment for statistical computing: R Foundation for Statistical Computing software, accessed December 2021 at https://www.r-project.org/.
Raab, D., Mandrak, N.E., and Ricciardi, A., 2018, Low-head dams facilitate round goby Neogobius melanostomus invasion: Biological Invasions, v. 20, no. 3, p. 757–776, accessed December 20, 2021, at https://doi.org/10.1007/s10530-017-1573-3.
Ruffing, R.A., 2004, The round goby botulism connection: New York Sea Grant College Program Great Lakes Botulism in Lakes Erie and Ontario research paper, 7 p., accessed August 5, 2022, at https://www.seagrant.sunysb.edu/botulism/pdfs/Proc04/7-BotProc04-RoundGoby.pdf.
Shannon, C.E., 1948, A mathematical theory of communication: Bell System Technical Journal, v. 27, no. 3, p. 379–423, accessed August 15, 2022, at https://doi.org/10.1002/j.1538-7305.1948.tb01338.x.
Simonson, T.D., Lyons, J., and Kanehl, P.D., 1994, Quantifying fish habitat in streams—Transect spacing, sample size, and a proposed framework: North American Journal of Fisheries Management, v. 14, no. 3, p. 607–615. [Also available at https://doi.org/10.1577/1548-8675(1994)014<0607:QFHIST>2.3.CO;2.]
Šlapanský, L., Janáč, M., Kevin, R., Libor, M., and Pavel, J., 2017, Expansion of round gobies in a non-navigable river system: Limnologica, v. 67, p. 27–36, accessed December 20, 2021, at https://doi.org/10.1016/j.limno.2017.09.001.
Steinhart, G.B., Stein, R.A., and Marschall, E.A., 2004, High growth rate of young-of-the-year smallmouth bass in Lake Erie—A result of the round goby invasion?: Journal of Great Lakes Research, v. 30, no. 3, p. 381–389, accessed December 20, 2021, at https://doi.org/10.1016/S0380-1330(04)70355-X.
U.S. Geological Survey, 2021a, Specimen observation data for Neogobius melanostomus (Pallas, 1814): U.S. Geological Survey Nonindigenous Aquatic Species Database data, https://nas.er.usgs.gov/queries/collectioninfo.aspx?SpeciesID=713.
U.S. Geological Survey, 2021b, StreamStats—Streamflow statistics and spatial analysis tools for water-resources applications: U.S. Geological Survey data, accessed December 20, 2021, at https://water.usgs.gov/osw/streamstats/newyork.html.
U.S. Geological Survey, 2021c, USGS water data for the nation: U.S. Geological Survey National Water Information System database, accessed December 20, 2021, at https://doi.org/10.5066/F7P55KJN.
U.S. Geological Survey, 2022, Specimen observation data for Percina caprodes (Rafinesque, 1818): U.S. Geological Survey Nonindigenous Aquatic Species Database data, accessed December 20, 2021, at https://nas.er.usgs.gov/queries/collectioninfo.aspx?SpeciesID=821.
Wolman, M.G., 1954, A method for sampling coarse river-bed material: Transactions - American Geophysical Union, v. 35, no. 6, p. 951–956. https://doi.org/10.1029/TR035i006p00951.
For more information, contact
Director, New York Water Science Center
U.S. Geological Survey
425 Jordan Road
Troy, NY 12180–8349
dc_ny@usgs.gov
or visit our website at
https://www.usgs.gov/centers/ny-water
Publishing support provided by the Pembroke Publishing Service Center
Suggested Citation
George, S.D., Winterhalter, D.R., and Baldigo, B.P., 2023, Survey of fish communities in tributaries to the Mohawk River, New York, 2019: U.S. Geological Survey Scientific Investigations Report 2022–5121, 37 p., https://doi.org/10.3133/sir20225121.
ISSN: 2328-0328 (online)
Study Area
| Publication type | Report |
|---|---|
| Publication Subtype | USGS Numbered Series |
| Title | Survey of fish communities in tributaries to the Mohawk River, New York, 2019 |
| Series title | Scientific Investigations Report |
| Series number | 2022-5121 |
| DOI | 10.3133/sir20225121 |
| Year Published | 2023 |
| Language | English |
| Publisher | U.S. Geological Survey |
| Publisher location | Reston, VA |
| Contributing office(s) | New York Water Science Center |
| Description | Report: vii, 37 p.; Data Release |
| Country | United States |
| State | New York |
| Other Geospatial | Mohawk River watershed |
| Online Only (Y/N) | Y |
| Additional Online Files (Y/N) | N |
| Google Analytic Metrics | Metrics page |