

Estimating Streamflow for Base Flow Conditions at Partial-Record Streamgaging Stations at Acadia National Park, Maine
Links
- Document: Report (1.33 MB pdf) , HTML , XML
- Data Release: USGS data release - Data and code to support MOVE.1 regression equations for streamflow at partial-record streamgaging stations at Acadia National Park, Maine:
- Download citation as: RIS | Dublin Core
Acknowledgments
The author would like to thank Bill Gawley of Acadia National Park and Nick Stasulis of the U.S. Geological Survey for their assistance in collecting, maintaining, and quality control of the data presented in this report. Thanks also to the numerous field technicians at Acadia National Park and U.S. Geological Survey for data collection.
Abstract
The objective of the work presented in this report is to develop equations that can be used to extend the base flow record at multiple partial-record streamgaging stations at Acadia National Park in eastern coastal Maine based on nearby continuous-record streamgaging stations. Daily mean streamflow values at U.S. Geological Survey continuous-record streamgaging station Otter Creek near Bar Harbor, Maine (station 01022840) had stronger correlations with instantaneous measurements during base flow conditions from 2006 to 2020 at 14 partial-record streamgaging stations at Acadia National Park than the other four continuous-record streamgaging stations tested for use as index stations. Index stations are continuous-record stations on hydrologically similar streams that have the potential to be used to extend the record at the partial-record station. Base flow is that part of streamflow that is sustained primarily by groundwater discharge. It is not attributable to direct precipitation or melting snow. Five of the partial-record stations had strong correlations with Otter Creek (correlation coefficient greater than 0.90) and relatively low root mean square errors (from 0.04 to 0.19). An additional four partial-record stations had fair correlations with Otter Creek (correlation coefficient from 0.79 to 0.9) and relatively low root mean square errors (from 0.05 to 0.19). For these 10 stations, maintenance of variance extension type 1 (MOVE.1) record extension equations computed in this report provide a reasonable method for extending the partial record, estimating summer monthly means and medians, and estimating daily mean streamflow values at these sites on days with no streamflow (discharge) measurements. Four of the partial-record stations have weak correlations (less than 0.78) or high root mean square error values (greater than 9) or both, indicating that record extension techniques are not appropriate for these partial-record stations using currently [2022] available data.
Introduction
The National Park Service (NPS) Acadia National Park has an essential need for timely and accurate surface water quantity data to support the water quality monitoring program at the park, guide park management decisions, inform facility and infrastructure replacement and maintenance projects, and to contribute to a growing number of water quality, fish and wildlife, and watershed ecology monitoring and research efforts by the NPS and collaborators. Water quantity data are critical to the interpretation of water quality issues. Water quantity data are fundamental for monitoring the physical status of freshwater ecosystems in order to evaluate the effects of climate change and extreme weather events on park resources and infrastructure. Acadia National Park staff initiated a systematic long-term water quantity streamgaging network in 2006 to meet one of the objectives of the NPS Inventory and Monitoring Program’s Northeast Temperate Network (NETN) protocols, most recently revised in 2016 (Gawley and others, 2016), to detect changes over time concerning the physical status of the lakes, ponds, and streams in NETN parks for example, streamflow (discharge) and stage (water height).
Operation of continuous-record streamgages is the best way to track surface-water quantity and to interpret water quality data. Continuous streamflow data can be used to calculate total amounts of analytes (primarily nutrients) over time (loads) compared with only calculating the instantaneous concentrations of analytes (primarily nutrients). Because the number of streams on which streamflow information was desired at Acadia National Park exceeded the number of continuous-record streamgages the park could maintain over the long term (years to decades), a network of partial-record streamgaging stations (partial-record stations) was established. For these streams in and near Acadia National Park, low-flow information can be estimated from continuous-record stations on hydrologically similar streams (index stations) based on the establishment of a correlation between streamflows at the partial-record station and streamflows at the index station. The index stations can provide useful information about missing streamflows or long-term streamflow statistics at the partial-record stations. Continuous-record stations with at least 15 years of record in eastern coastal Maine were tested for use as index stations. Correlation analyses and record extension techniques for partial-record stations at Acadia National Park have been conducted in previous analyses before (Nielsen, 2002) and after (Nielsen, 2013; Huntington and others, 2014a, b) the installation of U.S. Geological Survey (USGS) streamgage Otter Creek near Bar Harbor (0102280; fig. 1; table 1).
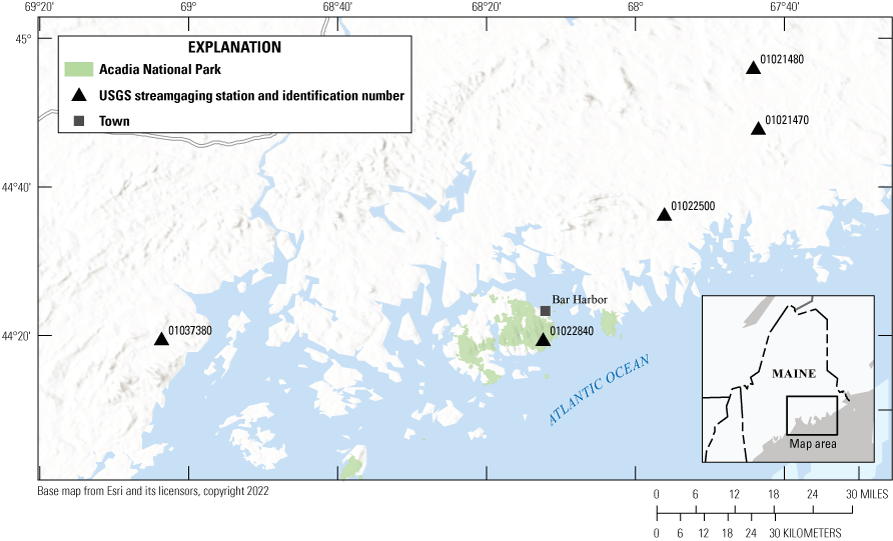
Map showing U.S. Geological Survey (USGS) continuous-record streamgaging stations tested for use as index stations in eastern coastal Maine.
The water quantity network initiated in 2006 at Acadia National Park now includes one continuous-record streamgage operated by the USGS (Otter Creek near Bar Harbor, Maine streamgage [station number 01022840; fig. 1; U.S. Geological Survey, 2022]) and 14 partial-record streamgages (fig. 2). The location for the continuous-record streamgage on Otter Creek was selected for continuous streamgaging in part based on its’ potential to function as an index station. Four additional long-term continuous-record streamgages in eastern coastal Maine were also tested for use as index stations (fig. 1; table 1).
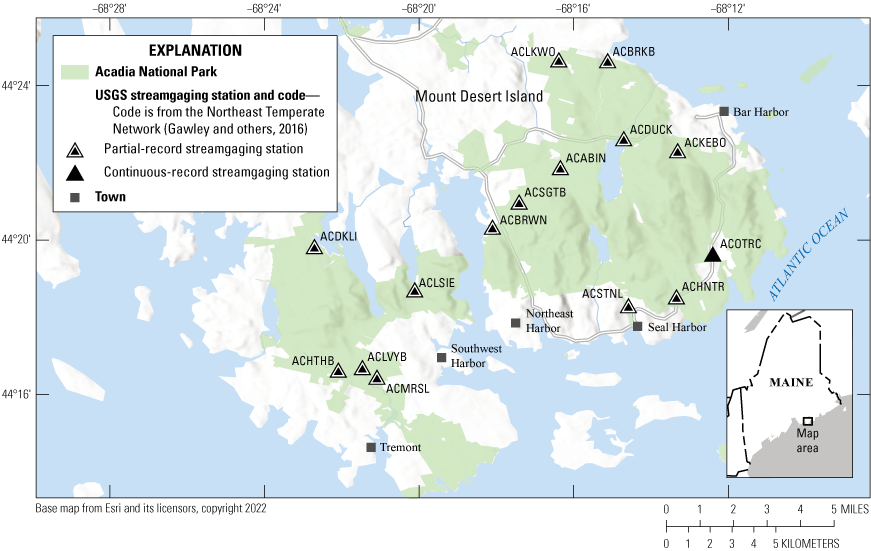
Map of continuous- and partial-record streamgaging stations at Acadia National Park in eastern coastal Maine. USGS, U.S. Geological Survey.
Table 1.
Continuous-record streamgages tested for use as potential index stations, eastern coastal Maine.[Data are from U.S. Geological Survey (2022). USGS, U.S. Geological Survey; ID, identifier; NAD83, North American Datum of 1983; ME, Maine; mi2, square mile]
| USGS ID (fig.1) | Name and location | Latitude, decimal degrees referenced to NAD 83 | Longitude, decimal degrees referenced to NAD 83 | Years of record | Drainage area (mi2) | Used as index station |
|---|---|---|---|---|---|---|
| 01021470 | Libby Brook near Northfield, ME | 44.8008 | −67.725 | 22 | 7.79 | No |
| 01021480 | Old Stream near Wesley, ME | 44.9369 | −67.7361 | 24 | 29.1 | No |
| 01022500 | Narraguagus River at Cherryfield, ME | 44.6081 | −67.9353 | 74 | 227 | No |
| 01022840 | Otter Creek near Bar Harbor, ME1 | 44.3278 | −68.2067 | 15 | 1.35 | Yes |
| 01037380 | Ducktrap River near Lincolnville, ME | 44.3292 | −69.0608 | 24 | 14.4 | No |
There are 14 partial-record stations in the park that are currently [2022] being operated and that were tested and described here to determine possible relations with long-term continuous record [potential index] streamgages (table 2). Establishing a regression relation between any individual partial-record station and a nearby continuous-record streamgage, such as Otter Creek, would allow Acadia National Park staff to estimate daily mean streamflow and selected streamflow statistics at the partial-record stations based on the relation with the index station based on a maintenance of variance extension type 1 (MOVE.1) methodology (Hirsch, 1982; Colarullo and others, 2018; Helsel and others, 2020).
Table 2.
Partial-record stations at Acadia National Park, eastern coastal Maine; streamflow measured from 2006 to 2020.[Data are from Lombard (2022); drainage area data are from the U.S. Geological Survey (USGS) National Water Information System (U.S. Geological Survey, 2022); data for years sampled are from Gawley and others, 2016). ID, identifier; NETN, Northeast Temperate Network; NAD83, North American Datum of 1983; mi2, square mile; ME, Maine]
| USGS streamgage ID | NETN code (fig. 2) | Streamgage name | Latitude, decimal degrees referenced to NAD 83 | Longitude, decimal degrees referenced to NAD 83 | Years sampled from 2006 to 2022 | Drainage area (mi2) |
|---|---|---|---|---|---|---|
| 01022808 | ACLKWO | Lake Wood Outlet near Bar Harbor, ME | 44.4116 | −68.27309 | Odd years | 0.62 |
| 01022825 | ACBRKB | Breakneck Brook near Bar Harbor, ME | 44.41123 | −68.25204 | Even years | 1.46 |
| 01022827 | ACDUCK | Duck Brook at outlet of Eagle Lake at Bar Harbor, ME | 44.37760 | −68.24509 | Odd years | 3.66 |
| 01022829 | ACKEBO | Kebo Brook near Bar Harbor, ME | 44.37241 | −68.22185 | Even years | 0.744 |
| 01022845 | ACHNTR | Hunters Brook near Seal Harbor, ME | 44.30939 | −68.22236 | Even years | 1.37 |
| 01022850 | ACSTNL | Stanley Brook near Seal Harbor, ME | 44.30556 | −68.24306 | All years1 | 1.36 |
| 01022866 | ACBRWN | Browns Brook near Northeast Harbor, ME | 44.33944 | −68.30169 | Odd years | 0.466 |
| 01022869 | ACABIN | Aunt Bettys Pond inlet near Bar Harbor, ME | 44.36512 | −68.27241 | Even years | 0.952 |
| 01022878 | ACLSIE | Lurvey Spring Brook-inflow to Echo Lake near Southwest Harbor, ME | 44.31242 | −68.33522 | Odd years2 | 0.64 |
| 01022890 | ACMRSL | Marshall Brook near Southwest Harbor, ME | 44.27474 | −68.35150 | Even years | 1.97 |
| 01022892 | ACLVYB | Lurvey Brook near Southwest Harbor, ME | 44.27889 | −68.35778 | Odd years | 0.105 |
| 01022895 | ACHTHB | Heath Brook near Tremont, ME | 44.27782 | −68.36817 | Even years | 0.910 |
| 010228665 | ACSGTB | Sargent Brook near Northeast Harbor, ME | 44.35029 | −68.29020 | Even years | 0.275 |
| 010228755 | ACDKLI | Duck Pond Brook inlet to Long Pond near Southwest Harbor, ME | 44.33108 | −68.37847 | Odd years | 0.420 |
The objective of this work is to develop equations that can be used to extend the base flow record at multiple partial-record stations at Acadia National Park. An inability to correlate an individual partial-record station with an index station could help Acadia National Park staff adjust the stream-monitoring network to ensure that the network continues to meet Acadia National Park water quality objectives outlined in Gawley and others (2016).
Acadia National Park in eastern coastal Maine protects 47,498 acres, including 30,300 acres on Mount Desert Island. There are more than 24 streams, 14 great ponds and lakes (greater than 10 acres), and 9 small ponds partially or entirely within Acadia National Park. All brooks, streams, and segments of brooks and streams that are within the boundaries of Acadia National Park are designated as outstanding national resource waters (ONRWs) that must be maintained and protected as class AA waters; free-flowing and natural; and the aquatic life, dissolved oxygen, and bacteria content of class AA waters shall be as naturally occurring (Maine State Government, 2007). The characterization of naturally occurring streamflows and water quality in streams of Acadia National Park is a vital component of their ONRW designation.
Methods of Data Collection and Analysis
Data Collection and Screening
USGS continuous-record streamgages were tested for use as potential index streamgages to extend the record of the partial-record stations. Potential index streamgages are currently [2022] in operation, with a minimum of 10 years of streamgaging record, and are located in or near eastern coastal Maine. Data typically include stage (surface-water height) data collected and stored every 5 to 15 minutes, and streamflow data calculated using a stage-discharge rating curve (Sauer, 2002). All continuous streamgaging data can be accessed in the USGS National Water Information System (U.S. Geological Survey, 2022). Methods for determining streamflow (discharge) at continuous-record streamgages can be found in Rantz and others (1982), Sauer and Turnipseed (2010), and Turnipseed and Sauer (2010).
Instantaneous stage and streamflow were measured monthly at partial-record stations at Acadia National Park from May to October either annually or biennially from 2006 through 2020 (Gawley and others, 2016). Streamflow measurements were made by NPS staff as part of the NETN program and are available in Lombard (2022). NPS staff were trained by USGS hydrologists and applied USGS methods for making streamflow measurements following Rantz and others (1982), Sauer and Turnipseed (2010), and Turnipseed and Sauer (2010).
The establishment of a correlation between an index station and a partial-record station depends on only using streamflow (discharge) measurements made during base flow conditions. Summer thundershowers can be extremely localized and direct runoff from a rainstorm measured at the index station would not be expected to correlate with base flow at a partial-record station. Although it is difficult to know when base flow occurred at a partial-record station, an automated hysteresis screening analysis was used to identify and eliminate daily mean flows that reflected direct runoff at the index station. The identification of base flow at the index station depends on changes in the daily mean flow during the 3 previous days based on a hysteresis function in R (smwrBase, R Core Team, 2020). Daily values that were greater than the annual median flow were also removed as a part of this function. If direct runoff was detected at the index station, then that daily mean streamflow at the index station and the corresponding instantaneous measurements at the partial-record station were removed from these analyses.
Very low flows (less than 0.01 cubic foot per second [ft3/s]) are difficult to measure accurately, and thus, these flows are included with the 0 flow observations for the purposes of performing these analyses. It is not possible to perform logarithmic transformations on 0 flows. Zero flow observations were used to determine the probability of an estimate being 0 at the partial-record station but were removed prior to conducting the correlation analyses and computing the MOVE.1 equations. Partial-record station measurements were not included in analyses if these measurements included low velocities or did not meet minimum measurement criteria for depths or number of measurement sections.
Statistical Analyses
Correlations Between Partial-Record Stations and Index Stations
The use of a long-term continuous-record streamgage (index streamgage) to extend the record at a partial-record station depends on establishing a correlation between the daily mean streamflow at the index streamgage and instantaneous streamflow measurements at the partial-record station on the concurrent day. Daily mean streamflows at potential index streamgages are computed as the arithmetic mean of the streamflows associated with the recorded stages for each day. Streamflow data are highly skewed and thus, a common logarithm (log10) transformation was performed to linearize data at both the potential index streamgage and the partial-record station prior to calculating correlations.
A Pearson’s R correlation coefficient was calculated for each index-station and partial-record station pair. The most appropriate index station to extend the record at each partial-record station was determined through the use of a correlation coefficient and plots of the correlations (fig. 3). All analyses were completed using the R programming language (R Core Team, 2020; De Cicco and others, 2021).
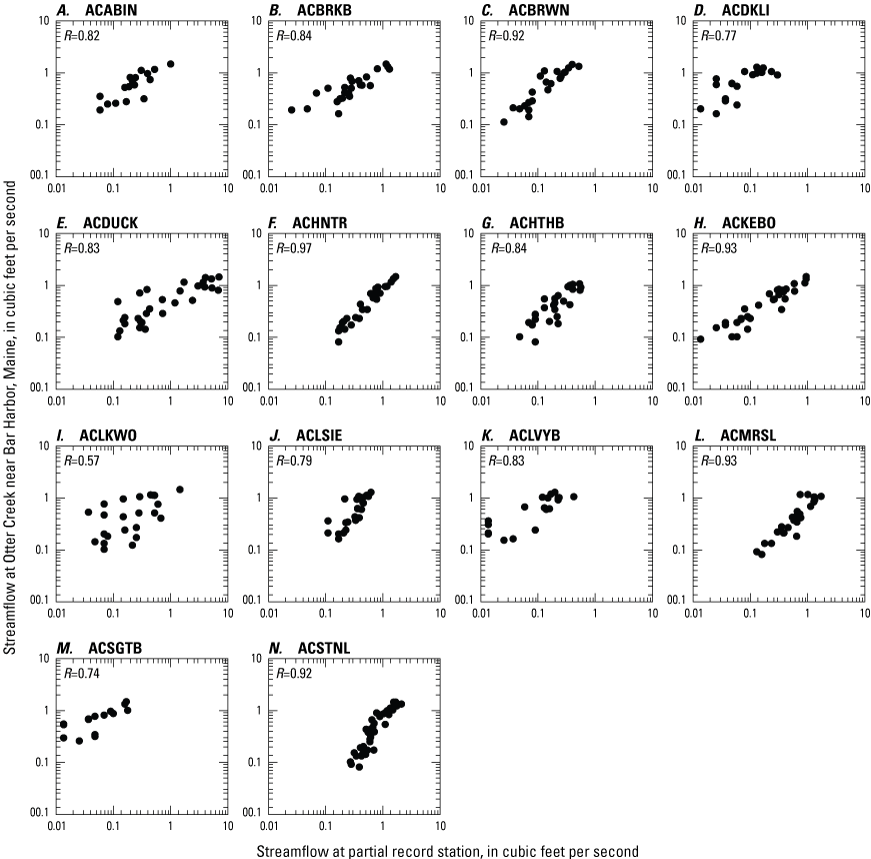
Graphs showing correlations between 14 partial-record stations at Acadia National Park, eastern coastal Maine, and the index station, U.S. Geological Survey Otter Creek near Bar Harbor, Maine streamgage (01022840). Stations listed in table 2.
Probability of Zero Streamflow
Ideally, a logistic regression would be used to determine the probability of the streamflow estimate or streamflow statistic at the partial-record station being 0 prior to the MOVE.1 record extension. If the probability of 0 streamflow is greater than 0.5, then 0 streamflow is estimated for the daily mean streamflow or for the streamflow statistic. If the probability of 0 streamflow is less than 0.5 and there is a greater than 50-percent chance of there being streamflow, then a MOVE.1 record extension equation can be used to estimate streamflow at the partial-record stations for the daily mean streamflow or the streamflow statistic. A logistic regression was not meaningful for the analyses presented here because of the small percentage of 0 streamflow observations. Thus, the probability of zero streamflow was determined graphically prior to making an estimate of streamflow or a streamflow statistic at the partial-record station.
Record Extensions Using MOVE.1
MOVE.1 record extension equations were developed here to estimate streamflows and streamflow statistics at the partial-record stations based on streamflows and streamflow statistics at the index station. Log-transformed instantaneous streamflow measurements from the partial-record station (dependent variable), and the concurrent log-transformed daily mean streamflow at the index stations (independent variable) were used to develop the MOVE.1 equations with the R programming language using the smwrStats package (Lorenz, 2015; R Core Team, 2020; U.S. Geological Survey, undated). Zero and very low (less than 0.01 ft3/s) flows were removed prior to the MOVE.1 analyses after the logistic regression determined that the log-transformed daily mean streamflow had a less than 0.5 probability of being 0. The form of the equation is
whereQPR
is the estimated streamflow statistic at the partial-record station, in cubic feet per second;
log10
is the common logarithm (base 10);
a
is the regression intercept;
b
is the regression slope coefficient; and
QI
is the corresponding streamflow statistic at the index station, in cubic feet per second.
The MOVE.1 record extensions were evaluated using R2 and root mean square error (RMSE) metrics. The R2 is the proportion of the variance in the response variable that can be explained by the predictor variable. R2 is the square of the correlation coefficient between the partial-record station and the index station (Helsel and others, 2020). The RMSE gives an indication of the difference between the observed values at the partial-record stations and the predicted values calculated with the MOVE.1 equations.
Extending the Records at Partial-Record Stations by Use of Continuous-Record Streamgages
Testing of Continuous-Record Streamgages for Use as Index Stations
Five USGS continuous-record streamgages were tested for use as potential index streamgages, including the Libby Brook near Northfield, Maine (01021470), Old Stream near Wesley, Maine (01021480), Narraguagus River at Cherryfield, Maine (01022500), Otter Creek near Bar Harbor, Maine (01022840), and Ducktrap River near Lincolnville, Maine (01037380) streamgages (fig. 1; table 1). Potential index stations contained from 16 to 74 years of continuous streamflow record (U.S. Geological Survey, 2022).
Fourteen partial-record stations were analyzed as a part of this work (fig. 2; table 2). Although there were originally additional sites, the following adjustments have been made to the streamgage network since its beginning in 2006. The original Duck Brook station (ACEGLO), downstream from the dam at the outlet of Eagle Lake, was sampled only during 2007. The station location proved difficult to measure for streamflow, and water quality measurements were more representative of the lake than the contributions of the stream watershed; thus, the Duck Brook (ACEGLO) monitoring station was moved approximately 650 feet (ft) downstream, on the opposite (northern) side of State Route 233. The site was given a new code (ACDUCK) to distinguish it from the Eagle Lake outlet station (ACEGLO; not listed in table 2). The USGS determined that the relocated station did not require a new station number for their records and records from ACEGLO and ACDUCK were combined for this analysis.
Sampling at the Man of War Brook (ACMOWB) station was discontinued in 2011 when the fire road used for vehicle access to the site became impassable and was not scheduled for repair. Also, effective starting in 2011, measurements from the Lurvey Spring Brook (ACLSIE) station were switched to odd years rather than even years and measurements from the Stanley Brook (ACSTNL) station were switched from odd years to annual. Concerns about potential effects from residential development in the watershed made the Stanley Brook watershed a good candidate for annual water quality sampling.
Sampling at the Bubble Pond outlet (ACBUBO) and Jordan Pond outlet (ACJRDO) stations was discontinued after 2013 because both these stations are immediately adjacent to lake outflows and flows are captured by the lake monitoring. Additional details concerning measurements at the partial-record stations can be found in Gawley and others (2016).
The 14 remaining partial-record stations analyzed for this study initially each had from 41 to 71 instantaneous measurements (fig. 2; table 3). Five measurements were removed because of measurement irregularities after being flagged for their extreme outlier status identified visually during graphical analyses. Twenty-nine 0 or very low (less than 0.01 ft3/s) flows were removed at eight different partial-record stations following the logistic-regression analysis and prior to performing correlations and MOVE.1 analyses. Additional instantaneous measurements at the partial-record stations were excluded if corresponding daily mean flow at the index station was not during a period of base flow. After irregular outliers, 0 and very low flows, and measurements made during periods of direct runoff at the index station were removed, there were from 15 to 40 instantaneous measurements at each of the 14 unique sites remaining for analyses (table 2).
Correlations Between the Partial-Record Stations and the Tested Index Stations
Correlation coefficients describe the strength of the relation between the instantaneous streamflows at the partial-record stations and the daily mean flows at the most appropriate index station and represent the strength and direction of the linear relation between the two variables. Correlation coefficients similar to those listed in table 3 and graphs similar to those in figure 3 were evaluated in this analysis. It was determined that all 14 partial-record stations correlated better with the index station (Otter Creek near Bar Harbor, Maine [01022840; fig. 1]) than with the other tested index stations. Correlation coefficients between the partial record stations and the index stations ranged from 0.57 to 0.97 (table 3).
Table 3.
Statistics for estimating average streamflows for May through September for Acadia National Park in eastern coastal Maine for partial-record stations.[Data are from U.S. Geological Survey (2022). Statistics are based on the index station, U.S. Geological Survey (USGS) station 01022840, Otter Creek near Bar Harbor, Maine; location of index station shown on figure 1. ID, identifier; NETN, Northeast Temperate Network; ft3/s, cubic foot per second; MOVE.1, maintenance of variance record extension technique; Q_PR, streamflow or streamflow statistic at the partial-record station; Q_Otter, streamflow or streamflow statistic at the index station; R2, the proportion of the variance in the response variable that can be explained by the predictor variable (the square of the correlation coefficient); RMSE, root mean square error; NA, not applicable because of poor correlations with all tested index stations]
| USGS streamgage ID | NETN code (fig. 2) | Correlation between partial-record station and Otter Creek | Number of measurements used in correlation | Number of 0 flow observations (flows from 0 to 0.009 ft3/s)1 | MOVE.1 equation | R2 | RMSE |
|---|---|---|---|---|---|---|---|
| 01022808 | ACLKWO | 0.57 | 23 | 0 | NA | NA | NA |
| 01022825 | ACBRKB | 0.85 | 27 | 3 | Q_PR = 0.7488×Q_Otter1.6122 | 0.72 | 0.1256 |
| 01022827 | ACDUCK | 0.83 | 29 | 0 | NA | NA | NA |
| 01022829 | ACKEBO | 0.93 | 30 | 0 | Q_PR = 0.5609×Q_Otter1.3981 | 0.87 | 0.0723 |
| 01022845 | ACHNTR | 0.97 | 27 | 0 | Q_PR = 1.149×Q_Otter0.8921 | 0.94 | 0.0871 |
| 01022850 | ACSTNL | 0.92 | 40 | 0 | Q_PR = 1.3419×Q_Otter0.6121 | 0.84 | 0.1641 |
| 01022866 | ACBRWN | 0.92 | 23 | 1 | Q_PR = 0.231×Q_Otter1.0473 | 0.84 | 0.0452 |
| 01022869 | ACABIN | 0.82 | 22 | 5 | Q_PR = 0.4158×Q_Otter1.2538 | 0.68 | 0.0960 |
| 01022878 | ACLSIE | 0.79 | 26 | 1 | Q_PR = 0.4706×Q_Otter0.7188 | 0.63 | 0.0668 |
| 01022890 | ACMRSL | 0.93 | 27 | 0 | Q_PR = 1.4329×Q_Otter0.8796 | 0.86 | 0.1904 |
| 01022892 | ACLVYB | 0.82 | 25 | 6 | Q_PR = 0.1758×Q_Otter1.4536 | 0.68 | 0.0520 |
| 01022895 | ACHTHB | 0.84 | 28 | 1 | Q_PR = 0.4417×Q_Otter0.951 | 0.71 | 0.0640 |
| 010228665 | ACSGTB | 0.76 | 20 | 5 | NA | NA | NA |
| 010228755 | ACDKLI | 0.77 | 27 | 7 | NA | NA | NA |
MOVE.1 Record Extension Equations for Use at Partial-Record Stations
Eight of the 14 partial-record stations described in this report had observations of 0 streamflow during the monthly visits from May to September from 2006 to 2020. Between one and seven 0 streamflow observations were made at these stations (table 3). Because a logistic regression was not meaningful with so few 0 streamflow observations, the probability of whether any given estimate of a streamflow statistic would be 0 was determined graphically. Neither the mean nor the median at any of the partial-record stations would likely be 0 (fig. 3). This determination allowed the use of the MOVE.1 equations to estimate summer monthly means and medians at the partial-record stations.
MOVE.1 equations were initially developed at 11 of the 14 partial-record stations to estimate base flows and base-low statistics from May through September at the partial-record stations based on instantaneous measurements at the partial-record station and the concurrent daily mean flow at the index station (table 3). The MOVE.1 equations presented here have R2 values between 0.63 and 0.94, and RMSE values between 0.05 and 0.19.
MOVE.1 equations were not developed for three sites (ACLKWO, ACSGTB, and ACDKLI; fig. 2) based on their low correlation coefficients (less than 0.79) and the correlation plots that indicated a weak relation between the partial-record station and the index station (fig. 3). After evaluating the MOVE.1 equation diagnostics, the equation for ACDUCK had a RMSE value that was problematic (1.29) for determining the relation, and that equation was not used for developing streamflow statistics and is not included here. The remaining 10 MOVE.1 equations given in table 3 were used to develop monthly streamflow statistics from May through September for those stations (table 4) and can be used to estimate daily mean streamflows from May to September at the partial-record stations given a daily mean streamflow taken during a period of base flow at Otter Creek near Bar Harbor index streamgage. All values were log10 transformed prior to the development of the MOVE.1 equations; however, the equations in table 3 take the transformation into account so input and output values in the equation are straight values (not logarithmically transformed).
Table 4.
Monthly mean and median streamflow values from May to September for streamgages in Acadia National Park in eastern coastal Maine.[Computed at the U.S. Geological Survey (USGS) streamgage at Otter Creek at Bar Harbor, Maine (streamgage 01022840) from daily streamflow values and at 14 partial-record stations computed by use of the maintenance of variance extension type 1 (MOVE.1) equations. Locations of streamgages are shown in figure 1 and 2. Data are from U.S. Geological Survey (2022). ID, identifier; NETN, Northeast Temperate Network; ft3/s, cubic foot per second]
| USGS streamgage ID | NETN code (fig. 2) | Mean streamflow (ft3/s) | Median streamflow (ft3/s) | ||||||||
|---|---|---|---|---|---|---|---|---|---|---|---|
| May | June | July | August | September | May | June | July | August | September | ||
| Index station | |||||||||||
| 01022840 | ACOTRC | 4.19 | 4.53 | 1.91 | 1.48 | 2.22 | 2.08 | 1.22 | 0.6 | 0.35 | 0.34 |
| Partial-record stations | |||||||||||
| 01022869 | ACABIN | 2.51 | 2.76 | 0.94 | 0.68 | 1.13 | 1.04 | 0.53 | 0.22 | 0.11 | 0.11 |
| 01022825 | ACBRKB | 7.54 | 8.56 | 2.13 | 1.40 | 2.72 | 2.45 | 1.03 | 0.32 | 0.14 | 0.13 |
| 01022866 | ACBRWN | 1.04 | 1.12 | 0.46 | 0.35 | 0.53 | 0.5 | 0.28 | 0.13 | 0.08 | 0.07 |
| 01022845 | ACHNTR | 4.13 | 4.42 | 2.05 | 1.63 | 2.34 | 2.21 | 1.37 | 0.72 | 0.45 | 0.44 |
| 01022895 | ACHTHB | 1.73 | 1.86 | 0.82 | 0.64 | 0.94 | 0.89 | 0.53 | 0.27 | 0.16 | 0.16 |
| 01022829 | ACKEBO | 4.16 | 4.64 | 1.39 | 0.97 | 1.71 | 1.57 | 0.74 | 0.27 | 0.13 | 0.12 |
| 01022878 | ACLSIE | 1.32 | 1.39 | 0.75 | 0.62 | 0.84 | 0.8 | 0.54 | 0.32 | 0.22 | 0.22 |
| 01022892 | ACLVYB | 1.41 | 1.58 | 0.45 | 0.31 | 0.56 | 0.51 | 0.23 | 0.08 | 0.04 | 0.04 |
| 01022890 | ACMRSL | 5.05 | 5.41 | 2.53 | 2.02 | 2.89 | 2.73 | 1.71 | 0.91 | 0.57 | 0.55 |
| 01022850 | ACSTNL | 3.23 | 3.38 | 2.00 | 1.70 | 2.19 | 2.1 | 1.52 | 0.98 | 0.71 | 0.69 |
May through September monthly means and medians at the index station Otter Creek near Bar Harbor (USGS 0102280) were computed from daily mean flow values for these months (table 4). May through September monthly means and medians at the partial-record stations were computed using the MOVE.1 equations (table 4), if applicable.
Limitations and Uncertainty
There are limitations and uncertainty to the record extensions done as a part of this work related to the single reasonable index station within the study area, the relatively small number of years of record (16 years) at the index station for computing long-term means and medians, and the limited number of partial-record station measurements. Monthly measurements at the partial-record stations were only collected in the months of May through September, and, therefore, the MOVE.1 regression equations do not apply outside of these months. The equations are the best currently [2022] available but should be expected to change as additional data are collected at the partial-record stations and at the index station Otter Creek near Bar Harbor, Maine.
Although correlations and record-extending MOVE.1 equations were established between 10 of the partial-record stations and the Otter Creek index station, the accuracy of these equations is reflected in the diagnostic R2 values, and RMSE. It is up to the user to determine whether the accuracy of the equations is sufficient for the intended purposes of the streamflow estimates.
Estimated Streamflow at Acadia National Park
The Otter Creek near Bar Harbor, Maine (01022849) streamgage was established as a continuous-record streamgage on Mount Desert Island (fig. 2), in part because of its potential to function as an index station for the partial-record stations in the NETN water quality and water quantity station network at Acadia National Park. Although 15 years of data had been collected at Otter Creek and at the partial-record stations, the study in this report is the first comprehensive analysis to determine which of the 14 partial-record stations could use Otter Creek as an index station for record extension. One goal of this work was to determine if streamflow at the Otter Creek station correlates with enough partial-record stations to justify its continuation as an index station. Another goal was to analyze data at the partial-record stations to ensure that the data were of sufficient quality and quantity to support NETN stream monitoring protocol objectives (Gawley and others, 2016) and determine if other potential index streamgages could be used to extend the records of partial-record streamgages that did not correlate well with the Otter Creek station.
The Otter Creek streamgage station (01022840; fig. 1) performed better as an index station than did any other tested index station. Ideally, index stations are proximate to their paired partial-record station and have similar drainage areas and other watershed characteristics. It makes physical sense that Otter Creek correlates best with the partial-record stations because it is the only continuous-record streamgage on Mount Desert Island tested for use as an index station and it was specifically established for its potential to function as an index station. In addition, Otter Creek has the smallest drainage area (1.35 square miles [mi2]) of all the potential index stations and, thus, the Otter Creek station is more similar in size to the partial-record stations, which have drainage areas between 0.275 and 3.66 mi2 (table 2). Drainage areas of the other potential index stations range from 7.79 to 227 mi2 (table 1).
The Otter Creek station performs extremely well as an index station at ACKEBO, ACHNTR, ACSTNL, ACBRWN, and ACMRSL with correlation coefficients greater than 0.90, and R2 values all greater than or equal to 0.84; relatively low RMSEs; and graphs that show good linear relation with few outliers (fig. 3; table 3). Otter Creek station (01022840) performs reasonably well as an index station at ACBRKB, ACABIN, ACLSIE, ACLVYB, and ACHTHB with correlation coefficients between 0.79 and 0.85, R2 values between 0.63 and 0.72, RMSEs between 0.05 and 0.12, and graphs that show reasonable linear relations with few outliers. MOVE.1 equations are included for these stations, but it is important to note that a fair amount of the variance is not explained by the equation, and thus, higher errors should be expected. ACLKWO, ACSGTB, and ACDKLI had correlation coefficients less than 0.79 and graphs with a large degree of scatter; thus, MOVE.1 equations were not developed. Although a MOVE.1 equation was developed for ACDUCK, the RMSE value of 1.29 at ACDUCK is an order of magnitude higher than the RMSE of all other model equations. Even after removing the measurements that were originally part of ACEGLO that were combined with ACDUCK, the RMSE for the MOVE.1 equations is still higher than that of all other equations. ACDUCK has 25 percent storage in the watershed, which is over twice as much storage as any other station. Otter Creek near Bar Harbor index streamgage has 4.6 percent storage in the watershed. A MOVE.1 equation for ACDUCK is not included based on its high RMSE (9.5).
It is important to note that the MOVE.1 analyses will not work well if the index station is evaluated during a period of direct runoff. The establishment of base flow conditions can necessitate performing a hysteresis analysis or a visual examination of the hydrograph. If the equations are used to obtain estimates at the partial -record stations that require more certainty, a visual examination of the hydrograph will help ensure that the estimate at the partial-record station is valid.
Summary and Conclusions
There is an essential need at Acadia National Park in eastern Maine for timely and accurate surface water quantity data to support the water quality monitoring program and to inform management decisions at the park. The objective of the work completed by the U.S. Geological Survey, in cooperation with the National Park Service, and presented in this report, is to develop equations that can be used to extend the base flow record (base flow is that part of streamflow that is sustained primarily by groundwater discharge) at multiple partial-record streamgaging stations at Acadia National Park based on nearby continuous-record streamgaging stations.
Correlations were tested for 14 partial-record streamgaging stations at Acadia National Park in eastern coastal Maine and 5 continuous-record streamgaging stations with at least 15 years of streamflow (discharge) record. Maintenance of variance extension type 1 (MOVE.1) record extension equations were used to provide a reasonable method for extending the partial record. All the 14 partial-record stations correlated most strongly with continuous-record station Otter Creek near Bar Harbor, Maine (0102280) on Mount Desert Island, validating its use as an index station. Otter Creek near Bar Harbor, Maine, can be used as an index station likely because of its proximity to the partial-record stations and its small drainage area (1.35 square miles) that is similar to drainage areas of the partial-record stations (between 0.1 and 3.7 square miles). Four of the partial-record stations did not correlate strongly with any potential index station tested.
MOVE.1 analyses will not work well if the index station is considered during a period of direct runoff. The establishment of base flow conditions can necessitate performing a hysteresis analysis or a visual examination of the base flow hydrograph. If the equations are used to obtain estimates at the partial-record stations that require more certainty, a visual examination of the hydrograph will help ensure that the estimate at the partial-record station is valid.
Monthly streamflow statistics for May through September, and MOVE.1 streamflow record extension equations are presented here for 10 of the 14 stations based on the strength of the correlations with the index station, and the diagnostics from tested equations. It is beneficial to continue to confirm correlations and recompute MOVE.1 record extension equations and monthly streamflow statistics over time because these statistics can shift.
References Cited
Colarullo, S.J., Sullivan, S.L., and McHugh, A.R., 2018, Implementation of MOVE.1, censored MOVE.1, and piecewise MOVE.1 low-flow regressions with applications at partial-record streamgaging stations in New Jersey: U.S. Geological Survey Open-File Report 2018–1089, 20 p., accessed May 20, 2022, at https://doi.org/10.3133/ofr20181089.
De Cicco, L., Lorenz, D., Hirsch, R., Watkins, W., and Johnson, M., 2021, dataRetrieval—R packages for discovering and retrieving water data available from U.S. federal hydrologic web services: U.S. Geological Survey software, accessed August 20, 2021, at https://code.usgs.gov/water/dataRetrieval.
Gawley, W.G., Mitchell, B.R., and Arsenault, E.A., 2016, Northeast Temperate Network lakes, ponds, and streams monitoring protocol—2015 revision: National Park Service Natural Resource Report NPS/NETN/NRR—2016/1225, 405 p., accessed June 21, 2022, at https://irma.nps.gov/DataStore/DownloadFile/552318.
Helsel, D.R., Hirsch, R.M., Ryberg, K.R., Archfield, S.A., and Gilroy, E.J., 2020, Statistical methods in water resources: U.S. Geological Survey Techniques and Methods, book 4, chap. A3, 458 p., accessed June 21, 2022, at https://doi.org/10.3133/tm4A3. [Supersedes U.S. Geological Survey Techniques of Water-Resources Investigations, book 4, chap. A3, version 1.1.]
Hirsch, R.M., 1982, A comparison of four streamflow record extension techniques: Water Resources Research, v. 18, no. 4, p. 1081–1088, accessed June 19, 2022, at https://doi.org/10.1029/WR018i004p01081.
Huntington, T.G., Culbertson, C.W., Fuller, C., Glibert, P., and Sturtevant, L., 2014a, Nutrient budgets, marsh inundation under sea-level rise scenarios, and sediment chronologies for the Bass Harbor Marsh estuary at Acadia National Park: U.S. Geological Survey Open-File Report 2014–1031, 108 p., accessed June 22, 2022, at https://doi.org/10.3133/ofr20141031.
Huntington, T.G., Culbertson, C.W., Fuller, C., Glibert, P., and Sturtevant, L., 2014b, The relative importance of oceanic nutrient inputs for Bass Harbor Marsh Estuary at Acadia National Park, Maine: U.S. Geological Survey Scientific Investigations Report 2014–5123, 19 p., accessed June 22, 2022, at https://doi.org/10.3133/sir20145123.
Lombard, P.J., 2022, Data and code to support MOVE.1 regression equations for streamflow at partial-record streamgaging stations at Acadia National Park, Maine: U.S. Geological Survey data release, https://doi.org/10.5066/P9ZP8XHG.
Lorenz, D.L., 2015, smwrBase—An R package for managing hydrologic data, version 1.1.1: U.S. Geological Survey Open-File Report 2015–1202, 7 p., accessed May 23, 2021, at https://doi.org/10.3133/ofr20151202.
Maine State Government, 2007, §465. Standards for classification of fresh surface waters, in Title 38. Waters and navigation: Maine Revised Statutes, accessed August 21, 2022, at http://www.mainelegislature.org/legis/statutes/38/title38sec465.html.
Nielsen, M.G., 2002, Water budget for and nitrogen loads to Northeast Creek, Bar Harbor, Maine: U.S. Geological Survey Water-Resources Investigations Report 02–4000, 32 p., accessed June 13, 2022, at https://doi.org/10.3133/wri024000.
Nielsen, M.G., 2013, Changes in nitrogen loading to the Northeast Creek Estuary, Bar Harbor, Maine, 2000 to 2010: U.S. Geological Survey Open-File Report 2013–1256, 33 p., accessed June 13, 2022, at https://doi.org/10.3133/ofr20131256.
R Core Team, 2020, R—A language and environment for statistical computing—Version 4.0.2, R Foundation for Statistical Computing web page, accessed May 15, 2022, at http://www.r-project.org/index.html.
Rantz, S.E., and others, 1982, Measurement and computation of streamflow: U.S. Geological Survey Water-Supply Paper 2175, 2 v., 631 p., accessed March 3, 2022, at https://doi.org/10.3133/wsp2175.
Sauer, V.B., 2002, Standards for the analysis and processing of surface-water data and information using electronic methods: U.S. Geological Survey Water-Resources Investigations Report 01–4044, 91 p., accessed March 20, 2019, at https://doi.org/10.3133/wri20014044.
Sauer, V.B., and Turnipseed, D.P., 2010, Stage measurement at gaging stations: U.S. Geological Survey Techniques and Methods, book 3, chap. A7, 45 p., accessed March 20, 2019, at https://doi.org/10.3133/tm3A7.
Turnipseed, D.P., and Sauer, V.B., 2010, Discharge measurements at gaging stations: U.S. Geological Survey Techniques and Methods, book 3, chap. A8, 87 p., accessed March 20, 2019, at https://doi.org/10.3133/tm3A8.
U.S. Geological Survey, 2022, USGS water data for the nation: U.S. Geological Survey National Water Information System website, accessed February 2022 at https://doi.org/10.5066/F7P55KJN.
U.S. Geological Survey, [undated], USGS–R/smwrStats: U.S. Geological Survey data repository, accessed May 15, 2022, at https://github.com/USGS-R/smwrStats.
Datums
Vertical coordinate information is referenced to the North American Vertical Datum of 1988 (NAVD 88).
Horizontal coordinate information is referenced to the North American Datum of 1983 (NAD 83).
For more information, contact
Director, New England Water Science Center
U.S. Geological Survey
10 Bearfoot Road
Northborough, MA 01532
dc_nweng@usgs.gov
or visit our website at
https://www.usgs.gov/centers/new-england-water
Publishing support provided by the Pembroke and Sacramento Publishing Service Centers
Suggested Citation
Lombard, P.J., 2023, Estimating streamflow for base flow conditions at partial-record streamgaging stations at Acadia National Park, Maine: U.S. Geological Survey Scientific Investigations Report 2022–5126, 13 p., https://doi.org/10.3133/sir20225126.
ISSN: 2328-0328 (online)
Study Area
| Publication type | Report |
|---|---|
| Publication Subtype | USGS Numbered Series |
| Title | Estimating streamflow for base flow conditions at partial-record streamgaging stations at Acadia National Park, Maine |
| Series title | Scientific Investigations Report |
| Series number | 2022-5126 |
| DOI | 10.3133/sir20225126 |
| Year Published | 2023 |
| Language | English |
| Publisher | U.S. Geological Survey |
| Publisher location | Reston, VA |
| Contributing office(s) | New England Water Science Center |
| Description | Report: vi, 13 p.; Data Release |
| Country | United States |
| State | Maine |
| Other Geospatial | Acadia National Park |
| Online Only (Y/N) | Y |
| Additional Online Files (Y/N) | N |
| Google Analytic Metrics | Metrics page |