

Groundwater Quality in the Mohawk and Western New York River Basins, New York, 2016
Links
- Document: Report (19.3 MB pdf) , HTML , XML
- Data Release: USGS data release - Groundwater quality data from the Mohawk and western New York River Basins, New York, 2016
- Download citation as: RIS | Dublin Core
Acknowledgments
The authors extend thanks and appreciation to all well owners who took the time to respond to our request to sample their wells and to those who gave permission and facilitated that sampling. Thanks are also extended to our contacts at the New York State (NYS) Department of Environmental Conservation, NYS Department of Health, county departments of health, and to all of the public water-supply personnel who provided information and help with this study. Additionally, the authors would like to extend thanks and appreciation to U.S. Geological Survey colleagues Michael Izdebski, David Knauer, and Benjamin Fisher for their work collecting the samples.
Abstract
Water samples were collected from July through December 2016 from 9 production wells and 13 domestic wells in the Mohawk River Basin, and from 17 production wells and 17 domestic wells in the western New York River Basins. The samples were collected and processed by using standard U.S. Geological Survey methods and were analyzed for 320 physicochemical properties and constituents, including dissolved gases, major ions, nutrients, trace elements, pesticides, volatile organic compounds, radionuclides, and indicator bacteria, to characterize groundwater quality in the basins. Analytical results are provided in the companion U.S. Geological Survey data release titled “Groundwater Quality Data From the Mohawk and Western New York River Basins, New York, 2016.”
The Mohawk River Basin study area covers 3,500 square miles in New York. Of the 22 wells sampled in the Mohawk River Basin, 8 are completed in sand and gravel, and 14 are completed in bedrock aquifers. Most constituents in the samples from the Mohawk River Basin were present in concentrations below the maximum contaminant levels used in public supply drinking-water regulations by the New York State Department of Health and the U.S. Environmental Protection Agency. Values for some of the properties and concentrations of some constituents—pH, color, iron, manganese, aluminum, sodium, chloride, dissolved solids, radon-222, and heterotrophic plate count—sometimes equaled or exceeded primary, secondary, or proposed drinking-water standards.
The western New York River Basins study area covers 5,340 square miles in western New York and includes parts of the Lake Erie and Niagara River Basins, the western Lake Ontario Basin (between the Niagara River and Genesee River Basins), and the Allegheny River Basin. Of the 34 wells sampled in the western New York River Basins, 16 are completed in sand and gravel, and 18 are completed in bedrock aquifers. Most constituents in the samples from the western New York River Basins were present in concentrations below the maximum contaminant levels used in public supply drinking-water regulations by the New York State Department of Health and the U.S. Environmental Protection Agency. Values for some of the properties and concentrations of some constituents—color, chloride, sodium, dissolved solids, iron, manganese, aluminum, arsenic, barium, radon-222, methane, total coliform bacteria, fecal coliform bacteria, and Escherichia coli bacteria—sometimes equaled or exceeded primary, secondary, or proposed drinking-water standards.
Introduction
Groundwater is used as a source of drinking water by approximately 7.2 million people, or 36 percent, of the population of New York State (Dieter and others, 2018). In 2002, the U.S. Geological Survey (USGS), in cooperation with the New York State Department of Environmental Conservation (NYSDEC), developed the Ambient Groundwater Monitoring Program to evaluate groundwater-quality in the major river basins in New York on a rotating basis. The program parallels the NYSDEC Rotating Integrated Basin Study program (https://www.dec.ny.gov/chemical/30951.html), which evaluates surface-water quality over a 5-year cycle by collecting and analyzing samples in 2 or 3 of the 14 major river basins in the State each year. This groundwater-quality monitoring program also supports NYSDEC’s responsibilities under Section 305(b) of the Clean Water Act Amendments of 1977 to report on the chemical quality of groundwater within New York (U.S. Environmental Protection Agency, 1997). The groundwater monitoring program began with a pilot study in the Mohawk River Basin in 2002 (table 1) and continues throughout upstate New York, defined as the region within New York State north of Bronx County. Sampling completed in 2008 represented the conclusion of the first round of the monitoring program throughout upstate New York. The second round of sampling was completed in 2013. The sampling conducted in 2016 in the Mohawk and Western New York River Basins, which is described in this report, continues the third full round of sampling for the Ambient Groundwater Monitoring Program.
Table 1.
Previous groundwater quality studies and reports of the rotating-basin groundwater quality monitoring program in New York.| Study area | Year | Report | URL for report | Reference |
|---|---|---|---|---|
| Mohawk River Basin1 | 2002 | Water-Data Report NY–02–1 | https://doi.org/10.3133/wdrNY021 | Butch and others, 2003 |
| Chemung River Basin | 2003 | Open-File Report 2004–1329 | https://doi.org/10.3133/ofr20041329 | Hetcher-Aguila, 2005 |
| Lake Champlain Basin | 2004 | Open-File Report 2006–1088 | https://doi.org/10.3133/ofr20061088 | Nystrom, 2006 |
| Susquehanna River Basin | 2004 | Open-File Report 2006–1161 | https://doi.org/10.3133/ofr20061161 | Hetcher-Aguila and Eckhardt, 2006 |
| Delaware River Basin | 2005 | Open-File Report 2007–1098 | https://doi.org/10.3133/ofr20071098 | Nystrom, 2007a |
| Genesee River Basin | 2005 | Open-File Report 2007–1093 | https://doi.org/10.3133/ofr20071093 | Eckhardt and others, 2007 |
| St. Lawrence River Basin | 2005 | Open-File Report 2007–1066 | https://doi.org/10.3133/ofr20071066 | Nystrom, 2007b |
| Mohawk River Basin1 | 2006 | Open-File Report 2008–1086 | https://doi.org/10.3133/ofr20081086 | Nystrom, 2008 |
| Western New York1 | 2006 | Open-File Report 2008–1140 | https://doi.org/10.3133/ofr20081140 | Eckhardt and others, 2008 |
| Central New York | 2007 | Open-File Report 2009–1257 | https://doi.org/10.3133/ofr20091257 | Eckhardt and others, 2009 |
| Upper Hudson River Basin | 2007 | Open-File Report 2009–1240 | https://doi.org/10.3133/ofr20091240 | Nystrom, 2009 |
| Chemung River Basin | 2008 | Open-File Report 2011–1112 | https://doi.org/10.3133/ofr20111112 | Risen and Reddy, 2011a |
| Eastern Lake Ontario Basin | 2008 | Open-File Report 2011–1074 | https://doi.org/10.3133/ofr20111074 | Risen and Reddy, 2011b |
| Lower Hudson River Basin | 2008 | Open-File Report 2010–1197 | https://doi.org/10.3133/ofr20101197 | Nystrom, 2010 |
| Lake Champlain Basin | 2009 | Open-File Report 2011–1180 | https://doi.org/10.3133/ofr20111180 | Nystrom, 2011 |
| Susquehanna River Basin | 2009 | Open-File Report 2012–1045 | https://doi.org/10.3133/ofr20121045 | Reddy and Risen, 2012 |
| Delaware River Basin | 2010 | Open-File Report 2011–1320 | https://doi.org/10.3133/ofr20111320 | Nystrom, 2012 |
| Genesee River Basin | 2010 | Open-File Report 2012–1135 | https://doi.org/10.3133/ofr20121135 | Reddy, 2012 |
| St. Lawrence River Basin | 2010 | Open-File Report 2011–1320 | https://doi.org/10.3133/ofr20111320 | Nystrom, 2012 |
| Mohawk River Basin1 | 2011 | Open-File Report 2013–1021 | https://doi.org/10.3133/ofr20131021 | Nystrom and Scott, 2013 |
| Western New York1 | 2011 | Open-File Report 2013–1095 | https://doi.org/10.3133/ofr20131095 | Reddy, 2013 |
| Central New York | 2012 | Open-File Report 2014–1226 | https://doi.org/10.3133/ofr20141226 | Reddy, 2014 |
| Upper Hudson River Basin | 2012 | Open-File Report 2014–1084 | https://doi.org/10.3133/ofr20141084 | Scott and Nystrom, 2014 |
| Chemung River Basin | 2013 | Open-File Report 2015–1168 | https://doi.org/10.3133/ofr20151168 | Scott, and others, 2015 |
| Eastern Lake Ontario Basin | 2013 | Open-File Report 2015–1168 | https://doi.org/10.3133/ofr20151168 | Scott, and others, 2015 |
| Lower Hudson River Basin | 2013 | Open-File Report 2015–1168 | https://doi.org/10.3133/ofr20151168 | Scott, and others, 2015 |
| Lake Champlain Basin | 2014 | Open-File Report 2016–1153 | https://doi.org/10.3133/ofr20161153 | Scott, and others, 2016 |
| Susquehanna River Basin | 2014 | Open-File Report 2016–1153 | https://doi.org/10.3133/ofr20161153 | Scott, and others, 2016 |
| Delaware River Basin | 2015 | Open-File Report 2019–1005 | https://doi.org/10.3133/ofr20191005 | Scott, and others, 2019 |
| Genesee River Basin | 2015 | Open-File Report 2019–1005 | https://doi.org/10.3133/ofr20191005 | Scott, and others, 2019 |
| St. Lawrence River Basin | 2015 | Open-File Report 2019–1005 | https://doi.org/10.3133/ofr20191005 | Scott, and others, 2019 |
Objective and Approach
The objective of the groundwater quality monitoring program is to quantify and report on ambient groundwater quality in bedrock and glacial-drift aquifers in upstate New York. By using consistent, standardized methods, water samples were collected from existing domestic and production wells, each equipped with permanently installed pumps. The wells sampled were selected to represent an approximately equal number of domestic and production wells, to represent an approximately equal number of bedrock and glacial-drift wells, and to provide a representative geographic distribution of samples with emphasis on areas of greatest groundwater use. Samples were analyzed for a broad suite of properties and constituents, including physicochemical properties and concentrations of dissolved gases, major ions, nutrients, trace elements, pesticides, volatile organic compounds (VOCs), radionuclides, and indicator bacteria. The resulting dataset contributes to characterizing the ambient groundwater quality conditions in New York State and can be used to identify long-term trends. The data are made available online through the USGS National Water Information System (NWIS) database (https://nwis.waterdata.usgs.gov/ny/nwis/qw), published reports, and published data releases.
Groundwater samples were collected in the Mohawk River Basin in 2002, 2006, 2011, and 2016. Samples were collected in the western New York River Basins in 2006, 2011, and 2016. Sampling for the 2016 cycle of this study was completed from July to December. Twenty-two environmental samples and three quality-control samples were collected in the Mohawk River Basin. Thirty-four environmental samples and five quality-control samples were collected in the western New York River Basins. Approximately 20 percent of samples collected in 2016 were from wells that had been sampled in previous study cycles to enable comparison of ambient conditions over time. Five of the Mohawk River Basin wells sampled in 2016 were also sampled as part of this cycle of studies in one or more of the earlier three sampling years (Butch and others, 2003; Nystrom, 2008; Nystrom and Scott, 2013). Seven of the western New York River Basins wells were also sampled as part of this cycle of studies in 2006 and 2011 (Eckhardt and others, 2008; Reddy, 2013).
Purpose and Scope
This report presents the findings of the 2016 groundwater quality study in the Mohawk River and western New York River Basins. The report (1) describes the hydrogeologic setting, describes the methods of site selection, and lists the sampled wells and associated chemical analyses; (2) describes the analytical results; (3) compares analytical results to drinking-water-quality guidelines, and (4) compares the results of this study with results for selected wells in the study areas that were sampled in 2002, 2006 and 2011 (Butch and others, 2003; Nystrom, 2008; Eckhardt and others, 2008; Nystrom and Scott, 2013; Reddy, 2013).
Hydrogeologic Setting
The study areas discussed in this report cover almost 9,000 square miles (mi2) and represent a wide range of geologic, hydrologic, and topographic settings, as well as land uses. Bedrock in the Mohawk River Basin consists of complex mixtures of sedimentary (primarily shales), crystalline, and carbonate rocks. In the western New York River Basins, bedrock is primarily shale and some carbonates. Surficial material in both areas consists mainly of glacial and alluvial deposits.
Mohawk River Basin
The Mohawk River Basin encompasses approximately 3,500 mi2 in central New York (fig. 1). The study area lies within 14 counties, including Albany, Delaware, Fulton, Greene, Hamilton, Herkimer, Lewis, Madison, Montgomery, Oneida, Otsego, Saratoga, Schenectady, and Schoharie. The Mohawk River is a major tributary to the Hudson River; principal tributaries to the Mohawk River are the Schoharie and West Canada Creeks. The Mohawk River Basin contains three large reservoirs: the Schoharie Reservoir, from which water is diverted out of the basin as part of New York City’s water-supply system; Hinckley Reservoir, which provides drinking water to the Utica area, and Delta Reservoir, which provides water to the eastern Erie Canal.
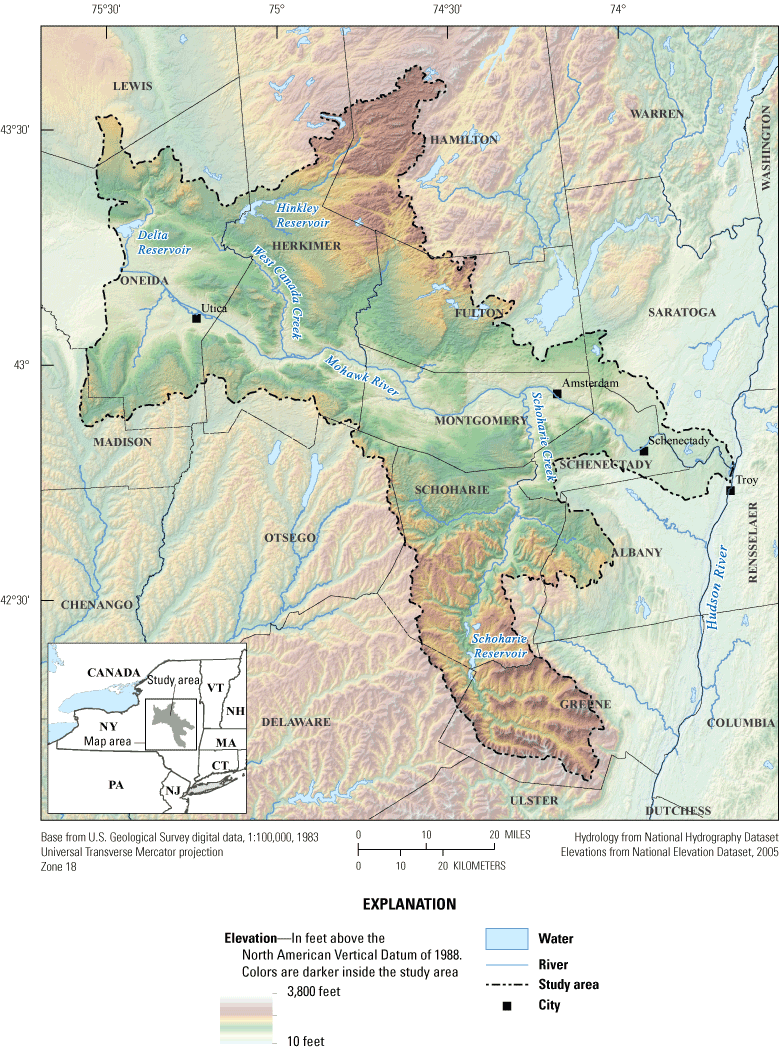
Topography and geography of the Mohawk River Basin, New York.
The highest elevations in the Mohawk River Basin study area are approximately 4,000 feet above sea level (ft asl), along the southern limit of the basin. The Mohawk River drains from west to east along the middle of the basin; the lowest elevation (approximately 10 ft asl) in the basin is at the confluence of the Mohawk River and the Hudson River, north of Troy, New York. The Mohawk River Basin is predominantly forested, especially in the upland areas, with urban and agricultural areas in valleys and other low-lying areas (Homer and others, 2015).
Bedrock in the Mohawk River Basin study area (fig. 2) includes shale, sandstone, carbonate, and crystalline rocks. Black shale is present in the Mohawk Valley, with bands of carbonate rock along the limits of the valley. Bedrock in the southern part of the basin consists mainly of shale and sandstone, and bedrock in the northern part of the basin is mainly crystalline metamorphic rock. Yields from wells completed in bedrock aquifers in the basin are generally highest from carbonate rocks and lowest from crystalline rocks. Wells completed in clastic rocks generally have low to moderate yields (Hammond and others, 1978). In bedrock wells, water moves mainly through bed partings, joints, and other fractures in the rock towards the wellbore under pumping conditions.
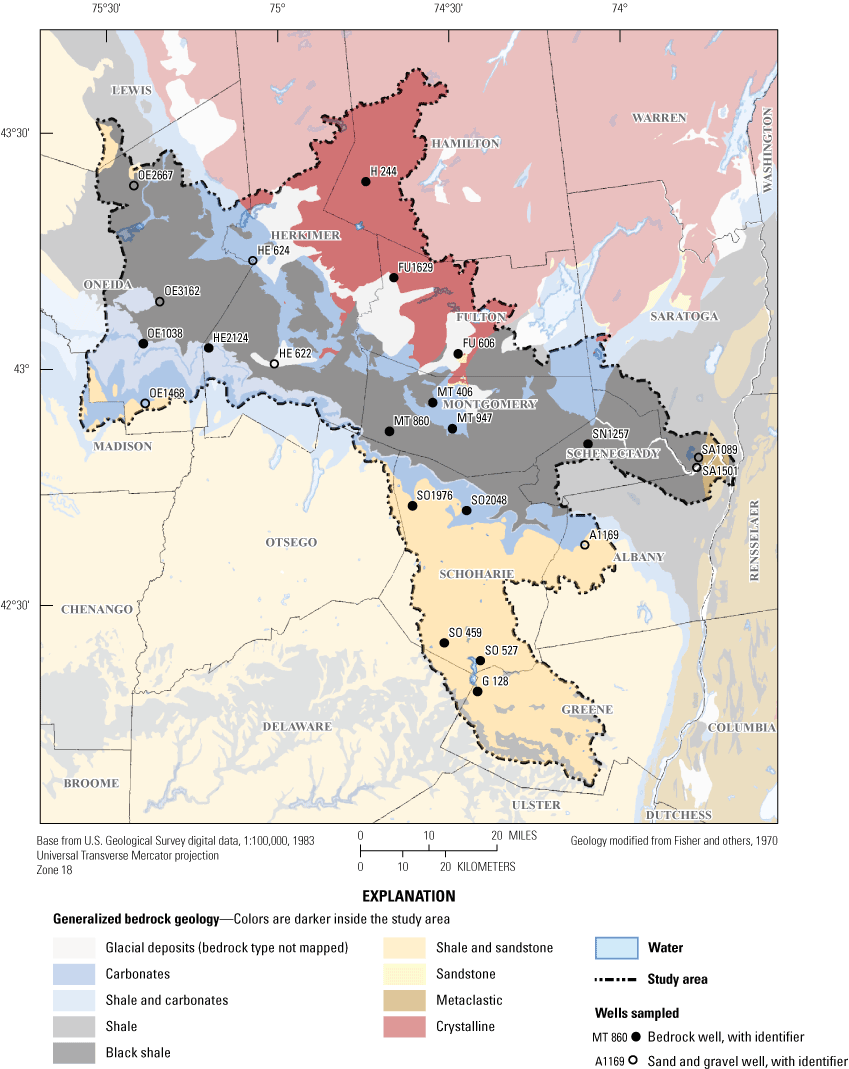
Generalized bedrock geology of the Mohawk River Basin, New York, and locations of wells sampled in 2016.
The surficial material throughout the Mohawk River Basin (fig. 3) was deposited primarily during the Pleistocene Epoch, when Wisconsinan glaciers covered most of the northeastern United States (Isachsen and others, 2000). Till, which was directly deposited by the glaciers, mantles the uplands; alluvial and glaciofluvial deposits of sand and gravel, and lacustrine silt and clay, are present in the valleys. The till and lacustrine deposits have generally low permeability and often form confining layers, whereas well-sorted deposits of sand and gravel form important aquifers within the basin that may produce well yields of 1,000 gallons per minute (gal/min) or more (Reynolds, 1990). The depths of sand-and-gravel wells sampled in the Mohawk River Basin range from 23 to 169 feet below land surface (ft bls); the depths of bedrock wells sampled range from 49 to 815 ft bls (table 2).
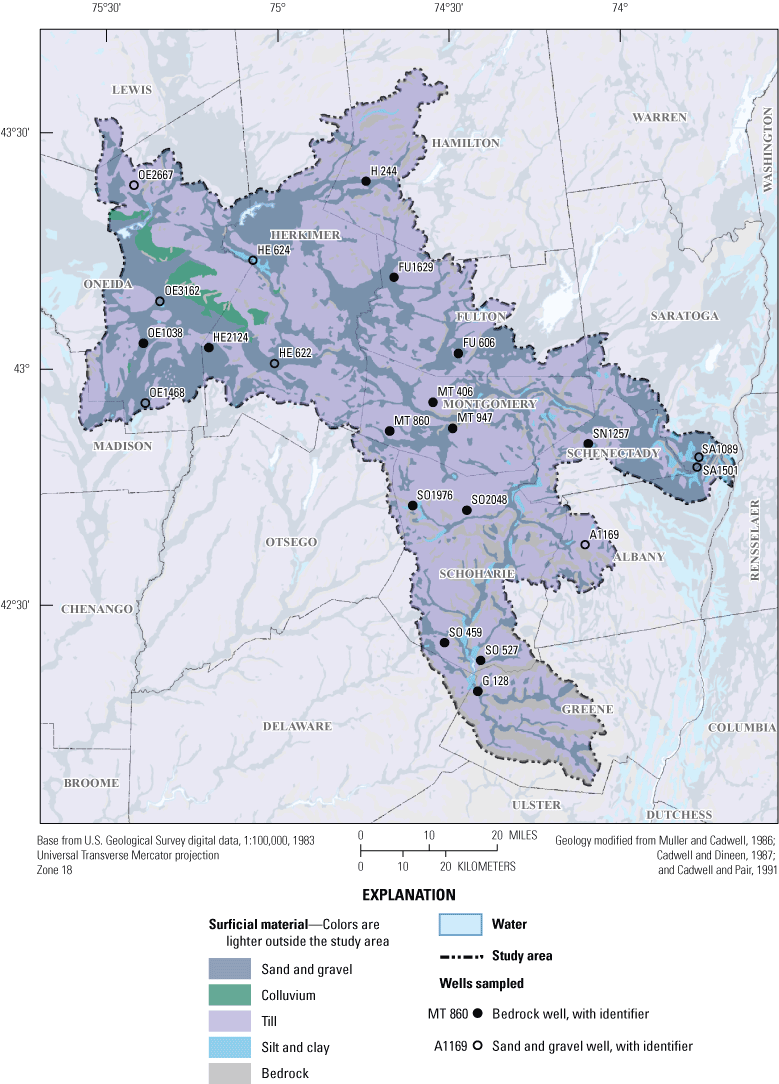
Generalized surficial geology of the Mohawk River Basin, New York, and locations of wells sampled in 2016.
Table 2.
Description of wells from which water samples were collected in the Mohawk and western New York River Basins, New York, 2016.[Well locations are shown in figures 2 and 3 (Mohawk Basin), and figures 5 and 6 (western New York River Basins).Well types: P, production; D, domestic. Land-cover categories: D, developed; F, forested; A, agricultural; W, open water; WL, wetlands. --, unknown or not applicable]
Prefix denotes county: A, Albany; AG, Allegany; CT, Cattaraugus; CU, Chautauqua; E, Erie; FU, Fulton; G, Greene; GS, Genesee; H, Hamilton; HE, Herkimer; MO, Monroe; MT, Montgomery; OE, Oneida; OL, Orleans; SA, Saratoga; SN, Schenectady; SO, Schoharie; WO, Wyoming. Number is local well-identification number assigned by the U.S. Geological Survey.
Determined from the National Land Cover Database (Homer and others, 2015).
Western New York River Basins
The western New York River Basins study area encompasses approximately 5,340 mi2 within the boundaries of New York State. The study area includes all of Chautauqua, Erie, and Niagara Counties; most of Cattaraugus and Orleans Counties; and the western parts of Allegany, Genesee, Monroe, and Wyoming Counties (fig. 4). The western New York River Basins study area also encompasses parts of the Lake Erie and Niagara River Basins, the western Lake Ontario Basin (between the Niagara River and the Genesee River Basins), and the Allegheny River Basin. Major tributaries to the Allegheny River (New York State part) include Conewango Creek, Cassadaga Creek, Olean Creek, Great Valley Creek, and French Creek. Major tributaries to the Niagara River and Lake Erie watershed (New York State part) include Tonawanda Creek, Cattaraugus Creek, and the Buffalo River. Major tributaries to the western part of Lake Ontario in this study area include Oak Orchard Creek, Sandy Creek, and Eighteen Mile Creek. The study area also contains several small lakes, such as Chautauqua Lake, and is crossed by the New York State Barge (Erie) Canal, which traverses the State from Albany to Buffalo. There are no major reservoirs within the western New York River Basins.
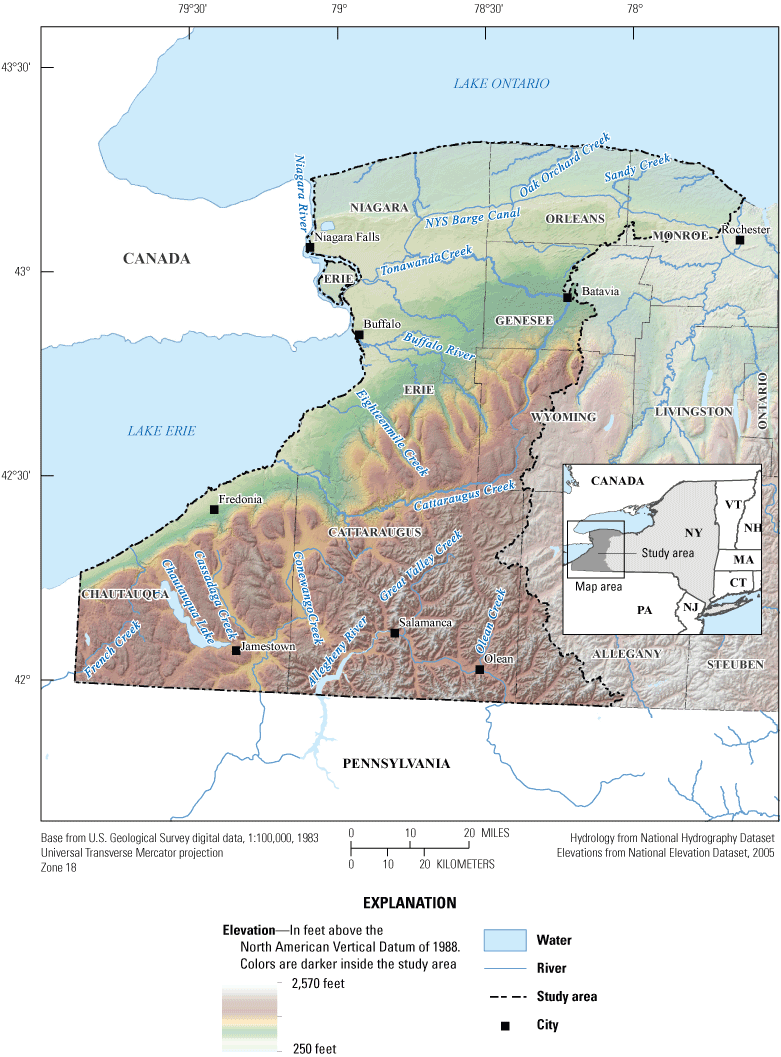
Topography and geography of the western New York River Basins, New York.
The highest elevations in the western New York River Basins study area are approximately 2,500 feet above sea level, in the eastern and southern uplands (fig. 4). The lowest elevations in the study area are about 250 ft above sea level, at Lake Ontario. Land use is primarily forested and pasture in the uplands and narrow valleys that dominate the southern area of the basin; row-crops, apples, grapes, forage crops, and dairy agriculture are concentrated in the broad alluvial valley and the low rolling hills of the central basin (table 2). The Buffalo and Niagara Falls metropolitan area lies near the outlet of Lake Erie and extends northward along the Niagara River.
Bedrock in the western New York River Basins (fig. 5) consists mainly of nearly flat-lying, interbedded sedimentary units of shale, siltstone, sandstone, limestone, and dolostone of Silurian and Devonian age (Eckhardt and others, 2008). The surficial material throughout the basins was deposited primarily during the Pleistocene Epoch when Wisconsinan glaciers covered most of the northeastern United States (Isachsen and others, 2000). An exception to this is an area around Salamanca in southern Cattaraugus County where colluvium overlies weathered bedrock (fig. 6). Till, which was directly deposited by the glaciers, discontinuously overlies bedrock in the uplands in the rest of the basins. Glaciofluvial sand and gravel and glaciolacustrine silt and clay were deposited mainly in valleys, and recent alluvium overlies these glacial deposits in the flood plains of the larger streams and rivers (Coates, 1966; Randall, 2001). In the western New York River Basins, the most productive aquifers are the glaciofluvial and alluvial deposits of sand and gravel in the valleys. Glaciolacustrine and till deposits have low permeability and yield little water to wells (Coates, 1966; Randall, 2001). The depths of sand-and-gravel wells sampled in these basins range from 35 to 185 ft bls. The depths of bedrock wells sampled range from 30 to 170 ft bls (table 2).
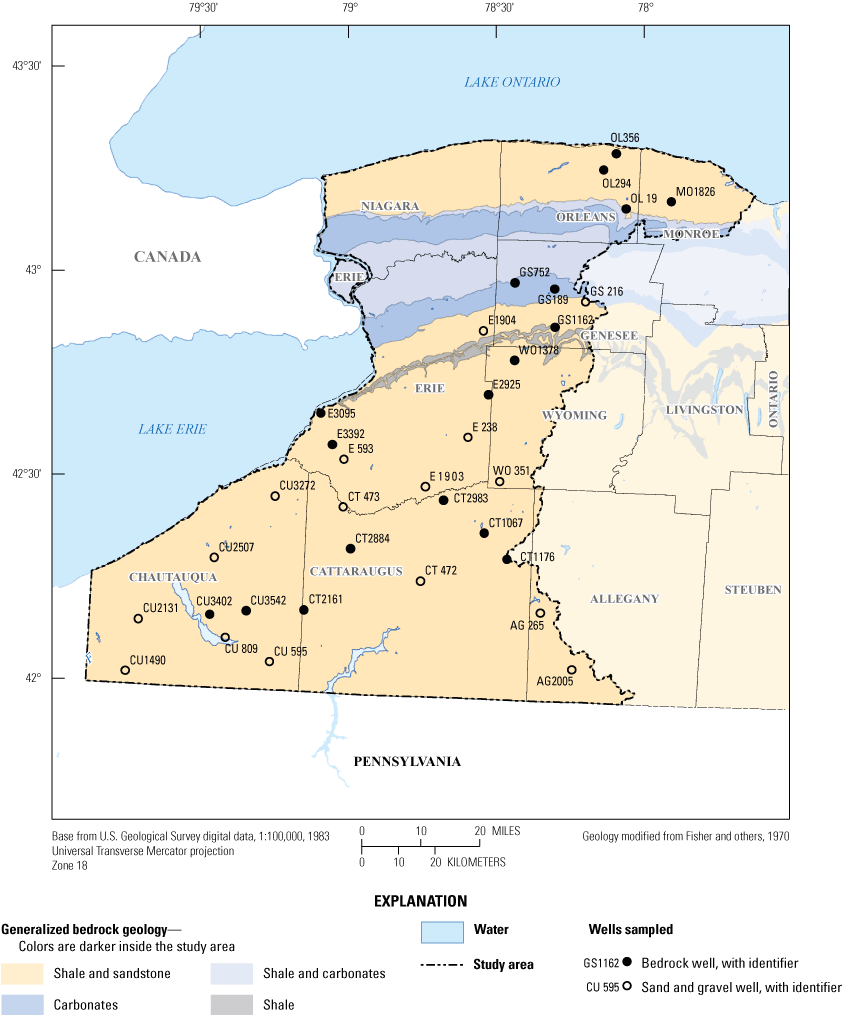
Generalized bedrock geology of the western New York River Basins, New York, and locations of wells sampled in 2016.
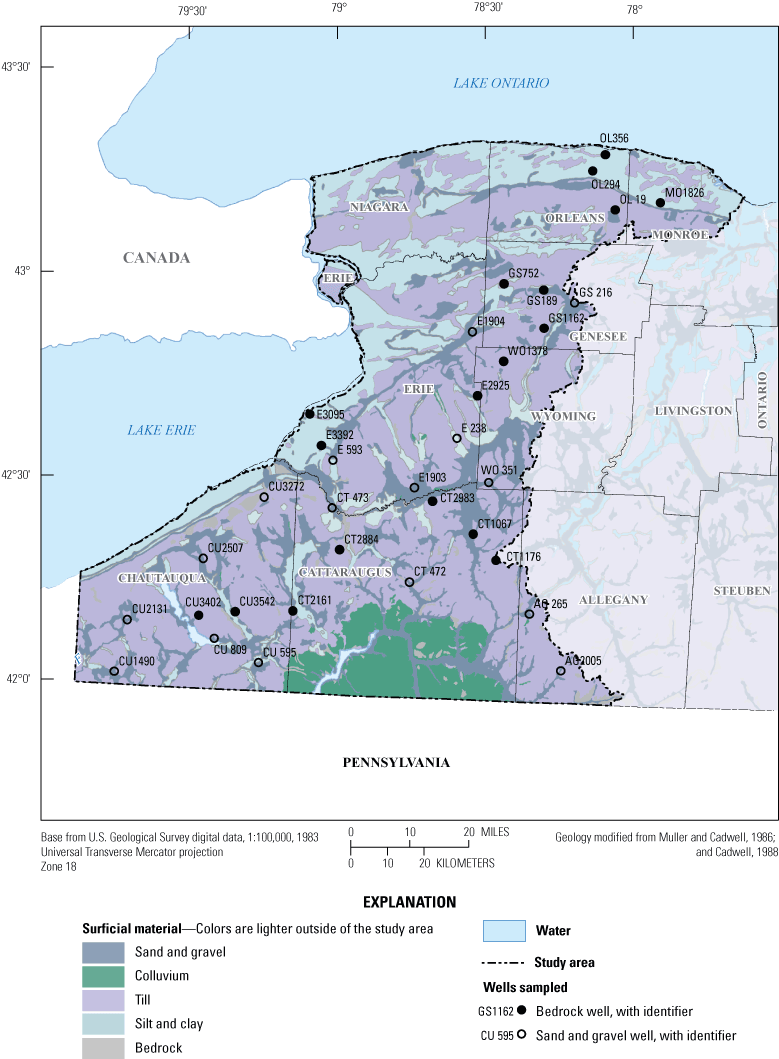
Generalized surficial geology of the western New York River Basins, New York, and locations of wells sampled in 2016.
Methods of Investigation
Well-selection criteria, sampling methods, and analytical methods were designed to maximize data precision, accuracy, and comparability. Groundwater sample collection and processing followed standard USGS procedures as documented in the National Field Manual for the Collection of Water-Quality Data (U.S. Geological Survey, variously dated). Samples were analyzed at the USGS National Water Quality Laboratory (NWQL) in Denver, Colorado, and other certified laboratories by using published methods. The NWQL and the other selected laboratories are certified by the New York State Environmental Laboratory Approval Program (ELAP) for most constituents, including those regulated by the NYSDEC and NYSDOH.
Well Selection
The 56 wells selected for sampling (figs. 2 and 5) represent forested, developed, wetlands, open water, and agricultural areas (table 2). The final selection of each well was based on the availability of well-construction data and hydrogeologic information for the well and its surrounding area; specific municipalities, industries, or agricultural practices were not targeted for sampling. The wells sampled also represent an approximately equal number of domestic and production wells, and an approximately equal number of wells completed in bedrock and in sand-and-gravel.
The selection of domestic wells for sampling was based on information from the NYSDEC Water Well Contractor Program, which began in 2000. The program requires that licensed well drillers file a report with NYSDEC that contains basic information about each well drilled, such as well and casing depth, diameter, yield, and a driller’s log. Evaluation of well-completion report data identified several hundred wells as potential sampling sites; well owners were sent a letter requesting permission to sample the well and a questionnaire about the well. Well owners who granted permission were contacted later by phone to verify well information and to arrange for sampling.
Production wells considered for sampling were identified through the EPA Safe Drinking Water Information System, the NYSDOH Drinking Water Protection Program, and the NYSDEC Water Well Contractor Program. Town officials or water managers were sent letters requesting permission to sample a well, and followup phone calls were made to arrange a time for sampling. Well information, such as depth, was provided by water managers if a well-completion report was unavailable. The aquifer type indicated for sampled wells was assigned on the basis of evaluation of driller’s logs and published geologic maps, including those by Fisher and others (1970), Muller and Cadwell (1986), Cadwell and Dineen (1987), Cadwell (1988), and Cadwell and Pair (1991).
The characteristics of the wells sampled, the USGS-assigned county well numbers, and the type of land cover within a half-mile radius around each well are listed in table 2. The depths of the wells and the aquifer units from which samples were collected are summarized in tables 2 and 3. Five Mohawk River Basin wells sampled in 2016 were sampled previously; HE 624 was sampled in 2002; OE1468 was sampled in 2011; and HE 622, MT 406, and SA1501 were sampled in 2002, 2006, and 2011 (Butch and others, 2003; Nystrom, 2008; and Nystrom and Scott, 2013). Seven western New York River Basins wells sampled in 2016 were also sampled previously; CU2131 was sampled in 2011; AG 265, E1903, E1904, GS 216, OL 19, and WO 351 were sampled in 2006 and 2011 (Eckhardt and others, 2008; Reddy, 2013). One bedrock well, E2925, was sampled twice during this study period—on August 16, 2016 and again on November 1, 2016. This well was resampled to confirm the presence of some constituents at concentrations outside their expected range, and to confirm the presence of VOCs that have rarely been detected in other wells in these studies. The data for both samples are provided in this report. Only the data from the August sample were used in the computation of concentration medians and for describing detections in the western New York River Basins. In cases in which constituent detections are counted among samples, detections in both samples from E2925 are not repeated.
Domestic wells that are completed in sand-and-gravel aquifers are generally finished with open-ended casing so that groundwater enters the well only through the bottom of the casing. Production wells drilled in these aquifers are typically completed with a well screen to maximize the yield; the difference between the casing depth and the well depth (table 2) is the approximate screened interval for these wells. In some cases, however, production wells with low yields are completed in sand-and-gravel aquifers with open-ended casing and no screen. Bedrock wells, both domestic and production, are completed with a surface casing cemented several feet into competent bedrock, and the balance of the well is completed as an open hole in bedrock.
Table 3.
Summary of characteristics for 56 wells from which water samples were collected in the Mohawk and Western New York River Basins, New York, 2016.[bls, below land surface]
Sampling Methods
Samples were collected and processed in accordance with documented USGS protocols (U.S. Geological Survey, 2006). The samples were collected before passing through any water treatment systems to be representative of the native water in the aquifer. Samples from domestic wells were collected from a spigot near the pressure tank; samples from production wells were collected at the spigot or faucet used for collection of raw-water samples by water managers.
Samples were collected from garden-hose-thread spigots at all sites where possible. Domestic wells were purged by pumping water to waste for at least 20 minutes at rates ranging from about 2 to 5 gal/min or until at least one well-casing volume of water had passed the sampling point. Generally, three casing volumes are evacuated from wells prior to sampling (U.S. Geological Survey, 2006); however, for wells that had been used recently, less than three casing volumes were purged, and wells were sampled when field physicochemical measurements (temperature, pH, specific conductivity, and dissolved oxygen) stabilized. During well purging, notes about conditions at the well, the surrounding land, and land use were recorded, including a global positioning system measurement of latitude and longitude. Field measurements of water temperature, pH, specific conductance, and concentration of dissolved oxygen were recorded at the site by using portable instruments (U.S. Geological Survey, variously dated).
When possible, the flow rate from the well was adjusted to less than 0.5 gal/min before sample collection. Sample tubing from the spigot was then connected to a sample-collection chamber constructed of a polyvinyl chloride frame and a clear plastic chamber bag, the purpose of which is to reduce the potential for outside contamination of the water samples. All tubing and fittings were precleaned for each sample (U.S. Geological Survey, 2006).
Samples were collected in the sampling chamber and preserved (if necessary) according to standard USGS procedures (U.S. Geological Survey, 2006). Samples for nutrient, major-ion, and some trace-element analyses were filtered through disposable (one-time use) 0.45-micrometer (µm) pore-size polyether sulfone capsule filters that had been preconditioned in the laboratory with 3 liters (L) of deionized water on the day of sample collection and stored on ice until use in the field. (Note that following the completion of the sampling in 2016, new guidance from the NWQL cautioned about the potential for low-level total nitrogen and Kjeldahl nitrogen contamination that results from preconditioning of capsule filters [U.S. Geological Survey, Water-Quality Information Note 2017.03, written commun., 2017]; therefore, some data were qualified to account for the possible contamination posed by using preconditioned filters. Data that could have resulted from this contamination are discussed further in the nutrients subsection.) Samples for pesticide analyses were filtered through a disposable 0.7-µm pore-size glass-fiber filter. Ultrapure nitric acid preservation was required for trace-element samples, except those for analysis of mercury, which were preserved with ultrapure hydrochloric acid (6 normal, 1:1). Hydrochloric acid (1:1) was added to samples analyzed for VOCs to reduce the sample pH below 2.0 and to kill bacteria that might degrade VOCs. Headspace in sample bottles was avoided to prevent the potential loss of VOCs. Samples for major-cation analysis and some samples for radiochemical analysis were preserved with ultrapure nitric acid. Acid preservative was added after the collection of other samples to avoid the possibility of cross contamination by the acid preservative; for example, samples preserved with nitric acid were acidified after the collection of samples for nutrient analysis. Water samples for radon analysis were collected through a septum chamber with a glass syringe, according to standard USGS procedures (U.S. Geological Survey, 2006). Bottles containing water samples for the analysis of dissolved gases were filled and sealed while fully submerged in a beaker of well water to prevent exposure to the atmosphere or headspace. Samples for bacterial analysis were collected in accordance with NYSDEC and NYSDOH protocols (American Public Health Association, 1998), with the exception that the sampling port could not be flame sterilized. Water samples for bacterial analysis were collected in sterilized bottles provided by a NYSDOH-certified analyzing laboratory. After collection, all water samples except those for radiochemical analyses were chilled to 4 degrees Celsius (°C) or less and were kept chilled until delivery to the analyzing laboratory. Bacterial samples were hand delivered to the analyzing laboratory within 6 hours of collection; all other samples were shipped by overnight delivery to the designated laboratories.
Analytical Methods
Samples were measured for 320 physicochemical properties and constituents, including dissolved gases, major ions, nutrients, total organic carbon, trace elements, pesticides, pesticide degradates, VOCs, radionuclides, and bacteria. Pesticides and pesticide degradates accounted for 225 of the 320 constituents measured. Water temperature, pH, dissolved oxygen concentration, and specific conductance were measured at the sampling site. (Note that dissolved oxygen concentrations are also calculated with a method using laboratory measurements of argon and dissolved oxygen; these calculated data represent different [sample] conditions and may not accurately reflect dissolved oxygen concentrations in the ambient groundwater.) Samples were analyzed for major ions, nutrients, total organic carbon, trace elements, radon-222, pesticides, pesticide degradates, and VOCs at the USGS NWQL in Denver, Colorado. Alkalinity titrations were performed only at the NWQL, not at the field site. Select dissolved gases were analyzed at the USGS Groundwater Dating Laboratory in Reston, Virginia. Gross-alpha (gross-α) and gross-beta (gross-β) radioactivities were analyzed at ALS Environmental in Fort Collins, Colorado. Samples were analyzed for indicator bacteria at one of the following NYSDOH-certified laboratories: Mohawk River Basin samples were analyzed at the St. Peter’s Bender Laboratory in Albany, New York; western New York River Basins samples were analyzed either at Community Science Institute in Ithaca, New York, or at BioTrax Testing Laboratories in Cheektowaga, New York.
Anion concentrations were measured by ion-exchange chromatography, and cation concentrations were measured by inductively coupled plasma-atomic emission spectrometry (ICP–AES), as described in Fishman (1993). Color was determined by visual comparison using method I–1250–85 (Fishman and Friedman, 1989). Nutrients were analyzed by colorimetry, as described by Fishman (1993), except for ammonia plus organic nitrogen, which was analyzed by Kjeldahl digestion with photometric finish, as described by Patton and Truitt (2000). Nitrate was calculated by subtracting the nitrite from the measured values of nitrate plus nitrite. Total organic carbon samples were analyzed by high-temperature combustion and catalytic oxidation for measurement by infrared detection according to Standard Method 5310B (American Public Health Association, 1998). Mercury concentrations were measured through cold vapor–atomic fluorescence spectrometry according to methods described by Garbarino and Damrau (2001). Arsenic, chromium, and nickel were analyzed by use of collision/reaction cell inductively coupled plasma-mass spectrometry, as described by Garbarino and others (2006). The remaining trace elements were analyzed by ICP–AES (Struzeski and others, 1996), inductively coupled plasma-optical emission spectrometry, and inductively coupled plasma-mass spectrometry (Garbarino and Struzeski, 1998). Procedures for in-bottle digestions for trace-element analyses described by Hoffman and others (1996) were followed. Radon-222 activities were measured through liquid-scintillation counting (ASTM International, 2006). Samples were analyzed for pesticides by using direct aqueous-injection liquid chromatography-tandem mass spectrometry (LC–MS/MS), as described by Sandstrom and others (2015). Additionally, six samples were chosen at random and analyzed for pesticides by using the gas chromatography-mass spectrometry (GC–MS) pesticide method described as described by Zaugg and others (1995), Sandstrom and others (2001), and Furlong and others (2001). The selected samples were processed as described by Wilde and others (2009). VOCs were analyzed by GC–MS by using methods described by Connor and others (1998).
Gross-α and gross-β radioactivities were measured according to EPA method 900.0 (U.S. Environmental Protection Agency, 1980). Carbon dioxide and methane concentrations were measured through gas chromatography with flame ionization detection. (Note that carbon dioxide concentrations are also calculated and reported in NWIS on the basis of laboratory alkalinity results and field pH measurements; these calculated data represent different [sample] conditions and may not accurately reflect carbon dioxide concentrations dissolved in the ambient groundwater.) Dissolved nitrogen gas and argon concentrations were measured by using gas chromatography with thermal conductivity detection (Busenberg and others, 1998). Indicator bacteria samples were tested for total coliforms, fecal coliforms, and Escherichia coli (E. coli) by using membrane filtration and Standard Method 9222; a heterotrophic plate count test was made by using Standard Method 9215 B (American Public Health Association, 1998). All water-quality data are available from NWIS (U.S. Geological Survey, 2022) as well as an accompanying U.S. Geological Survey data release (Gaige, 2023).
Quality-Control Samples
In addition to the 56 groundwater (environmental) samples, a total of 3 complete field blank samples and 2 complete replicate samples were collected for quality assurance within both study areas. Additionally, three partial replicate samples of radon, gross-α, gross-β, and dissolved gasses were collected. Only constituents that were detected in the blanks are mentioned in the following discussion; constituents not mentioned were not detected in blanks. Silica was detected in all three of the complete field blanks. Silica was measured at 0.06 milligram per liter (mg/L) in the blank collected in the Mohawk River Basin, 0.25 mg/L in one of the blanks collected in the western New York River Basins, and 0.15 mg/L in the second blank collected in the western New York River Basins. The laboratory reporting level (LRL), which is the concentration at which the false negative error rate is minimized to be no more than 1 percent of the reported results (Childress and others, 1999), is 0.018 mg/L for silica. The minimum concentration of silica in the environmental samples was 5.89 mg/L in a sample from the western New York River Basins. Silver was measured at 0.06 microgram per liter (µg/L) in one of the field blanks, collected in the Mohawk River Basin. No silver was detected, however, in any of the environmental samples from the Mohawk River Basin (table 11 and Gaige, 2023). Calcium was measured at 0.027 mg/L in one of the blanks from the western New York River Basins. The LRL for calcium is 0.022 mg/L. The minimum calcium concentration in the environmental samples was 5.92 mg/L, in a sample from the Mohawk River Basin. Ammonia was measured at 0.01 mg/L as nitrogen (N) in one of the field blanks in the western New York River Basins. The presence of ammonia in the blank could be attributed to contamination from the advanced preconditioning of capsule filters with deionized water prior to filtration (U.S. Geological Survey, Water-Quality Information Note 2017.03, written commun., 2017). For ammonia plus organic nitrogen and for ammonia, a “V” remark code was assigned to values in NWIS with detections to indicate possible contamination, as every sample was collected with a preconditioned capsule filter. “V” remark codes indicate that a value may be affected by contamination. The minimum concentration of ammonia plus organic nitrogen in the environmental samples from the western New York River Basins was 0.07 mg/L, and the minimum concentration of ammonia was 0.01 mg/L. Toluene was measured at 0.2 µg/L in one of the field blanks in the western New York River Basins. The LRL for toluene is 0.1 µg/L. Toluene was detected only in samples from the western New York River Basins, and only in samples from the bedrock wells E2925 (0.5 µg/L in the August sample, 0.3 µg/L in the November sample) and OL 19 (8.4 µg/L) (Gaige, 2023).
A complete replicate sample was collected at 1 Mohawk River Basin well and 1 western New York River Basins well, and three partial replicate samples were collected, 1 in the Mohawk River Basin, and 2 in the western New York River Basins. Variability between environmental and replicate samples is determined by the relative percent difference between concentrations of constituents analyzed in the samples (Zar, 1999). The variability between the partial replicates collected at three wells, which compared analytical results only for radon, gross-α, gross-β, and dissolved gas, was less than 12 percent, except those for gross-α activity, which had a variability of 84 percent. For the complete replicate sample collected in the Mohawk River Basin, variability was less than 10 percent for color, field constituents, major ions, dissolved solids, nutrients, most trace elements, radon, and most dissolved gases. Pesticides, E. coli, fecal coliform bacteria, and total coliform bacteria were not detected in either the environmental or the replicate sample. Only one VOC, trichloromethane, was detected, and it was detected only in the environmental sample at 0.1 µg/L, but not in the replicate sample. The LRL for trichloromethane is 0.1 µg/L. Variability in the concentrations of the trace elements aluminum, beryllium, chromium, cobalt, copper, iron, lithium, and nickel ranged from 16 to 25 percent. Variability in the analyses of replicate samples was 35 percent for heterotrophic plate count, 51 and 32 percent for methane, 23 percent for gross-α, and 58 percent for gross-β. For the complete replicate sample collected in the western New York River Basins, variability was less than 13 percent for color, field-measured properties, major ions, dissolved solids, nutrients, trace elements, radon, most dissolved gases, and for two of the three pesticides detected in these samples. No VOCs or bacteria were detected in either the environmental or the replicate samples from the western New York River Basins. Variability between carbon dioxide replicate samples ranged from 20 to 28 percent. Variability between gross-β replicate samples was 29 percent. Variability in the concentration of 2-chloro-4-isopropylamino-6-amino-S-triazine (CIAT) between the environmental and replicate samples was 35 percent.
Groundwater Quality
Many of the constituents for which the groundwater was analyzed were not detected in any of the samples (Gaige, 2023). Some concentrations are reported as “E” for estimated. Estimated concentrations are typically reported when the detected value is less than the established LRL but greater than the long-term method detection level, or when recovery of a compound has been shown to be highly variable (Childress and others, 1999). Concentrations of some constituents exceeded maximum contaminant levels (MCLs) or secondary drinking-water standards (SDWS) set by the EPA (U.S. Environmental Protection Agency, 2012) or NYSDOH (New York State Department of Health, 2011), or proposed alternative MCLs set by the EPA (U.S. Environmental Protection Agency, 1999). MCLs are enforceable standards for finished water in public-water supplies; they are not enforceable for private homeowner wells but are presented here as a standard for evaluation of the water-quality results. SDWS are nonenforceable drinking-water standards that typically relate to aesthetic concerns such as taste, odor, or staining of plumbing fixtures. Well owners were notified promptly if any constituent exceeded EPA or NYSDOH MCLs (table 4). Copies of the complete analytical results were mailed to each well owner.
Table 4.
Constituents that exceeded either primary, secondary, or proposed drinking-water standards in groundwater samples collected in the Mohawk and western New York River Basins, New York, 2016.[Well locations are shown in figures 2 and 3 (Mohawk River Basin) and figures 5 and 6 (western New York River Basins). Well types: P, production; D, domestic; --, not applicable; f, in filtered water; u, in unfiltered water]
Prefix denotes county: A, Albany; AG, Allegany; CT, Cattaraugus; CU, Chautauqua; E, Erie; FU, Fulton; G, Greene; GS, Genesee; H, Hamilton; HE, Herkimer; MO, Monroe; MT, Montgomery; OE, Oneida; OL, Orleans; SA, Saratoga; SN, Schenectady; SO, Schoharie; WO, Wyoming. Number is local well-identification number assigned by the U.S. Geological Survey.
U.S. Environmental Protection Agency (2012) secondary drinking water standard.
New York State Department of Health (2011) maximum contaminant level.
U.S. Environmental Protection Agency (1999) proposed alternative MCL of 300 picocuries per liter for areas that do not implement an indoor-air radon mitigation program.
U.S. Environmental Protection Agency (2012) drinking water advisory taste threshold.
U.S. Environmental Protection Agency (2012) lifetime health advisory.
U.S. Environmental Protection Agency (2012) maximum contaminant level.
Methane concentration above recommended monitoring concentration (Eltschlager and others, 2001).
Physicochemical Properties
Physicochemical properties of the samples, including water temperature, pH, specific conductance, and dissolved oxygen, were measured in the field. Samples were collected for analysis of color. Qualitative assessment of the presence (odor) of hydrogen sulfide was noted. Results of analyses are reported in table 5 and in Gaige (2023). The number of samples that exceeded drinking-water standards for physicochemical properties is reported in table 6. Drinking-water standards have not been established for specific conductance and water temperature.
Table 5.
Summary statistics for physicochemical properties and dissolved gases of groundwater samples collected in the Mohawk and western New York River Basins, New York, 2016.[All concentrations in unfiltered water. Bold values (which are also footnoted) exceed one or more drinking-water or safety standards. Data from the western New York River Basins E2925 sample, collected in November, are excluded from the computation of concentration medians, detections, and maximum values. Pt-Co units, platinum-cobalt units; mg/L, milligram per liter; µS/cm at 25 °C, microsiemens per centimeter at 25 degrees Celsius; °C, degrees Celsius; <, value less than reporting level]
Table 6.
Drinking-water standards for physicochemical properties, recommended monitoring concentrations for methane, and number of groundwater samples collected in the Mohawk and western New York River Basins, New York, 2016, that exceeded those standards and recommendation.[All concentrations in unfiltered water. Data from the western New York River Basins E2925 sample, collected in November, are excluded from the computation of concentration medians, detections, and maximum values. Pt-Co units, platinum-cobalt units; mg/L, milligram per liter]
U.S. Environmental Protection Agency (2012) secondary drinking water standard.
Methane recommended monitoring concentration (Eltschlager and others, 2001).
Most samples from the Mohawk River Basin had a color of less than (<) 1 platinum-cobalt (Pt-Co) unit (table 5, table 6, and Gaige, 2023). One sample from a sand-and-gravel well (SA1501) had a color of 5 Pt-Co units. Samples from four bedrock wells (H 244, MT 406, SO 459, and SO1976) had colors that ranged from 5 to 12 Pt-Co units. Two samples from bedrock wells (FU1629 and SO 527) had colors of 30 and 88 Pt-Co units, respectively, which was greater than the EPA SDWS (EPA SDWS is 15 Pt-Co units). Sample pH was typically near neutral (median of 7.3 for sand-and-gravel wells, median of 7.2 for bedrock wells) and ranged from 5.9 to 8.3. The pH value for a sample from one bedrock well (H 244) was 5.9, which was lower than the EPA SDWS range for pH (6.5 to 8.5). Specific conductance ranged from 75 to 1,480 microsiemens per centimeter at 25 degrees Celsius (µS/cm at 25 °C); the median specific conductance was 476 µS/cm at 25 °C for sand-and-gravel wells and 546 µS/cm at 25 °C for bedrock wells. Water temperature ranged from 8.6 to 14.1 °C; the median temperature was 11.4 °C in samples from sand-and-gravel wells and 10.4 °C in samples from bedrock wells. Hydrogen sulfide odor was detected in 1 sand-and-gravel well and in 7 bedrock wells sampled in the Mohawk River Basin.
Most samples from the western New York River Basins had a color of <1 Pt-Co units (table 5, table 6, and Gaige, 2023). Four samples from sand-and-gravel wells (CT 473, CU3272, E 593, and E1903) had colors that ranged from 5 to 12 Pt-Co units. Nine samples from bedrock wells had colors that ranged from 2 to 10 Pt-Co units. One sample, from bedrock well E3095, had a color of 15 Pt-Co units, which is at the EPA SDWS; one sample, from bedrock well E2925, had a color of 30 Pt-Co units, which exceeded the EPA SDWS. Sample pH was typically near neutral (median of 7.4 for sand-and-gravel wells, median of 7.4 for bedrock wells) and ranged from 6.6 to 8.0. Specific conductance ranged from 203 to 2,810 µS/cm at 25 °C; the median specific conductance was 556 µS/cm at 25 °C for sand-and-gravel wells and 725 µS/cm at 25 °C for bedrock wells. Water temperature ranged from 9.4 to 16.2 °C; the median temperature was 11.4 °C for sand-and-gravel wells and 12.1 °C for bedrock wells. Hydrogen sulfide odor was detected in 4 sand-and-gravel wells and 6 bedrock wells in the western New York River Basins.
Dissolved Gases
Samples were analyzed in the laboratory for the dissolved gases carbon dioxide, argon, nitrogen, and methane; dissolved oxygen was measured in the field. Results of those analyses and the dissolved oxygen measurements are reported in table 5 and in Gaige (2023). The concentrations of carbon dioxide, argon, nitrogen gas, and methane in the samples were determined twice for each well; therefore, the statistics given include two samples per well. The number of samples in which methane exceeded the recommended monitoring concentration are reported in table 6. Drinking-water standards have not been established for dissolved oxygen, carbon dioxide, argon, and nitrogen gas.
In the Mohawk River Basin, concentrations of dissolved oxygen ranged from <1 to 7.7 mg/L (table 5 and Gaige, 2023) and typically were similar in samples from sand-and-gravel wells (median 1.7 mg/L) and bedrock wells (median 1.5 mg/L). Median concentrations of dissolved gases in samples from sand-and-gravel wells were 23.02 mg/L for nitrogen, 6.4 mg/L for carbon dioxide, 0.764 mg/L for argon, and 0.015 mg/L for methane. Median concentrations of dissolved gases in samples from bedrock wells were 24.17 mg/L for nitrogen, 5.4 mg/L for carbon dioxide, 0.812 mg/L for argon, and 0.010 mg/L for methane. Methane was detected in 15 of the 22 samples, with a range of 0.004 mg/L to 14.5 mg/L.
In the western New York River Basins, concentrations of dissolved oxygen ranged from <1 to 11.2 mg/L (table 5 and Gaige, 2023) and samples from sand-and-gravel wells (median 4.0 mg/L) had slightly higher dissolved oxygen concentrations than samples from bedrock wells (median 2.4 mg/L). Median concentrations of dissolved gases in samples from sand-and-gravel wells were 22.31 mg/L for nitrogen, 10.1 mg/L for carbon dioxide, 0.738 mg/L for argon, and 0.095 mg/L for methane. Median concentrations of dissolved gases in samples from bedrock wells were 23.03 mg/L for nitrogen, 13.0 mg/L for carbon dioxide, 0.758 mg/L for argon, and 0.028 mg/L for methane.
Methane was detected in 26 of the 34 samples, with a range of 0.002 mg/L to 47.2 mg/L. Although the EPA and NYSDOH do not have MCLs for methane, dissolved methane concentrations greater than 28 mg/L can pose explosion hazards as a result of methane accumulation in confined spaces (Eltschlager and others, 2001). The U.S. Department of Interior, Office of Surface Mining Reclamation and Enforcement, recommends that methane concentrations ranging from 10 to 28 mg/L in water signify an action level at which the situation should be closely monitored; if the concentration of methane increases, enclosed areas should be vented to prevent gas buildup (Eltschlager and others, 2001). The concentrations of methane in the two duplicate samples from 1 sand-and-gravel well (CT 473, 47.2 mg/L and 46.1 mg/L) and from 2 bedrock wells (GS1162, 29.9 mg/L and 29.5 mg/L; WO1378, 41.1 mg/L and 39.3 mg/L) were greater than the safety threshold of 28 mg/L.
Major Ions and Dissolved Solids
Groundwater samples were analyzed for the cations calcium, magnesium, potassium, and sodium; for the anions chloride, fluoride, silica, and sulfate; and for hardness, alkalinity, and dissolved solids. Results are reported in table 7 and in Gaige (2023). The number of samples that exceeded drinking-water standards for major ions and dissolved solids are reported in table 8. No drinking-water standards have been established for calcium, magnesium, potassium, silica, hardness, or alkalinity.
Table 7.
Summary statistics for concentrations of major ions, hardness, alkalinity, and dissolved solids in groundwater samples collected in the Mohawk and western New York River Basins, New York, 2016.[All concentrations are in milligrams per liter in filtered water; °C, degrees Celsius; CaCO3, calcium carbonate. Bold values (which are also footnoted) exceed one or more drinking-water or safety standard. Data from the western New York River Basins E2925 sample, collected in November, are excluded from the computation of concentration medians, detections, and maximum values]
Table 8.
Drinking-water standards for concentrations of major ions and dissolved solids, and number of groundwater samples collected in the Mohawk and western New York River Basins, New York, 2016, in which those standards were exceeded.[All concentrations are in milligrams per liter in filtered water. Data from the western New York River Basins E2925 sample, collected in November, are excluded from the computation of concentration medians, detections, and maximum values. °C, degree Celsius]
U.S. Environmental Protection Agency (2012) drinking water advisory taste threshold.
New York State Department of Health (2011) maximum contaminant level.
U.S. Environmental Protection Agency (2012) secondary drinking water standard.
U.S. Environmental Protection Agency (2012) maximum contaminant level.
In the Mohawk River Basin, the anions detected in the highest concentrations were sulfate (median concentration 28.4 mg/L in sand-and-gravel wells, 15.4 mg/L in bedrock wells) and chloride (median concentration 25.9 mg/L in sand-and-gravel wells, 29.0 mg/L in bedrock wells) (table 7 and Gaige, 2023). The cations detected in the highest concentrations were calcium (median concentration 65.8 mg/L in sand-and-gravel wells, 51.4 mg/L in bedrock wells), and sodium (median concentration 19.5 mg/L in sand-and-gravel wells, 27.6 mg/L in bedrock wells). The concentration of sodium in 2 sand-and-gravel wells and 4 bedrock wells exceeded the EPA Drinking Water Advisory Taste Threshold of 60 mg/L. The highest concentration of sodium was in bedrock well SO 527 (241 mg/L). The concentration of chloride in bedrock well SO 527 was 264 mg/L and exceeded the EPA MCL and the NYSDOH MCL of 250 mg/L. The concentrations of fluoride and sulfate did not exceed established MCLs in any sample (table 8 and Gaige, 2023).
For samples in the Mohawk River Basin, 5 samples were classified as “soft” (0 to 60 mg/L as calcium carbonate, [CaCO3]), 3 samples were classified as “hard” (121 to 180 mg/L as CaCO3), and 14 samples were classified as “very hard” (greater than [>] 180 mg/L as CaCO3) (Hem, 1985). The median hardness was 222 mg/L as CaCO3 for sand-and-gravel wells and 172 mg/L as CaCO3 for bedrock wells; the maximum hardness was 436 mg/L as CaCO3 (sand-and-gravel well, SA1089; Gaige, 2023). Alkalinity ranged from 30.7 to 343 mg/L as CaCO3; the median was 194 mg/L as CaCO3 for sand-and-gravel wells and 188 mg/L as CaCO3 for bedrock wells. Dissolved solids concentrations ranged from 59 to 682 mg/L for all wells in the Mohawk River Basin with a median of 303 mg/L for sand-and-gravel wells and 277 mg/L for bedrock wells. Dissolved solids concentration in 1 sample from a sand-and-gravel well (SA 1089, 541 mg/L) and 2 samples from bedrock wells (SO 527, 682 mg/L; SO1976, 564 mg/L) exceeded the EPA SDWS for dissolved solids of 500 mg/L (table 8 and Gaige, 2023).
In the western New York River Basins, the anions detected with the highest concentrations were chloride (median concentration 65.4 mg/L in sand-and-gravel wells, 57.9 mg/L in bedrock wells) and sulfate (median concentration 14.6 mg/L in sand-and-gravel wells, 15.2 mg/L in bedrock wells) (table 7 and Gaige, 2023). The cations detected in the highest concentrations were calcium (median concentration 57.1 mg/L in sand-and-gravel wells, 72.4 mg/L in bedrock wells) and sodium (median concentration 38.0 mg/L in sand-and-gravel wells, 32.4 mg/L in bedrock wells). The concentration of sodium in 5 samples from sand-and-gravel wells and 4 samples from bedrock wells exceeded the EPA Drinking Water Advisory Taste Threshold of 60 mg/L. The highest sodium concentration was detected in bedrock well MO1826 (369 mg/L). The concentration of chloride in 1 sample from a sand-and-gravel well (E1904, 261 mg/L) and 2 samples from bedrock wells (GS1162, 380 mg/L; MO1826, 597 mg/L) exceeded the EPA MCL and the NYSDOH MCL of 250 mg/L. The concentrations of fluoride and sulfate did not exceed established MCLs in any sample (table 8 and Gaige, 2023).
For samples in the western New York River Basins, 5 samples were classified as “moderately hard” (61 to 120 mg/L as CaCO3), 7 as “hard,” and 22 as “very hard” (Hem, 1985). The median hardness was 202 mg/L as CaCO3 for sand-and-gravel wells and 272 mg/L as CaCO3 for bedrock wells, and the maximum hardness was 521 mg/L as CaCO3. Alkalinity ranged from 79.7 to 386 mg/L as CaCO3; the median was 170 mg/L as CaCO3 for sand-and-gravel wells, and 220 mg/L as CaCO3 for bedrock wells. Dissolved solids concentrations ranged from 110 to 1,450 mg/L, with a median of 302 mg/L for sand-and-gravel wells and 399 mg/L for bedrock wells. Dissolved solids concentration in 3 samples from sand-and-gravel wells and 5 samples from bedrock wells exceeded the EPA SDWS for total dissolved solids of 500 mg/L (table 8 and Gaige, 2023).
Nutrients and Total Organic Carbon
Groundwater samples were analyzed for several nutrients, including ammonia plus organic nitrogen, ammonia, nitrate plus nitrite, nitrite, and orthophosphate, as well as total organic carbon. The concentration of nitrate was calculated by subtracting the concentration of nitrite from that of nitrate plus nitrite. Results are reported in table 9 and in Gaige (2023). The number of samples that exceeded drinking-water standards for nitrate and nitrite are reported in table 10. Drinking-water standards have not been established for ammonia plus organic nitrogen, ammonia, orthophosphate, and total organic carbon.
Table 9.
Summary statistics for concentrations of nutrients in groundwater samples collected in the Mohawk and western New York River Basins, New York, 2016.[All concentrations in milligrams per liter and are in filtered water except as noted. Data from the western New York River Basins E2925 sample, collected in November, are excluded from the computation of concentration medians, detections, and maximum values. N, nitrogen; P, phosphorus; <, less than; V, value may be affected by contamination]
Table 10.
Drinking-water standards for concentrations of nutrients, and number of groundwater samples collected in the Mohawk and western New York River Basins, New York, 2016, in which those standards were exceeded.[All concentrations in milligrams per liter in filtered water. Data from the western New York River Basins E2925 sample, collected in November, are excluded from the computation of concentration medians, detections, and maximum values. N, nitrogen]
U.S. Environmental Protection Agency (2012) maximum contaminant level.
New York State Department of Health (2011) maximum contaminant level.
The nutrients most detected in the Mohawk River Basin were ammonia and orthophosphate (table 9 and Gaige, 2023). The concentrations of ammonia ranged from <0.01 to 1.34 mg/L as nitrogen (N), and median values were the same (0.04 mg/L as N) in samples from sand-and-gravel wells and bedrock wells). Orthophosphate concentrations ranged from <0.004 to 0.130 mg/L as phosphorus (P), and median values were the same (0.004 mg/L as P) in both types of wells. The concentrations of ammonia plus organic nitrogen (N) ranged from <0.07 to 1.4 mg/L as N, and here, too, median concentrations were the same in samples from both types of wells (median 0.08 mg/L as N) (table 9). The concentrations of nitrate and of nitrate plus nitrite did not exceed the NYSDOH and EPA MCL of 10 mg/L as N in any sample (table 10 and Gaige, 2023). Nitrite was detected in only 2 of 22 samples and did not exceed the NYSDOH and EPA MCL of 1 mg/L as N in any sample. Total organic carbon was detected in 12 of the 22 samples and was generally greater in sand-and-gravel wells (median 2.3 mg/L) than in bedrock wells (median <0.7 mg/L); the maximum concentration of total organic carbon for all wells in the Mohawk River Basin was 7.9 mg/L.
The nutrient most detected in the western New York River Basins was ammonia (table 9 and Gaige, 2023). The concentration of ammonia ranged from <0.01 to 4.71 mg/L as N and was generally greater in samples from bedrock wells (median 0.33 mg/L as N) than in samples from sand-and-gravel wells (median 0.03 mg/L as N). The concentrations of ammonia plus organic N ranged from <0.07 to 5.3 mg/L as N and were generally greater in samples from bedrock wells (median 0.35 mg/L as N) than in samples from sand-and-gravel wells (median 0.08 mg/L as N) (table 9). The concentrations of nitrate and of nitrate plus nitrite did not exceed the NYSDOH and EPA MCL of 10 mg/L as N in any sample (table 10 and Gaige, 2023). Nitrite was detected in 8 of the 34 samples and did not exceed the NYSDOH and EPA MCL of 1 mg/L as N in any sample. Orthophosphate concentrations ranged from <0.004 to 0.188 mg/L as P. Total organic carbon was detected in 18 of the 34 samples; the maximum concentration was 8.1 mg/L.
Trace Elements
Twenty-five trace elements were analyzed in filtered and unfiltered groundwater samples. Results are reported in table 11 and in Gaige (2023). The number of samples in which drinking-water standards for trace elements were exceeded are reported in table 12. Drinking-water standards have not been established for cobalt and lithium.
Table 11.
Summary statistics for concentrations of trace elements in groundwater collected in the Mohawk and western New York River Basins, New York, 2016.[All concentrations in micrograms per liter in unfiltered water except as noted. Bold values (also footnoted) exceed one or more drinking-water or safety standard. Data from the western New York River Basins E2925 sample, collected in November, are excluded from the computation of concentration medians, detections, and maximum values. <, less than]
Table 12.
Drinking-water standards for concentrations of trace elements, and number of groundwater samples collected in the Mohawk and western New York River Basins, New York, 2016, in which those standards are exceeded.[All concentrations in micrograms per liter in unfiltered water. Data from the western New York River Basins E2925 sample, collected in November, are excluded from the computation of concentration medians, detections, and maximum values]
U.S. Environmental Protection Agency (2012) secondary drinking water standard.
U.S. Environmental Protection Agency (2012) maximum contaminant level.
New York State Department of Health (2011) maximum contaminant level.
U.S. Environmental Protection Agency (2012) lifetime health advisory.
U.S. Environmental Protection Agency (2012) single-day health advisory.
U.S. Environmental Protection Agency (2012) treatment technique.
In the Mohawk River Basin, the highest median concentrations of trace elements were those for strontium (374 µg/L in sand-and-gravel wells and 694 µg/L in bedrock wells); iron (225 µg/L in unfiltered water from sand-and-gravel wells and 230 µg/L in unfiltered water from bedrock wells); and barium (96.8 µg/L in sand-and-gravel wells and 92.1 µg/L in bedrock wells) (table 11 and Gaige, 2023).
The concentration of iron, unfiltered, in 11 samples (4 sand-and-gravel wells and 7 bedrock wells) exceeded the NYSDOH MCL and EPA SDWS of 300 µg/L; the maximum iron concentration was 2,950 µg/L in an unfiltered sample (H 244) (table 12 and Gaige, 2023) in the Mohawk River Basin. Seven of the 11 samples also exceeded the NYSDOH MCL and EPA SDWS for iron in filtered samples. The concentration of manganese in 9 of 22 samples from the Mohawk River Basin (4 from sand-and-gravel wells, 5 from bedrock wells) exceeded the EPA SDWS of 50 µg/L in unfiltered and filtered samples. The concentrations of manganese in four of these samples further exceeded the NYSDOH MCL of 300 µg/L. The maximum manganese concentration was 1,930 µg/L (SA1501). Samples from 1 sand-and-gravel well (A1169, 254 µg/L) and 2 bedrock wells (SO 459, 634 µg/L; SO 527, 844 µg/L) had concentrations of aluminum that exceeded the EPA SDWS of 50–200 µg/L. There is currently no drinking-water standard established for strontium; however, the EPA does have a lifetime health advisory of 4,000 µg/L and a single-day health advisory of 25,000 µg/L for strontium (U.S. Environmental Protection Agency, 2012). Two bedrock wells in the Mohawk River basin exceeded the lifetime health advisory for strontium (SN1257, 4,180 µg/L; SO2048, 4,180 µg/L). Drinking-water standards for antimony, arsenic, barium, beryllium, boron, cadmium, chromium, copper, lead, mercury, molybdenum, nickel, selenium, silver, thallium, zinc, and uranium were not exceeded (table 12 and Gaige, 2023). Silver was not detected in any of the 22 Mohawk River Basin samples collected (tables 11 and 12; Gaige, 2023).
In samples collected in the western New York River Basins, the trace elements present in the highest median concentrations were strontium (166 µg/L in sand-and-gravel wells, 768 µg/L in bedrock wells), iron (65.7 µg/L in unfiltered water from sand-and-gravel wells, 482 µg/L in unfiltered water from bedrock wells), barium (216 µg/L in sand-and-gravel wells, 184 µg/L in bedrock wells), manganese (27.5 µg/L in unfiltered water from sand-and-gravel wells, 106 µg/L in unfiltered water from bedrock wells), and boron (32 µg/L in filtered water from sand-and-gravel wells, 122 µg/L in filtered water from bedrock wells) (table 11 and Gaige, 2023). The concentration of aluminum in two samples from bedrock wells (GS 752, 1,380 µg/L; OL 356, 1,640 µg/L) exceeded the EPA SDWS of 50–200 µg/L (table 12 and Gaige, 2023) in the western New York River Basins. The concentration of arsenic in one sample from bedrock well OL 356 (34.1 µg/L) exceeded the EPA MCL and NYSDOH MCL of 10 µg/L. The concentration of iron in 17 wells (5 sand-and-gravel wells and 12 bedrock wells) exceeded the NYSDOH MCL and EPA SDWS of 300 µg/L in unfiltered samples; the maximum iron concentration was 14,200 µg/L (August 2016 sample from E2925). Fifteen of 17 samples also had concentrations of iron that exceeded the MCL and SDWS when filtered. The concentration of manganese in 18 of 34 samples from the western New York River Basins (7 from sand-and-gravel wells, 11 from bedrock wells) exceeded the EPA SDWS of 50 µg/L in unfiltered samples; only 2 of the samples from those 18 wells did not have an exceedance in the associated filtered sample. The concentration of manganese in four of these filtered samples further exceeded the NYSDOH MCL of 300 µg/L. The maximum manganese concentration was 856 µg/L (E3392). Three bedrock wells in the western New York River Basins exceeded the lifetime health advisory for strontium (GS 752, 4,360 µg/L; GS1162, 6,260 µg/L; MO1826, 5,920 µg/L). Drinking-water standards for antimony, beryllium, boron, cadmium, chromium, copper, lead, mercury, molybdenum, nickel, selenium, silver, thallium, uranium, and zinc were not exceeded (tables 11 and 12; Gaige, 2023).
Pesticides
Groundwater samples were analyzed for 225 pesticides and pesticide degradates. No concentrations exceeded established drinking-water standards set for pesticides and pesticide degradates. Results of the analyses are reported in Gaige (2023).
In the Mohawk River Basin, 2 pesticides and 5 pesticide degradates were detected at trace concentrations in nine samples (Gaige, 2023). Most of the pesticides and degradates detected were broadleaf herbicides. Three of the wells with pesticide and degradate detections are sand-and-gravel production wells (OE1468, SA1089, and SA1501), and six are bedrock wells (H 244, MT 406, MT 860, OE1038, SN1257, and SO2048). The herbicide atrazine was detected in four wells (OE1468, H 244, OE1038, and SO2048). The insecticide propoxur was detected in four wells (SA1089, MT 406, MT 860, and SN1257). The pesticide degradate CIAT was detected in three wells (OE1468, OE1038, and SO2048). The pesticide degradate metolachlor sulfonic acid was detected in five wells (OE1468, SA1501, MT 406, OE1038, and SO2048); the highest concentration (376 nanograms per liter [ng/L]) was in the sample from well MT 406.
Samples from wells HE 624, FU 606, and SN1257 were analyzed for pesticides and their degradates by using both the LC–MS/MS method and GC–MS method; these dual, or duplicate, analyses were intended to allow a comparison of results from the different methods. Future sampling as part of this monitoring program will employ use of the LC–MS/MS method. Although no pesticides were detected in any of the samples analyzed with the G–MS method, the LC–MS/MS method indicated the presence of the insecticide propoxur, at 0.40 ng/L in the sample from well SN1257. Because the analysis for propoxur is included only in the LC–MS/MS method, the methods could not be fully compared.
In the western New York River Basins, 10 pesticides and 5 degradates were detected at trace concentrations in 16 samples. Most of the pesticides and degradates detected were broadleaf herbicides. Nine of the wells with pesticide and degradate detections are sand-and-gravel production wells (AG 265, CT 472, CU 595, CU 809, CU1490, CU2131, E 593, GS 216, and WO 351), and seven are bedrock wells (CT1067, CU3542, E3095, GS 189, GS 752, OL 19, and OL 356). Propoxur was detected in eight samples (AG 265, CT 472, CT1067, CU 809, CU1490, CU3542, E 593, and E3095). Metolachlor sulfonic acid was detected in six samples (CU 595, E 593, GS 189, OL 19, OL 356, and WO 351). Atrazine was detected in six samples (CT 472, CU 595, CU1490, CU2131, GS 216, and OL 19). CIAT was detected in five samples (CT 472, CU 595, CU1490, GS 189, and OL 19). Sand-and-gravel well CT 472 had trace concentrations of atrazine, chlorodiamino-S-triazine, CIAT, hexazinone, and propoxur. Sand-and-gravel well CU 595 had trace concentrations of 2-hydroxy-4-isopropylamino-6-amino-S-triazine, atrazine, chlorodiamino-S-triazine, CIAT, and metolachlor sulfonic acid. Bedrock well OL 19 had trace concentrations of atrazine, bentazon, CIAT, metolachlor, metolachlor sulfonic acid, prometon, and terbacil. The pesticide degradate metolachlor sulfonic acid was detected at the highest concentration (665 ng/L in OL 19). Samples from wells AG 265, CT1067, and E1903 were analyzed by using both the LC–MS/MS method and the GC–MS method. No pesticides were detected in any of the samples analyzed with the GC–MS method. In the sample from well CT1067, however, methoxyfenozide (6.41 ng/L) and propoxur (2.72 ng/L) were detected in the sample analyzed by using the LC–MS/MS method. Because the analyses for propoxur and methoxyfenozide are included only in the LC–MS/MS method, the methods could not be fully compared. In the sample from well AG 265, propoxur (1.41 ng/L) and tebuthiuron (2.28 ng/L) were detected in the sample analyzed by using the LC–MS/MS method. Only tebuthiuron was analyzed by both the LC–MS/MS method and the GC–MS method; however, it is not possible to compare the data between the two methods as the concentration in the sample analyzed with the LC–MS/MS method (2.28 ng/L) is considerably lower than the reporting level of the GC–MS method (28 ng/L).
Volatile Organic Compounds
Groundwater samples were analyzed for 34 VOCs. Established drinking-water standards for VOC concentrations were only exceeded by one sample. Results of these analyses are reported in Gaige (2023).
In the Mohawk River Basin, only trichloromethane (also known as chloroform) was detected. Trichloromethane is a disinfection byproduct in the trihalomethane (THM) class and forms when chlorine or bromine are used as disinfectants in water treatment. Trichloromethane was detected in a sample from 1 sand-and-gravel production well (HE 622, 0.2 µg/L) and 1 bedrock domestic well (SO 459, 0.1 µg/L).
In the western New York River Basins, 13 VOCs were detected in samples from 3 sand-and-gravel wells (E1904, GS 216, WO 351) and 3 bedrock wells (E2925, E3392, and OL 19) (Gaige, 2023). The VOCs detected included 4 THMs (bromodichloromethane, dibromochloromethane, tribromomethane, and trichloromethane), 3 solvents (1,1,1-trichloroethane, dichloromethane, and trichloroethene), 1 gasoline additive (methyl tert-butyl ether), and 6 widely used industrial chemicals (benzene, m-xylene plus p-xylene, o-xylene, tetrachloroethene, and toluene). In this report, m-xylene and p-xylene are counted as separate analyte detections, although both share the NWIS parameter code 85795. A sample collected in August of 2016 from 1 domestic bedrock well, E2925, had detections of 10 of these 14 VOCs. A second sample was collected in November of 2016 from this well to confirm these results; only benzene, m-xylene plus p-xylene, o-xylene, and toluene were detected in this second sample, all at slightly lower levels than in the August sample. The VOC detected at the highest concentration was toluene, 8.4 µg/L, in a sample from a bedrock production well (OL 19), which exceeded the NYSDOH MCL of 5 µg/L.
Radionuclides
Groundwater samples were analyzed for radon-222, gross-α activity and gross-β activity. Radon is currently (2021) not regulated in drinking water; however, the EPA has proposed a two-part standard for radon-222 in drinking water: (1) a 300-picocuries per liter (pCi/L) MCL for areas that do not implement an indoor-air radon-222 mitigation program and (2) an alternative MCL (AMCL) of 4,000 pCi/L for areas that do implement that program (U.S. Environmental Protection Agency, 1999). The EPA and NYSDOH MCLs for gross-α activity are 15 pCi/L. The EPA and NYSDOH MCLs for gross-β are 4 millirems per year, a dosage determination that requires knowledge of the specific radionuclide sources. The activity units (picocuries per liter) that were used to measure gross-β radioactivity in this study are not comparable to dosage units (millirems per year) without determination of the nuclide sources; therefore, it is not possible to determine whether any of the samples exceeded the MCL for gross-β radioactivity. Results are reported in Gaige (2023).
In the Mohawk River Basin, gross-α activity ranged from nondetectable levels to as great as 13.5 pCi/L (table 13 and Gaige, 2023). No samples exceeded the NYSDOH and EPA MCLs of 15 pCi/L for gross-α activity (table 14 and Gaige, 2023). Gross-β activities ranged from nondetectable levels to 9.2 pCi/L. Radon-222 activities in the water samples ranged from 20 to 3,800 pCi/L; the median activity was 360 pCi/L for sand-and-gravel wells and 246 pCi/L for bedrock wells. The highest radon-222 activities were in a sample from one bedrock well, SO 459 (3,800 pCi/L). 11 of the 22 Mohawk River Basin samples exceeded the proposed MCL of 300 pCi/L; no samples exceeded the proposed AMCL of 4,000 pCi/L.
Table 13.
Summary statistics for activities of radionuclides in groundwater samples collected in the Mohawk and western New York River Basins, New York, 2016.[All activities in picocuries per liter and are in unfiltered water. Bold values (which are also footnoted) exceed one or more proposed drinking-water or safety standards. Data from the western New York River Basins E2925 sample, collected in November, are excluded from the computation of concentration medians, detections, and maximum values. <, less than]
Table 14.
Drinking-water standards for activities of radionuclides, and number of groundwater samples collected in the Mohawk and western New York River Basins, New York, 2016, in which those standards were exceeded.[All activities in picocuries per liter in unfiltered water. mrem/yr denotes millirem per year. Activity units (picocuries per liter) used to measure gross-β radioactivity in this study are not comparable to dosage units (millirems per year). Data from the western New York River Basins E2925 sample, collected in November, are excluded from the computation of concentration medians, detections, and maximum values. --, not applicable]
U.S. Environmental Protection Agency (2012) maximum contaminant level.
New York State Department of Health (2011) maximum contaminant level.
U.S. Environmental Protection Agency (1999) proposed maximum contaminant level.
U.S. Environmental Protection Agency (1999) proposed alternative maximum contaminant level.
In the western New York River Basins, gross-α activity ranged from nondetectable levels to 7.8 pCi/L (table 13 and Gaige, 2023). No samples exceeded the NYSDOH and EPA MCLs of 15 pCi/L for gross-α activity. Gross-β activities ranged from nondetectable levels to 29 pCi/L. Radon-222 activities in the groundwater samples ranged from 31 to 2,520 pCi/L; the medians were 525 pCi/L in sand-and-gravel wells and 430 pCi/L in bedrock wells. The two highest radon-222 activities in bedrock samples were from wells completed in shale and sandstone (OL 294, 2,520 pCi/L; CT1176, 1,720 pCi/L). Radon-222 activities in 22 of the 34 western New York River Basins samples exceeded the proposed MCL of 300 pCi/L; no samples exceeded the proposed AMCL of 4,000 pCi/L (table 14 and Gaige, 2023).
Bacteria
Groundwater samples were analyzed for fecal indicator bacteria, including total coliform, fecal coliforms, and E. coli. Heterotrophic plate counts were made. Heterotrophic plate count is used to assess the overall bacterial load in the sample, which, in conjunction with fecal indicator bacteria, allows for inferring potential sources of contamination. The NYSDOH and EPA MCLs for total coliform bacteria in public water supplies are exceeded when 5 percent of samples of finished water collected in 1 month test positive for total coliforms (if 40 or more samples are collected per month) or when 2 samples of finished water test positive for total coliforms (if fewer than 40 samples are collected per month). In this report, in which conditions are based on the results of analysis of one sample per well, any detection of total coliform, fecal coliforms, or E. coli is reported as an exceedance. Results of analyses for fecal coliforms and E. coli are reported in colony-forming units per 100 milliliters (CFU/100 mL); results for total coliform bacteria are also reported in CFU/100 mL, with the exception of results from samples from wells E3095 and MO1826, which are reported as either present or absent; results of heterotrophic plate counts are reported in CFU per milliliter (CFU/mL). Results are reported in Gaige (2023).
In the Mohawk River Basin, no total coliform bacteria, fecal coliform bacteria, and E. coli were detected in any samples from any wells (Gaige, 2023). The heterotrophic plate count ranged from <1 CFU/mL to 1,482 CFU/mL, and the median value was <1 CFU/mL. The sample from well SO 459 (1,482 CFU/mL) was the only sample in which the EPA MCL of 500 CFU/mL was exceeded.
In the western New York River Basins, total coliform bacteria were detected in a sand-and-gravel well (CU2507) and in six samples from bedrock wells (CT1176, CT2884, CU3402, E3095, MO1826, OL 294). Total coliform bacteria in all these samples exceeded the EPA and NYSDOH MCLs (Gaige, 2023). The maximum detection of total coliform bacteria was 110 CFU/100mL (CU3402). Both fecal coliforms and E. coli were detected in one bedrock well CT2884 (1 CFU/100 mL, and 1 CFU/100 mL, respectively). Fecal coliform bacteria were detected in bedrock well E3095 at 120 CFU/100 mL. Samples from both CT2884 and E3095 exceeded the EPA and NYSDOH MCLs for fecal coliforms, and the sample from CT2884 exceeded the EPA and NYSDOH MCLs for E. coli. The heterotrophic plate count ranged from <1 CFU/mL to 340 CFU/mL; no samples exceeded the EPA MCL for heterotrophic plate count.
Comparison of Results from Wells Sampled in 2002, 2006, 2011, and 2016
A subset of 12 wells sampled in 2016 were previously sampled in all or some of the study rounds in 2011, 2006, and 2002. Of the 320 physicochemical properties, organic compounds, and inorganic compounds for which samples were analyzed in 2016, 147 were analyzed in 2011, and 140 were analyzed in 2006 and 2002. The NWQL annually updates the LRLs for all analytes on the basis of analytical method performance during the previous year of analysis; therefore, reporting levels and the determination of whether a concentration is considered “estimated” changes occasionally, and for this reason the reported concentrations of compounds could differ between the years 2002, 2006, 2011, and 2016. The rules for determining and adjusting LRLs and long-term method detection levels are outlined by the USGS Branch of Quality Systems (Childress and others, 1999). Results are reported in Gaige (2023).
Four of the Mohawk River Basin wells sampled in 2016 (wells HE 622, OE1468, SA1501, and MT 406) were sampled in 2011; HE 622, MT 406, and SA1501 were also sampled in 2006 and 2002. Well HE 624 was previously sampled in 2002. Overall, physicochemical properties for these wells exhibited little to no change (Gaige, 2023); however, for MT 406, color was lower in 2011 (<1 Pt-Co units) than in 2016 (8 Pt-Co units) and in 2006 (5 Pt-Co units). Concentrations of carbon dioxide decreased from 2011 to 2016 in wells HE 622, OE1468, SA1501, and MT 406. Concentrations of methane increased from 2011 to 2016 for wells OE1468, SA1501, and MT 406. Prior concentrations of dissolved solids in samples collected from wells HE 622 and MT 406 in 2002, 2006, and 2011 were above the EPA SDWS, but concentrations decreased to below the EPA SDWS in 2016 samples. Concentrations of nutrients, some dissolved gases (2011 and 2016 only), most major ions, and most trace elements exhibited little to no change in all five wells (Gaige, 2023). Concentrations of sulfate, magnesium, and potassium in well SA1501 decreased from 2002 to 2016. Concentrations of filtered and unfiltered iron decreased from 2002 to 2016 in well MT 406. Wells HE 622, HE 624, OE1468, and MT 406 all exhibited decreasing concentrations of nickel for each sample from 2002 to 2016. For well OE1468, CIAT was detected in both the 2011 sample (0.005 µg/L) and the 2016 sample (0.0123 µg/L). The addition of a more sensitive pesticide analysis method, as well as the ability to detect a broader suite of compounds during the 2016 round of sampling, likely resulted in detections of metolachlor sulfonic acid for OE1468, SA1501, and MT 406 (Gaige, 2023).
No VOCs were detected in samples from HE 624, OE1468, or MT 406 for all rounds of sampling. VOC detections in samples from HE 622 varied over the different rounds of sampling. In 2002, only methyl tert-butyl ether was detected (0.2 µg/L). In 2006, four VOCs, all of which were trihalomethanes, were detected—bromodichloromethane (0.3 µg/L), dibromochloromethane (0.7 µg/L), tribromomethane (0.8 µg/L), and trichloromethane (0.2 µg/L). No VOCs were detected in the 2011 sample from HE 622, but trichloromethane (0.2 µg/L) was detected in the 2016 sample. Methyl tert-butyl ether was detected in the sample from SA1501 in 2002, but no VOCs were detected in samples collected in 2006, 2011, and 2016 (Gaige, 2023).
Gross-α and gross-β activities exhibited little or no change for wells in the Mohawk River Basin. Wells HE 622, SA1501, and MT 406 exhibited decreasing concentrations of radon-222 between 2002 and 2016 (Gaige, 2023). Total coliform bacteria, fecal coliforms, and E. coli were not detected in any samples from these five resampled wells in the Mohawk River Basin. Heterotrophic plate count exhibited little to no change from 2002 through 2016 (Gaige, 2023).
Seven of the western New York River Basins wells sampled in 2016 (AG 265, CU2131, E1903, E1904, GS 216, WO 351, and OL 19) were sampled previously in 2011, and all but CU2131 were sampled in 2006. Overall, physicochemical properties exhibited little to no change for these wells during the sampling rounds (Gaige, 2023); however, for wells E1903 and OL 19, color was not detected in 2011 (both were <1 Pt-Co units) but was detected in 2006 (5 Pt-Co units and 2 Pt-Co units, respectively) and 2016 (5 Pt-Co units and 8 Pt-Co units, respectively). Samples from AG 265, CU2131, GS 216, and OL 19 exhibited a decreasing trend in concentrations of nitrate plus nitrite between 2006 and 2016. Dissolved solids concentrations increased in wells E1904 and WO 351 and decreased in wells AG 265, CU2131, E1903, and OL 19 (Gaige, 2023). Concentrations of most major ions and trace elements exhibited little to no change, although concentrations of sodium and chloride increased between 2006 and 2016 for wells E1903 and E1904. Sodium concentration in the samples from E1904 increased from 2006 to 2016, and sodium in both the 2011 and 2016 samples exceeded the EPA SDWS. Chloride concentration in the samples collected from E1904 in 2016 exceeded the EPA SDWS and NYSDOH MCL (Gaige, 2023). For well OL 19, iron concentrations (in both filtered and unfiltered samples) decreased from 2006 to 2011, to below the EPA SDWS and NYSDOH MCL, but then increased again in 2016, when the unfiltered iron concentration exceeded both standards. Wells E1903 and E1904 had iron concentrations greater than two times the EPA SDWS and NYSDOH MCL in each year when samples were collected. Concentrations of manganese (in both filtered and unfiltered samples) for well OL 19 increased substantially in the 2016 sample from below to well above the EPA SDWS and NYSDOH MCL. Overall, pesticide concentrations exhibited little to no change. For wells E1903 and E1904, no pesticides were detected in any of the samples collected in 2006, 2011 and 2016. For well CU2131, atrazine and prometon were detected in the samples from 2011 and 2016 (Gaige, 2023). For well OL 19, atrazine and metolachlor were detected in samples from 2006, 2011, and 2016. Additional detections or changes in concentration over time for E1903, E1904, CU2131, GS 216 and WO 351 are likely due to the increased sensitivity and broader suite of compounds that were analyzed by the new pesticide method used in 2016, compared to results from the method used to analyze samples collected in 2006 and 2011 (Gaige, 2023). No VOCs were detected in samples from well E1903 (Gaige, 2023). Dibromochloromethane (0.1 µg/L) and tetrachloromethane (0.2 µg/L) were detected in the 2006 sample from AG 265, but no VOCs were detected in the 2011 and 2016 samples. 1,1,1-trichloroethane (0.1 µg/L) was detected in the 2011 sample from CU2131 but was not detected in the 2016 sample. Methyl tert-butyl ether was detected in samples from E1904 in 2006, 2011, and 2016. For well GS 216, 1,1,1-trichloroethane, tetrachloroethene, trichloroethene, and trichloromethane were detected in samples from 2006, 2011, and 2016; 1,1-dichloroethane was detected only in the 2006 sample. For well OL 19, toluene was detected in the 2011 and 2016 samples (Gaige, 2023). Gross-α and gross-β activities exhibited little to no change for wells in the western New York River Basins. Radon detection has increased in well OL 19 each year that it was sampled (Gaige, 2023). Fecal coliform bacteria and E. coli were not detected in any samples from these seven western New York River Basins wells. Total coliform was detected in only one of these wells, WO 351, and only in the 2011 sample (21 CFU/100 mL). Heterotrophic plate counts increased across the three rounds of sampling for both WO 351 and OL 19, including a particularly large increase in the 2016 sample from OL 19 in comparison to previous samples (Gaige, 2023).
Summary
Water samples were collected from July through December 2016 from 22 wells in the Mohawk River Basin and 34 wells in the western New York River Basins to characterize the overall groundwater quality in each of these basins. Samples were collected and analyzed by using standard U.S. Geological Survey methods and other documented procedures. The samples were measured for physicochemical properties and analyzed for concentrations of dissolved gases, major ions, nutrients, trace elements, pesticides, volatile organic compounds, radionuclides, and bacteria. About 72 percent (230 of 320) of constituents for which the samples were analyzed were not detected at concentrations greater than laboratory reporting levels in any of the samples.
Nine of the 22 wells sampled in the Mohawk River Basin are production wells, and the remaining 13 are domestic wells. Samples from these wells generally had few exceedances of State or Federal drinking-water standards, although values or concentrations of some properties or constituents—pH, color, aluminum, iron, manganese, sodium, chloride, dissolved solids, radon-222, and heterotrophic plate count—equaled or exceeded primary, secondary, or proposed drinking-water standards. Samples from all but two of the wells contained concentrations of at least one constituent equal to or greater than a primary, secondary, or proposed drinking water standard. The constituents most frequently detected in concentrations exceeding the primary, secondary, or proposed standards were iron (unfiltered; 11 out of 22 samples) and manganese (both filtered and unfiltered; 9 out of 22 samples). Additionally, 11 of 22 samples collected in the Mohawk River Basin had radon-222 activities equal to or greater than the U.S. Environmental Protection Agency proposed maximum contaminant level (MCL) of 300 picocuries per liter. The highest radon-222 activities were in samples from wells completed in bedrock.
In the Mohawk River Basin, pH was typically near neutral. The groundwater was typically categorized as very hard based on CaCO3 hardness. The median dissolved solids concentration was 303 milligrams per liter (mg/L) in sand-and-gravel wells and 277 mg/L in bedrock wells. The ions detected in the highest median concentrations were calcium, sodium, chloride and sulfate. The dominant nutrients were ammonia and orthophosphate, and concentrations of nitrate and nitrite did not exceed established drinking-water standards. Strontium, iron (unfiltered), and barium were the trace elements with the highest median concentrations. Iron (unfiltered) concentrations exceeded drinking-water standards in samples from 11 wells; the maximum concentration was 2,950 micrograms per liter. Manganese concentrations (filtered and unfiltered) exceeded drinking-water standards in nine samples. Two pesticides and five pesticide degradates were detected in nine samples. Two samples had detections for a volatile organic compound. Radon-222 activity in 11 samples exceeded a proposed MCL, but no samples exceeded the proposed alternative maximum contaminant level. Heterotrophic plate count exceeded the U.S. Environmental Protection Agency MCL in one sample.
In the western New York River Basins, 17 of the 34 wells sampled are production wells, and 17 are domestic wells. The samples had several exceedances of either State or Federal drinking-water standards, and the values of properties and concentrations of some constituents—color, sodium, dissolved solids, chloride, iron, manganese, arsenic, aluminum, barium, strontium, radon-222, methane, total coliform bacteria, and fecal coliform bacteria, and Escherichia coli (E. coli)—equaled or exceeded a primary, secondary, or proposed drinking-water standard. Samples from all but 3 of the 34 wells contained concentrations of at least 1 constituent equal to or greater than a primary, secondary, or proposed drinking water standard. The constituents most frequently detected in concentrations exceeding the standards were manganese (unfiltered; 18 out of 34 samples) and iron (unfiltered; 17 out of 34 samples). Radon-222 activities were equal to or greater than the proposed U.S. Environmental Protection Agency MCL of 300 picocuries per liter in 22 out of 34 samples. The highest radon-222 activities were in samples from wells completed in bedrock.
In samples from the western New York River Basins, pH was typically near neutral. Methane was detected in 26 of the 34 samples, and the recommended monitoring concentration for methane, 28 mg/L, was exceeded in samples from 3 wells. The groundwater was generally categorized as very hard based on CaCO3 hardness, and the median dissolved solids concentration was 302 mg/L in sand-and-gravel wells and 399 mg/L in bedrock wells. The ions detected in the highest median concentrations were calcium, sodium, and chloride. The dominant nutrient was ammonia; concentrations of nitrate and nitrite did not exceed established drinking-water standards. Strontium, iron, barium, manganese, and boron were the trace elements with the highest median concentrations. Eight pesticides and 7 pesticide degradates were detected in 16 samples. Fourteen volatile organic compounds were detected in six samples. Radon-222 activities in 22 of 34 samples exceeded a proposed MCL. Total coliform bacteria were detected in 7 samples, fecal coliforms were detected in 2 of those samples, and E. coli were detected in 1 of those samples.
References Cited
American Public Health Association, 1998, Standard methods for the examination of water and wastewater (20th ed.): Washington, D.C., American Public Health Association, American Water Works Association, and Water Environment Federation [variously paged], accessed June 23, 2020, at https://www.standardmethods.org/.
ASTM International, 2006, D5072–98 (2006), Standard test method for radon in drinking water: ASTM International web page, accessed December 28, 2006, at http://www.astm.org.
Busenberg, E., Plummer, L.N., Bartholomay, R.C., and Wayland, J.E., 1998, Chlorofluorocarbons, sulfur hexafluoride, and dissolved permanent gases in ground water from selected sites in and near the Idaho National Engineering and Environmental Laboratory, Idaho, 1994–97: U.S. Geological Survey Open-File Report 98–274, 72 p., accessed June 23, 2020, at https://pubs.er.usgs.gov/publication/ofr98274.
Childress, C.J.O., Foreman, W.T., Connor, B.F., and Maloney, T.J., 1999, New reporting procedures based on long-term method detection levels and some considerations for interpretations of water-quality data provided by the U.S. Geological Survey National Water Quality Laboratory: U.S. Geological Survey Open-File Report 99–193, 19 p. [Also available at https://doi.org/10.3133/ofr99193.]
Coates, D.R., 1966, Glaciated Appalachian Plateau—Till shadows on hills: Science, v. 152, no. 3729, p. 1617–1618. [Also available at https://doi.org/10.1126/science.152.3729.1617.]
Connor, B.F., Rose, D.L., Noriega, M.C., Murtagh, L.K., and Abney, S.R., 1998, Methods of analysis by the U.S. Geological Survey National Water Quality Laboratory—Determination of 86 volatile organic compounds in water by gas chromatography/mass spectrometry, including detections less than reporting limits: U.S. Geological Survey Open-File Report 97–829, 78 p., accessed February 27, 2014, at http://nwql.usgs.gov/Public/rpt.shtml?OFR-97-829.
Dieter, C.A., Linsey, K.S., Caldwell, R.R., Harris, M.A., Ivahnenko, T.I., Lovelace, J.K., Maupin, M.A., and Barber, N.L., 2018, Estimated use of water in the United States county-level data for 2015 (ver. 2.0, June 2018): U.S. Geological Survey data release, accessed November 19, 2020, at https://water.usgs.gov/watuse/data/data2015.html. [Also available at https://doi.org/10.5066/F7TB15V5.]
Eckhardt, D.A., Reddy, J.E., and Shaw, S.B., 2009, Groundwater quality in central New York, 2007: U.S. Geological Survey Open-File Report 2009–1257, 40 p., accessed February 27, 2014, at https://pubs.usgs.gov/of/2009/1257/.
Eckhardt, D.A., Reddy, J.E., and Tamulonis, K.L., 2007, Ground-water quality in the Genesee River Basin, New York, 2005–06: U.S. Geological Survey Open-File Report 2007–1093, 26 p., accessed February 27, 2014, at https://pubs.usgs.gov/of/2007/1093/.
Eckhardt, D.A., Reddy, J.E., and Tamulonis, K.L., 2008, Ground-water quality in western New York, 2006: U.S. Geological Survey Open-File Report 2008–1140, 36 p., accessed February 27, 2014, at https://pubs.usgs.gov/of/2008/1140/.
Fishman, M.J., ed., 1993, Methods of analysis by the U.S. Geological Survey National Water Quality Laboratory—Determination of inorganic and organic constituents in water and fluvial sediments: U.S. Geological Survey Open-File Report 93–125, 217 p., accessed February 27, 2014, at https://pubs.usgs.gov/of/1993/0125/report.pdf.
Fishman, M.J., and Friedman, L.C., eds., 1989, Methods for determination of inorganic substances in water and fluvial sediments: U.S. Geological Survey Techniques of Water-Resources Investigations, book 5, chap. A1, 545 p., accessed February 27, 2014, at https://pubs.usgs.gov/twri/twri5-a1/html/pdf.html.
Furlong, E.T., Anderson, B.D., Werner, S.L., Soliven, P.P., Coffey, L.J., and Burkhardt, M.R., 2001, Methods of analysis by the U.S. Geological Survey National Water Quality Laboratory—Determination of pesticides in water by graphitized carbon-based solid-phase extraction and high-performance liquid chromatography/mass spectrometry: U.S. Geological Survey Water-Resources Investigations Report 01–4134, 73 p., accessed July 13, 2020, at https://nwql.usgs.gov/WRIR-01-4134.shtml.
Gaige, D.L., 2023, Groundwater quality data from the Mohawk and western New York River Basins, New York, 2016: U.S. Geological Survey data release, https://doi.org/10.5066/P9YNH96T.
Garbarino, J.R., and Damrau, D.L., 2001, Methods of analysis by the U.S. Geological Survey National Water Quality Laboratory—Determination of organic plus inorganic mercury in filtered and unfiltered natural water with cold vapor-atomic fluorescence spectrometry: U.S. Geological Survey Water-Resources Investigations Report 01–4132, 16 p., accessed February 27, 2014, at https://nwql.usgs.gov/WRIR-01-4132.shtml.
Garbarino, J.R., Kanagy, L.K., and Cree, M.E., 2006, Determination of elements in natural-water, biota, sediment and soil samples using collision/reaction cell inductively coupled plasma-mass spectrometry: U.S. Geological Survey Techniques and Methods, book 5, chap. B1, 88 p., accessed February 27, 2014, at https://pubs.usgs.gov/tm/2006/tm5b1/.
Garbarino, J.R., and Struzeski, T.M., 1998, Methods of analysis by the U.S. Geological Survey National Water Quality Laboratory—Determination of elements in whole-water digests using inductively coupled plasma-optical emission spectrometry and inductively coupled plasma-mass spectrometry: U.S. Geological Survey Open-File Report 98–165, 101 p., accessed February 27, 2014, at https://nwql.usgs.gov/OFR-98-165.shtml.
Hammond, D.S., Heath, R.C., and Waller, R.M., 1978, Ground-water data on the Hudson River Basin, New York: U.S. Geological Survey Open-File Report 78–710, 18 p., accessed January 24, 2020, at https://pubs.usgs.gov/of/1978/0710/report.pdf.
Hetcher-Aguila, K.K., 2005, Ground-water quality in the Chemung River Basin, New York, 2003: U.S. Geological Survey Open-File Report 2004–1329, 19 p., accessed February 27, 2014, at https://ny.water.usgs.gov/pubs/of/of041329/.
Hetcher-Aguila, K.K., and Eckhardt, D.A., 2006, Ground-water quality in the upper Susquehanna River Basin, New York, 2004: U.S. Geological Survey Open-File Report 2006–1161, 21 p., accessed February 27, 2014, at https://pubs.usgs.gov/of/2006/1161/.
Hoffman, G.L., Fishman, M.J., and Garbarino, J.R., 1996, Methods of analysis by the U.S. Geological Survey National Water Quality Laboratory—In-bottle acid digestion of whole-water samples: U.S. Geological Survey Open-File Report 96–225, 28 p., accessed February 27, 2014, at https://pubs.usgs.gov/of/1996/0225/report.pdf.
Homer, C.G., Dewitz, J.A., Yang, L., Jin, S., Danielson, P., Xian, G., Coulston, J., Herold, N.D., Wickham, J.D., and Megown, K., 2015, Completion of the 2011 National Land Cover Database for the conterminous United States-Representing a decade of land cover change information: Photogrammetric Engineering and Remote Sensing, v. 81, no. 5, p. 345–354.
New York State Department of Health, 2011, New York State Health Department public water systems regulations: Albany, N.Y., New York State Department of Health, [variously paged], accessed March 12, 2018, at https://www.health.ny.gov/regulations/nycrr/title_10/part_5/docs/subpart_5-1_tables.pdf.
Nystrom, E.A., 2006, Ground-water quality in the Lake Champlain Basin, New York, 2004: U.S. Geological Survey Open-File Report 2006–1088, 22 p., accessed February 27, 2014, at https://pubs.usgs.gov/of/2006/1088/.
Nystrom, E.A., 2007a, Ground-water quality in the Delaware River Basin, New York, 2001 and 2005–06: U.S. Geological Survey Open-File Report 2007–1098, 36 p., accessed February 27, 2014, at https://pubs.usgs.gov/of/2007/1098/.
Nystrom, E.A., 2007b, Ground-water quality in the St. Lawrence River Basin, New York, 2005–06: U.S. Geological Survey Open-File Report 2007–1066, 33 p., accessed February 27, 2014, at https://pubs.usgs.gov/of/2007/1066/.
Nystrom, E.A., 2008, Ground-water quality in the Mohawk River Basin, New York, 2006: U.S. Geological Survey Open-File Report 2008–1086, 33 p., accessed February 27, 2014, at https://pubs.usgs.gov/of/2008/1086/.
Nystrom, E.A., 2009, Groundwater quality in the Upper Hudson River Basin, New York, 2007: U.S. Geological Survey Open-File Report 2009–1240, 37 p., accessed February 27, 2014, at https://pubs.usgs.gov/of/2009/1240/.
Nystrom, E.A., 2010, Groundwater quality in the Lower Hudson River Basin, New York, 2008: U.S. Geological Survey Open-File Report 2010–1197, 39 p., accessed February 27, 2014, at https://pubs.usgs.gov/of/2010/1197/.
Nystrom, E.A., 2011, Groundwater quality in the Lake Champlain Basin, New York, 2009: U.S. Geological Survey Open-File Report 2011–1180, 42 p., accessed February 27, 2014, at https://pubs.usgs.gov/of/2011/1180/.
Nystrom, E.A., 2012, Groundwater quality in the Delaware and St. Lawrence River Basins, New York, 2010: U.S. Geological Survey Open-File Report 2011–1320, 58 p., accessed February 27, 2014, at https://pubs.usgs.gov/of/2011/1320/.
Nystrom, E.A., and Scott, T., 2013, Groundwater quality in the Mohawk River Basin, New York, 2011: U.S. Geological Survey Open-File Report 2013–1021, 43 p., accessed February 27, 2014, at https://pubs.usgs.gov/of/2013/1021/.
Patton, C.J., and Truitt, E.P., 2000, Methods of analysis by the U.S. Geological Survey National Water Quality Laboratory—Determination of ammonium plus organic nitrogen by a Kjeldahl digestion method and an automated photometric finish that includes digest cleanup by gas diffusion: U.S. Geological Survey Open-File Report 00–170, 31 p., accessed February 27, 2014, at https://pubs.usgs.gov/of/2000/0170/report.pdf.
Randall, A.D., 2001, Hydrogeologic framework of stratified-drift aquifers in the glaciated Northeastern United States: U.S. Geological Survey Professional Paper 1415–B, 179 p. [Also available at https://doi.org/10.3133/pp1415B.]
Reddy, J.E., 2012, Groundwater quality in the Genesee River Basin, 2010: U.S. Geological Survey Open-File Report 2012–1135, 29 p., accessed February 27, 2014, at https://pubs.usgs.gov/of/2012/1135/.
Reddy, J.E., 2013, Groundwater quality in western New York, 2011: U.S. Geological Survey Open-File Report 2013–1095, 28 p., accessed March 10, 2014, at https://pubs.usgs.gov/of/2013/1095/.
Reddy, J.E., 2014, Groundwater quality in central New York, 2012: U.S. Geological Survey Open-File Report 2014–1226, 13 p., accessed March 9, 2015, at https://pubs.usgs.gov/of/2014/1226/.
Reddy, J.E., and Risen, A.J., 2012, Groundwater quality in the Upper Susquehanna River Basin, 2009: U.S. Geological Survey Open-File Report 2012–1045, 30 p., accessed February 27, 2014, at https://pubs.usgs.gov/of/2012/1045/.
Reynolds, R.J., 1990, Availability of ground water from unconsolidated deposits in the Mohawk River basin, New York: U.S. Geological Survey Water-Resources Investigations Report 88–4091, 9 pls. [Also available at https://pubs.er.usgs.gov/publication/wri884091.]
Risen, A.J., and Reddy, J.E., 2011a, Groundwater quality in the Chemung River Basin, 2008: U.S. Geological Survey Open-File Report 2011–1112, 25 p., accessed February 27, 2014, at https://pubs.usgs.gov/of/2011/1112/.
Risen, A.J., and Reddy, J.E., 2011b, Groundwater quality in the Eastern Lake Ontario Basin New York, 2008: U.S. Geological Survey Open-File Report 2011–1074, 32 p., accessed February 27, 2014, at https://pubs.usgs.gov/of/2011/1074/.
Sandstrom, M.W., Kanagy, L.K., Anderson, C.A., and Kanagy, C.J., 2015, Determination of pesticides and pesticide degradates in filtered water by direct aqueous-injection liquid chromatography-tandem mass spectrometry: U.S. Geological Survey Techniques and Methods, book 5, chap. B11, 54 p., accessed March 6, 2018, at https://pubs.er.usgs.gov/publication/tm5B11.
Sandstrom, M.W., Stroppel, M.E., Foreman, W.T., and Schroeder, M.P., 2001, Methods of analysis by the U.S. Geological Survey National Water Quality Laboratory—Determination of moderate-use pesticides and selected degradates in water by C–18 solid-phase extraction and gas chromatography/mass spectrometry: U.S. Geological Survey Water-Resources Investigations Report 01–4098, 70 p., accessed July 13, 2020, at http://nwql.usgs.gov/Public/WRIR-01-4098.shtml.
Scott, T.-M., and Nystrom, E.A., 2014, Groundwater quality in the Upper Hudson River Basin, 2012: U.S. Geological Survey Open-File Report 2014–1084, 21 p., accessed September 8, 2014, at https://pubs.usgs.gov/of/2014/1084/.
Scott, T.-M., Nystrom, E.A., and Reddy, J.E., 2015, Groundwater quality in the Chemung River, Eastern Lake Ontario, and Lower Hudson River Basins, New York, 2013: U.S. Geological Survey Open-File Report 2015–1168, 41 p., accessed February 5, 2016, at https://doi.org/10.3133/ofr20151168/.
Scott, T-M., Nystrom, E.A., and Reddy, J.E., 2016, Groundwater quality in the Lake Champlain and Susquehanna River Basins, New York, 2014: U.S. Geological Survey Open-File Report 2016–1153, 33 p., accessed February 8, 2017, at https://doi.org/10.3133/ofr20161153.
Scott, T-M., Nystrom, E.A., and Reddy, J.E., 2019, Groundwater quality in the Delaware, Genesee, and St. Lawrence River Basins, New York, 2015: U.S. Geological Survey Open-File Report 2019–1005, 42 p., accessed December 9, 2019, at https://doi.org/10.3133/ofr20191005.
Struzeski, T.M., DeGiacomo, W.J., and Zayhowski, E.J., 1996, Methods of analysis by the U.S. Geological Survey National Water Quality Laboratory—Determination of dissolved aluminum and boron in water by inductively coupled plasma-atomic emission spectrometry: U.S. Geological Survey Open-File Report 96–149, 17 p., accessed February 27, 2014, at https://pubs.usgs.gov/of/1996/0149/report.pdf.
U.S. Environmental Protection Agency, 1980, Method 900.0—Gross alpha and gross beta reactivity in drinking water, section 1 of Prescribed procedures for measurement of radioactivity in drinking water: U.S. Environmental Protection Agency EPA–600/4–80–032, p. 1–9, accessed February 27, 2014, at https://www.epa.gov/sites/production/files/2015-06/documents/epa-900.0.pdf.
U.S. Environmental Protection Agency, 2012, National primary drinking water standards and national secondary drinking water standards: Washington, D.C., U.S. Environmental Protection Agency, Office of Water, EPA 816–F–09–0004, 6 p., accessed February 27, 2014, at https://www.epa.gov/sites/production/files/2016-06/documents/npwdr_complete_table.pdf.
U.S. Geological Survey, [variously dated], National field manual for the collection of water-quality data, section A of Handbooks for water-resources investigations: U.S. Geological Survey Techniques of Water-Resource Investigations, book 9, 10 chap. (A0–A8, A10), accessed May 18, 2021, at https://pubs.water.usgs.gov/twri9A.
U.S. Geological Survey, 2006, Collection of water samples (ver. 2.0, September 2006): U.S. Geological Survey Techniques of Water-Resources Investigations, book 9, chap. A4, [variously paged], accessed February 27, 2014, at https://pubs.water.usgs.gov/twri9A4/.
U.S. Geological Survey, 2022, USGS water data for the Nation: U.S. Geological Survey National Water Information System database, accessed January 1, 2022, at https://doi.org/10.5066/F7P55KJN.
Wilde, F.D., Radtke, D.B., Gibs, J., and Iwatsubo, R.T., eds., 2009, Processing of water samples (ver. 2.2 [with updates from 2004 through 2009]): U.S. Geological Survey Techniques of Water-Resources Investigations, book 9, chap. A5, [variously paged], accessed July 13, 2020, at https://pubs.water.usgs.gov/twri9A5/.
Zaugg, S.D., Sandstrom, M.W., Smith, S.G., and Fehlberg, K.M., 1995, Methods of analysis by the U.S. Geological Survey National Water Quality Laboratory—Determination of pesticides in water by C–18 solid-phase extraction and capillary-column gas chromatography/mass spectrometry with selected-ion monitoring: U.S. Geological Survey Open-File Report 95–181, 60 p., accessed July 13, 2020, at https://pubs.usgs.gov/of/1995/0181/report.pdf.
Conversion Factors
U.S. customary units to International System of Units
Temperature in degrees Celsius (°C) may be converted to degrees Fahrenheit (°F) as follows: °F = (1.8 × °C) + 32.
Temperature in degrees Fahrenheit (°F) may be converted to degrees Celsius (°C) as follows: °C = (°F – 32) / 1.8.
Datum
Vertical coordinate information is referenced to the North American Vertical Datum of 1988 (NAVD 88).
Horizontal coordinate information is referenced to the North American Datum of 1983 (NAD 83).
Elevation, as used in this report, refers to distance above the vertical datum.
Supplemental Information
Specific conductance is given in microsiemens per centimeter at 25 degrees Celsius (µS/cm at 25 °C).
Concentrations of chemical constituents in water are given in either milligrams per liter (mg/L), nanograms per liter (ng/L), or micrograms per liter (µg/L).
Activities for radioactive constituents in water are given in picocuries per liter (pCi/L).
Concentrations of bacteria in water are given in colony-forming units per 100 milliliters (CFU/100 mL); heterotrophic plate counts are in colony-forming units per milliliter (CFU/mL).
Color is reported in platinum-cobalt (Pt-Co) units.
Abbreviations
AMCL
alternative maximum contaminant level
ASL
above sea level
BLS
below land surface
CFU
colony-forming units
CIAT
2-chloro-4-isopropylamino-6-amino-S-triazine
EPA
U.S. Environmental Protection Agency
GC-MS
gas chromatography-mass spectrometry
gross-α
gross-alpha
gross-β
gross-beta
ICP-AES
inductively coupled plasma-atomic emission spectrometry
LRL
laboratory reporting level
MCL
maximum contaminant level
MTBE
methyl tert-butyl ether
NWIS
National Water Information System
NWQL
USGS National Water Quality Laboratory
NYSDEC
New York State Department of Environmental Conservation
NYSDOH
New York State Department of Health
SDWS
secondary drinking-water standards
THM
trihalomethane
USGS
U.S. Geological Survey
VOC
volatile organic compound
For more information about this report, contact:
Director, New York Water Science Center
U.S. Geological Survey
425 Jordan Road
Troy, NY 12180–8349
dc_ny@usgs.gov
(518) 285–5602
or visit our website at
Suggested Citation
Gaige, D.L., Scott, T.-M., Reddy, J.E., and Keefe, M.R., 2023, Groundwater quality in the Mohawk and western New York River Basins, New York, 2016: U.S. Geological Survey Open-File Report 2022–1021, 38 p., https://doi.org/10.3133/ofr20221021.
ISSN: 2331-1258 (online)
Study Area
| Publication type | Report |
|---|---|
| Publication Subtype | USGS Numbered Series |
| Title | Groundwater quality in the Mohawk and western New York River Basins, New York, 2016 |
| Series title | Open-File Report |
| Series number | 2022-1021 |
| DOI | 10.3133/ofr20221021 |
| Year Published | 2023 |
| Language | English |
| Publisher | U.S. Geological Survey |
| Publisher location | Reston, VA |
| Contributing office(s) | New York Water Science Center |
| Description | Report: viii, 38 p.; Data Release |
| Country | United States |
| State | New York |
| Other Geospatial | Mohawk and New York River basins |
| Online Only (Y/N) | Y |
| Additional Online Files (Y/N) | N |
| Google Analytic Metrics | Metrics page |